Growth Arrows

PowerPoint Template Leadership Onion Ppt Slides
PowerPoint Template Leadership Onion PPT Slides-Some are bound to be highly profitable for you to follow up. Put all this brilliant views to your audience.-PowerPoint Template Leadership Onion PPT Slides

PowerPoint Presentation Sales Onion Ppt Slides
PowerPoint Presentation Sales Onion PPT Slides-Some are bound to be highly profitable for you to follow up. Put all this brilliant views to your audience.-PowerPoint Presentation Sales Onion PPT Slides

PowerPoint Process Diagram Onion Ppt Theme
PowerPoint Process Diagram Onion PPT Theme-Some are bound to be highly profitable for you to follow up. Put all this brilliant views to your audience.-PowerPoint Process Diagram Onion PPT Theme
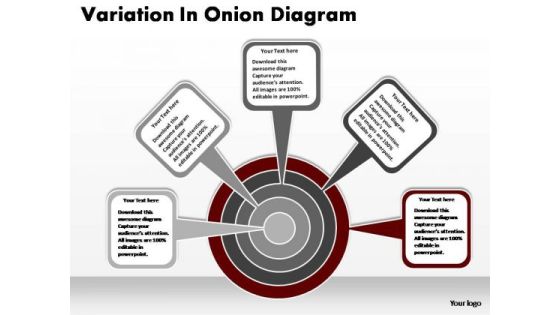
PowerPoint Process Strategy Onion Ppt Themes
PowerPoint Process Strategy Onion PPT Themes-Some are bound to be highly profitable for you to follow up. Put all this brilliant views to your audience.-PowerPoint Process Strategy Onion PPT Themes

Market And Customer Segmentation Ppt Images
This is a market and customer segmentation ppt images. This is a four stage process. The stages in this process are market and customer segmentation, identification of profit pools, brand positioning and development, customer solution pricing.

Overview Of Capital Budgeting Powerpoint Guide
This is a organizational learning models ppt example. This is a five stage process. The stages in this process are net present value, internal rate of return, profitability index, payback, discounted payback.

Cycle Of Management Accounting Tools Ppt Example Of Ppt
This is a cycle of management accounting tools ppt example of ppt. This is a four stage process. The stages in this process are balance sheet, profit and loss account, cash flow statement, fund flow statement.\n\n\n\n\n\n\n\n\n\n\n\n\n\n\n\n\n\n

Market Competitive Analysis Powerpoint Slide Deck
This is a market competitive analysis powerpoint slide deck. This is a six stage process. The stages in this process are customer analysis, true capabilities analysis, market competitive analysis, positioning and differentiating, segmenting and targeting, data mining and profiting.

E Commerce Strategy Layout Sample Diagram Powerpoint Ideas
This is a e commerce strategy layout sample diagram powerpoint ideas. This is a six stage process. The stages in this process are people and culture, the offer, infrastructure, customers, channels, profit, strategy.\n\n\n\n

Leadership Development Process Diagram Ppt Images
This is a leadership development process diagram ppt images. This is a seven stage process. The stages in this process are individual coaching, evaluation, greater profit, team training, assess needs, build rapport, set context.
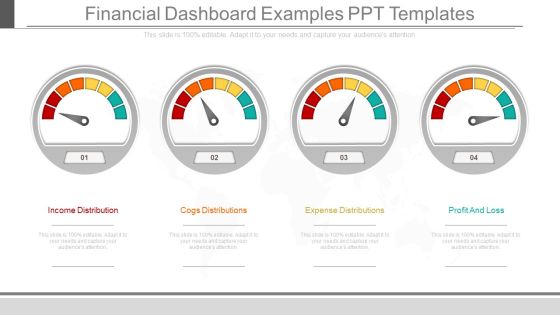
Financial Dashboard Examples Ppt Templates
This is a financial dashboard examples ppt templates. This is a four stage process. The stages in this process are income distribution, cogs distributions, expense distributions, profit and loss.
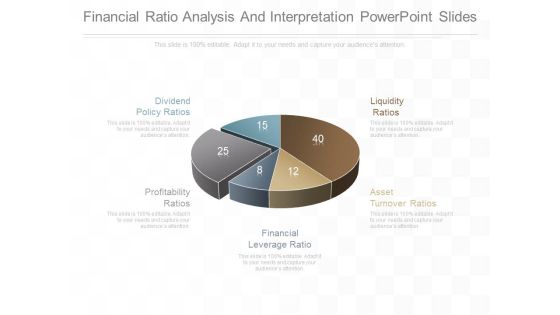
Financial Ratio Analysis And Interpretation Powerpoint Slides
This is a financial ratio analysis and interpretation powerpoint slides. This is a five stage process. The stages in this process are dividend policy ratios, profitability ratios, financial leverage ratio, asset turnover ratios, liquidity ratios.

Pricing Objectives Diagram Sample Of Ppt Presentation
This is a pricing objectives diagram sample of ppt presentation. This is a seven stage process. The stages in this process are pricing objectives, revenue maximization, profit maximization, partial cost recovery, survival, status quo, quantity leader, maximize quantity.
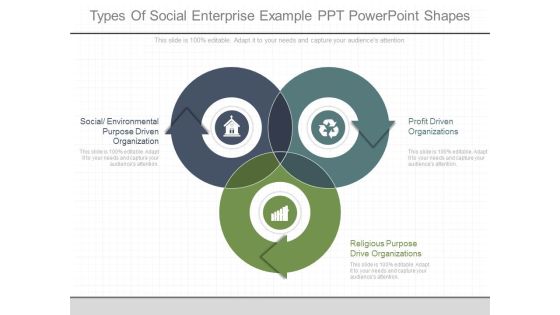
Types Of Social Enterprise Example Ppt Powerpoint Shapes
This is a types of social enterprise example ppt powerpoint shapes. This is a three stage process. The stages in this process are social environmental purpose driven organization, profit driven organizations, religious purpose drive organizations.
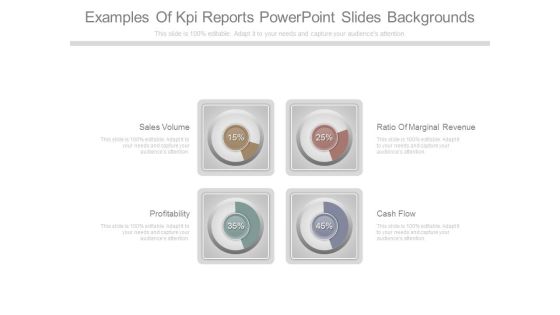
Examples Of Kpi Reports Powerpoint Slides Backgrounds
This is a examples of kpi reports powerpoint slides backgrounds. This is a four stage process. The stages in this process are sales volume, profitability, ratio of marginal revenue, cash flow.
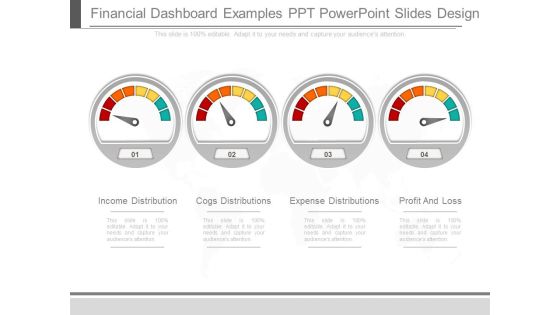
Financial Dashboard Examples Ppt Powerpoint Slides Design
This is a financial dashboard examples ppt powerpoint slides design. This is a four stage process. The stages in this process are income distribution, cogs distributions, expense distributions, profit and loss.

Factors Of Just In Time Budgeting Ppt Powerpoint Templates Download
This is a factors of just in time budgeting ppt powerpoint templates download. This is a six stage process. The stages in this process are evaluate managers, profitability index, net present value npv, discounted payback, communicate plans, control resources.
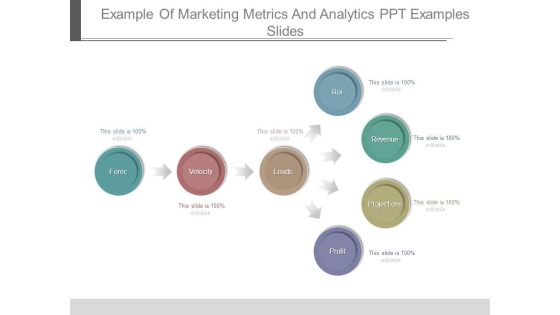
Example Of Marketing Metrics And Analytics Ppt Examples Slides
This is a example of marketing metrics and analytics ppt examples slides. This is a seven stage process. The stages in this process are forec, velocity, leads, roi, revenue, projections, profit.

Startup Advertising Template Diagram Ppt Diagrams
This is a startup advertising template diagram ppt diagrams. This is a eight stage process. The stages in this process are startup marketing, search engine optimization, investment knowledge, skills, virality in product, press, idea, profit, naming.

Payback Method Template Ppt Presentation Examples
This is a payback method template ppt presentation examples. This is a five stage process. The stages in this process are payback period, net present value, cash flows, profitability index, internal rate of return.
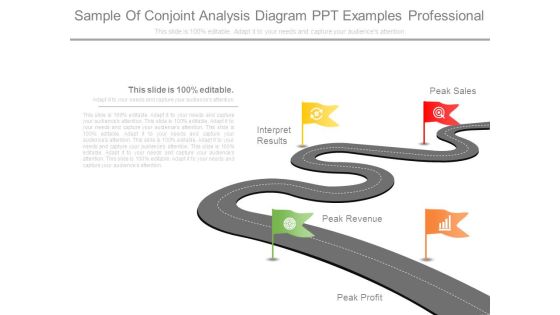
Sample Of Conjoint Analysis Diagram Ppt Examples Professional
This is a sample of conjoint analysis diagram ppt examples professional. This is a four stage process. The stages in this process are peak profit, peak revenue, interpret results, peak sales.

Tips For Effective Internal Communications Template Ppt Layout
This is a tips for effective internal communications template ppt layout. This is a five stage process. The stages in this process are informing employee, obtaining feedback, executive, strategy, profits.

Kpis And Operations Metrics Presentation Powerpoint Example
This is a kpis and operations metrics presentation powerpoint example. This is a five stage process. The stages in this process are customer class, affiliate, sales by warehouse, warehouse, profit by affiliate.
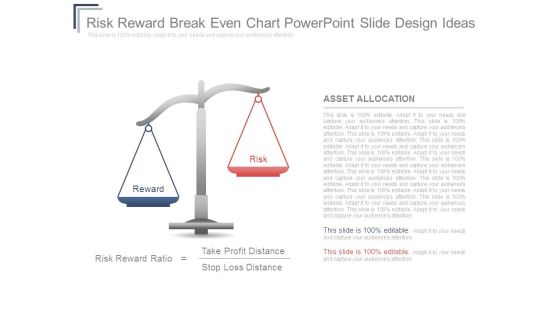
Risk Reward Breakeven Chart Powerpoint Slide Design Ideas
This is a risk reward breakeven chart powerpoint slide design ideas. This is a two stage process. The stages in this process are reward, risk, asset allocation, risk reward ratio, take profit distance, stop loss distance.

Balance Risk And Reward Example Powerpoint Slide Backgrounds
This is a balance risk and reward example powerpoint slide backgrounds. This is a two stage process. The stages in this process are reward, risk, risk reward ratio, take profit distance, stop loss distance.
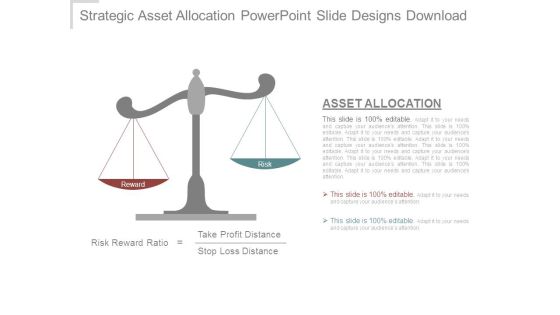
Strategic Asset Allocation Powerpoint Slide Designs Download
This is a strategic asset allocation powerpoint slide designs download. This is a two stage process. The stages in this process are reward, risk, risk reward ratio, take profit distance, stop loss distance, asset allocation.

Criteria Based Competition Comparison Table Powerpoint Slides
This is a criteria based competition comparison table powerpoint slides. This is a seven stage process. The stages in this process are revenue, profit, market share, main activity, number of employee, product quality.
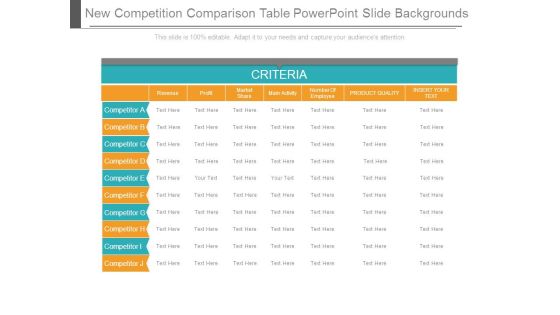
New Competition Comparison Table Powerpoint Slide Backgrounds
This is a new competition comparison table powerpoint slide backgrounds. This is a seven stage process. The stages in this process are revenue, profit, market share, main activity, number of employee, product quality, insert your text.

Financial Analysis And Management Powerpoint Slides
This is a financial analysis and management powerpoint slides. This is a eight stage process. The stages in this process are cash flow, monitoring, actionable reports, investment decision, analysis, financial, analysis and management, planning, key drivers, drive profitability.

Competition Comparison Table With New Criteria Powerpoint Ideas
This is a competition comparison table with new criteria powerpoint ideas. This is a seven stage process. The stages in this process are revenu, profit, market share, main activity, number of employee, product quality, insert your text.
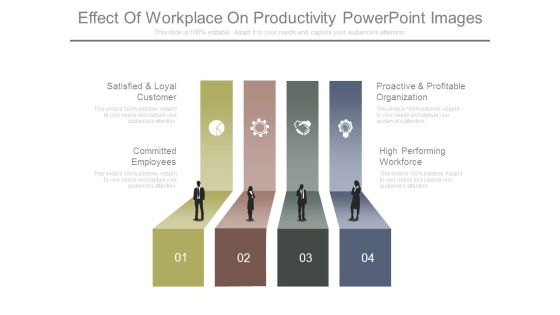
Effect Of Workplace On Productivity Powerpoint Images
This is a effect of workplace on productivity powerpoint images. This is a four stage process. The stages in this process are satisfied and loyal customer, committed employees, proactive and profitable organization, high performing workforce.

Competition Comparison Criteria Review Table Powerpoint Slide Templates Download
This is a competition comparison criteria review table powerpoint slide templates download. This is a six stage process. The stages in this process are criteria, competitor revenue, profit, market share, main activity, number of employee, product quality, insert your text.

Competitor Analysis Tools Ppt PowerPoint Presentation Example File
This is a competitor analysis tools ppt powerpoint presentation example file. This is a five stage process. The stages in this process are criteria, revenue, profit, market share, main activity, number of employee, product quality.
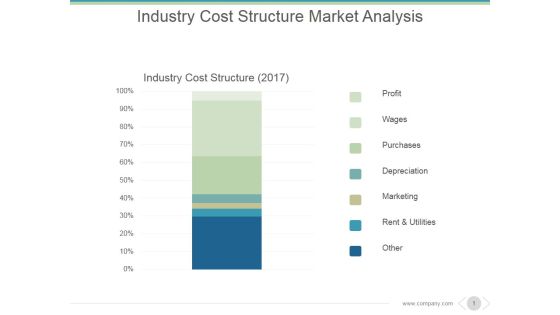
Industry Cost Structure Market Analysis Ppt PowerPoint Presentation Deck
This is a industry cost structure market analysis ppt powerpoint presentation deck. This is a seven stage process. The stages in this process are profit, wages, purchases, depreciation, marketing, rent and utilities.

Competition Comparison Table Ppt PowerPoint Presentation Outline
This is a competition comparison table ppt powerpoint presentation outline. This is a seven stage process. The stages in this process are revenue, profit, market share, main activity, number of employee, product quality.

Competitor Analysis Template Ppt PowerPoint Presentation Guidelines
This is a competitor analysis template ppt powerpoint presentation guidelines. This is a five stage process. The stages in this process are revenue, profit, market share, competitor, number of employee.

Asset Allocation Ppt PowerPoint Presentation Show
This is a asset allocation ppt powerpoint presentation show. This is a two stage process. The stages in this process are reward, risk, take profit distance, stop loss distance.

Competition Comparison Table Ppt PowerPoint Presentation Backgrounds
This is a competition comparison table ppt powerpoint presentation backgrounds. This is a seven stage process. The stages in this process are revenue, profit, market share , main activity, number of employee, product quality , insert your text.

Asset Allocation Ppt PowerPoint Presentation Design Templates
This is a asset allocation ppt powerpoint presentation design templates. This is a two stage process. The stages in this process are risk reward ratio, take profit distance, stop loss distance.
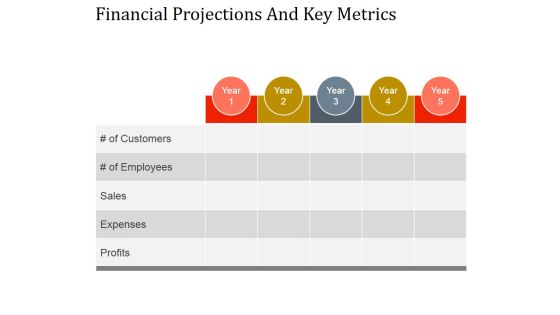
Financial Projections And Key Metrics Ppt PowerPoint Presentation Designs
This is a financial projections and key metrics ppt powerpoint presentation designs. This is a five stage process. The stages in this process are profits, expenses, sales, of employees, of customers.
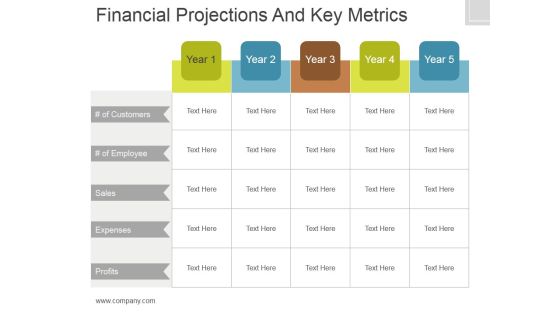
Financial Projections And Key Metrics Ppt PowerPoint Presentation Show
This is a financial projections and key metrics ppt powerpoint presentation show. This is a five stage process. The stages in this process are of customers, sales, expenses, profits.
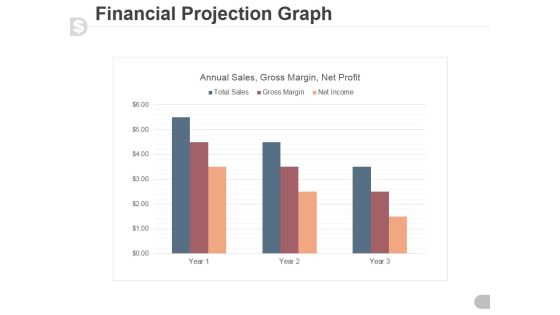
Financial Projection Graph Template 1 Ppt PowerPoint Presentation Guide
This is a financial projection graph template 1 ppt powerpoint presentation guide. This is a three stage process. The stages in this process are annual sales, gross margin, net profit.

Competitor Analysis Template Ppt PowerPoint Presentation Ideas
This is a competitor analysis template ppt powerpoint presentation ideas. This is a five stage process. The stages in this process are revenue, profit, market share, number of employee, product quality, main activity, revenue.

Asset Allocation Ppt PowerPoint Presentation Sample
This is a asset allocation ppt powerpoint presentation sample. This is a two stage process. The stages in this process are risk, reward, risk reward ratio, take profit distance.

Competitor Analysis Comparison Table Ppt PowerPoint Presentation Infographic Template Graphics
This is a competitor analysis comparison table ppt powerpoint presentation infographic template graphics. This is a seven stage process. The stages in this process are profit, revenue, market share, main activity, criteria.

Competitor Analysis Comparison Table Ppt PowerPoint Presentation Icon Designs Download
This is a competitor analysis comparison table ppt powerpoint presentation icon designs download. This is a seven stage process. The stages in this process are revenue, profit, market share, main activity, number of employee, product quality.

Competitor Analysis Comparison Table Ppt PowerPoint Presentation Infographics Design Inspiration
This is a competitor analysis comparison table ppt powerpoint presentation infographics design inspiration. This is a seven stage process. The stages in this process are revenue, profit, market share, main activity.

Key Financial Ratio Template 3 Ppt PowerPoint Presentation Slides Inspiration
This is a key financial ratio template 3 ppt powerpoint presentation slides inspiration. This is a four stage process. The stages in this process are liquidity, profitability, activity, solvency.

Financials Base Plan Ppt Powerpoint Presentation Slides Design Inspiration
This is a financials base plan ppt powerpoint presentation slides design inspiration. This is a four stage process. The stages in this process are financial summary, revenue, cost of sales, gross profit.
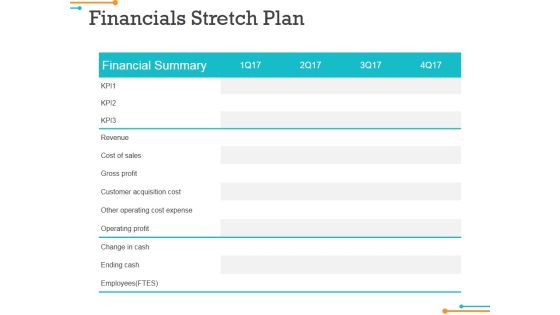
Financials Stretch Plan Ppt Powerpoint Presentation Infographics Background Image
This is a financials stretch plan ppt powerpoint presentation infographics background image. This is a four stage process. The stages in this process are financial summary, revenue, cost of sales, gross profit.

Calculating Customer Lifetime Value Clv Ppt PowerPoint Presentation Show Icon
This is a calculating customer lifetime value clv ppt powerpoint presentation show icon. This is a five stage process. The stages in this process are average acquisition cost, average customer revenue, average customer costs, average customer profit, customer retention rate.

Financials Base Plan Ppt PowerPoint Presentation Portfolio Background Designs
This is a financials base plan ppt powerpoint presentation portfolio background designs. This is a four stage process. The stages in this process are revenue, cost of sales, gross profit, customer acquisition cost, other operating cost expense.
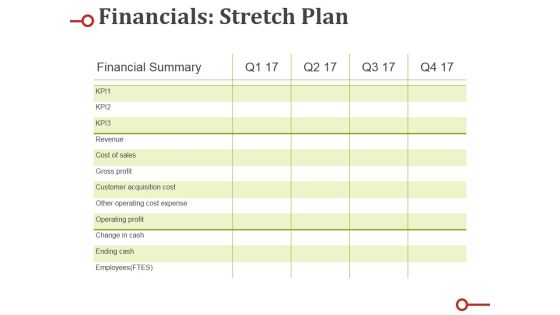
Financials Stretch Plan Ppt PowerPoint Presentation Show Designs Download
This is a financials stretch plan ppt powerpoint presentation show designs download. This is a four stage process. The stages in this process are revenue, cost of sales, gross profit, customer acquisition cost, other operating cost expense.

Financials Summary Base Plan Vs Stretch Plan Ppt PowerPoint Presentation Microsoft
This is a financials summary base plan vs stretch plan ppt powerpoint presentation microsoft. This is a three stage process. The stages in this process are revenue, cost of sales, gross profit, customer acquisition cost, other operating cost expense.

Competition Comparison Table Ppt PowerPoint Presentation Pictures File Formats
This is a competition comparison table ppt powerpoint presentation pictures file formats. This is a seven stage process. The stages in this process are revenue, profit, market share, main activity, number of employee, product quality.
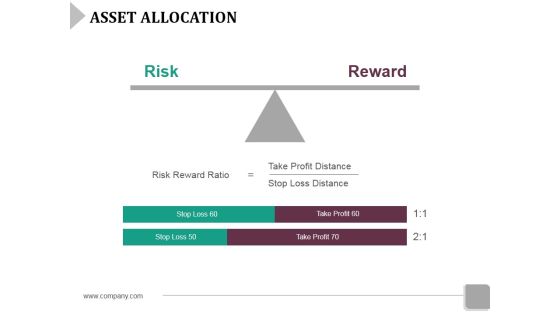
Asset Allocation Ppt PowerPoint Presentation Slides Structure
This is a asset allocation ppt powerpoint presentation slides structure. This is a two stage process. The stages in this process are risk, reward, stop loss, take profit, risk reward ratio.
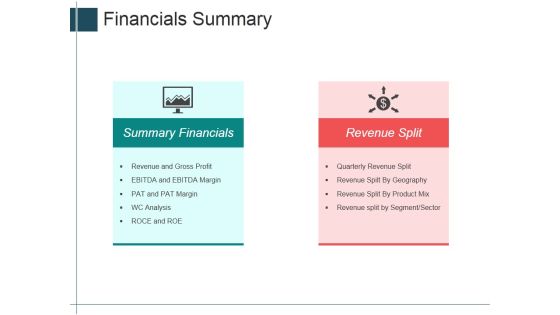
Financials Summary Ppt Powerpoint Presentation Inspiration Slides
This is a financials summary ppt powerpoint presentation inspiration slides. This is a two stage process. The stages in this process are summary financials, revenue split, icons, revenue and gross profit.
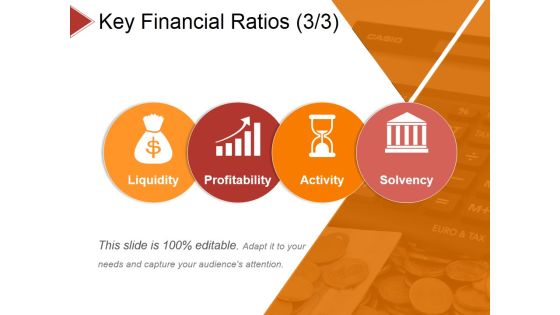
Key Financial Ratios Template 3 Ppt PowerPoint Presentation Summary Sample
This is a key financial ratios template 3 ppt powerpoint presentation summary sample. This is a four stage process. The stages in this process are liquidity, profitability, activity, solvency.

New Product Detailed Overview Ppt PowerPoint Presentation Summary Brochure
This is a new product detailed overview ppt powerpoint presentation summary brochure. This is a six stage process. The stages in this process are strategic, product advantage, market attractiveness, synergies, technical feasibility, profitability analysis.

Key Financial Ratios Template 3 Ppt PowerPoint Presentation Model Deck
This is a key financial ratios template 3 ppt powerpoint presentation model deck. This is a four stage process. The stages in this process are liquidity, profitability, activity, solvency.

 Home
Home