Growth Arrows

Signs Your Business Needs Brand Consulting Services Rules PDF
The following slide outlines the major reasons why the business requires brand consulting services. The key reasons are stagnant sales and profit, catering new target audience, introducing a new product line, poor website performance, churn rate is higher, etc. Do you have an important presentation coming up Are you looking for something that will make your presentation stand out from the rest Look no further than Signs Your Business Needs Brand Consulting Services Rules PDF. With our professional designs, you can trust that your presentation will pop and make delivering it a smooth process. And with Slidegeeks, you can trust that your presentation will be unique and memorable. So why wait Grab Signs Your Business Needs Brand Consulting Services Rules PDF today and make your presentation stand out from the rest.
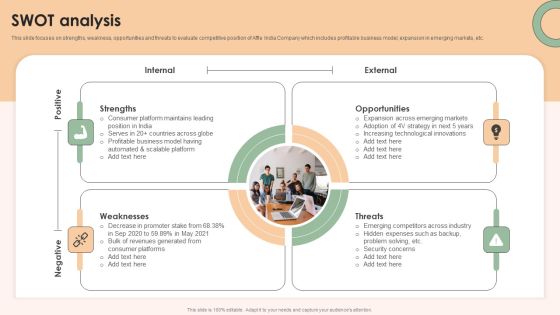
Online Advertising Firm Business Profile SWOT Analysis Diagrams PDF
This slide focuses on strengths, weakness, opportunities and threats to evaluate competitive position of Affle India Company which includes profitable business model, expansion in emerging markets, etc. Retrieve professionally designed Online Advertising Firm Business Profile SWOT Analysis Diagrams PDF to effectively convey your message and captivate your listeners. Save time by selecting pre made slideshows that are appropriate for various topics, from business to educational purposes. These themes come in many different styles, from creative to corporate, and all of them are easily adjustable and can be edited quickly. Access them as PowerPoint templates or as Google Slides themes. You do not have to go on a hunt for the perfect presentation because Slidegeeks got you covered from everywhere.

E Commerce Business Apparel Ecommerce Companies Competitor Analysis Diagrams PDF
This slide showcases competitor analysis of online clothing firms. The comparison is done on the basis of products, revenue, profit and conversion rate. Coming up with a presentation necessitates that the majority of the effort goes into the content and the message you intend to convey. The visuals of a PowerPoint presentation can only be effective if it supplements and supports the story that is being told. Keeping this in mind our experts created E Commerce Business Apparel Ecommerce Companies Competitor Analysis Diagrams PDF to reduce the time that goes into designing the presentation. This way, you can concentrate on the message while our designers take care of providing you with the right template for the situation.

Digital Application Software Development Business Profile Company Overview Demonstration PDF
The slide describes the company information including name, incorporation year, headquarters country, industry, chief executive officer, website, company type, ticker symbol, revenue, profit and market value. It also showcases awards and recognition for company. Get a simple yet stunning designed Digital Application Software Development Business Profile Company Overview Demonstration PDF. It is the best one to establish the tone in your meetings. It is an excellent way to make your presentations highly effective. So, download this PPT today from Slidegeeks and see the positive impacts. Our easy-to-edit Digital Application Software Development Business Profile Company Overview Demonstration PDF can be your go-to option for all upcoming conferences and meetings. So, what are you waiting for Grab this template today.

Consulting Firm Business Profile Executive Summary Inspiration PDF
The slide showcases the executive summary of the organization that includes about company, top acquisitions, and financial summary revenue, gross profit, net income, and EBITDA Do you have an important presentation coming up Are you looking for something that will make your presentation stand out from the rest Look no further than Consulting Firm Business Profile Executive Summary Inspiration PDF. With our professional designs, you can trust that your presentation will pop and make delivering it a smooth process. And with Slidegeeks, you can trust that your presentation will be unique and memorable. So why wait Grab Consulting Firm Business Profile Executive Summary Inspiration PDF today and make your presentation stand out from the rest.

Competition Key Performance Indicators Of ADC Cosmetics Company With Future Targets Inspiration PDF
The slide shows the key Performance Indicator KPIs which will help the company to track the success rate of implemented strategies. Some of the KPIs are Company Revenue , Profit Margin, Market Share, Stock Turnover Rate , Cross Selling Rate, Net Promotor Score etc.Deliver an awe-inspiring pitch with this creative competition key performance indicators of adc cosmetics company with future targets inspiration pdf bundle. Topics like key performance indicators, stock turnover rate, customer churn rate can be discussed with this completely editable template. It is available for immediate download depending on the needs and requirements of the user.

Key Performance Indicators Of Geo Energy Company With Future Targets Ideas PDF
The slide shows the key Performance Indicator KPIs which will help the company to track the success rate of implemented strategies. Some of the KPIs are Revenue , Return on Investment, Performance Ratio , Wind Energy Levels , Plant Availability, Profitability etc.Deliver an awe inspiring pitch with this creative key performance indicators of geo energy company with future targets ideas pdf bundle. Topics like return on investment, performance ratio, key performance indicators can be discussed with this completely editable template. It is available for immediate download depending on the needs and requirements of the user.
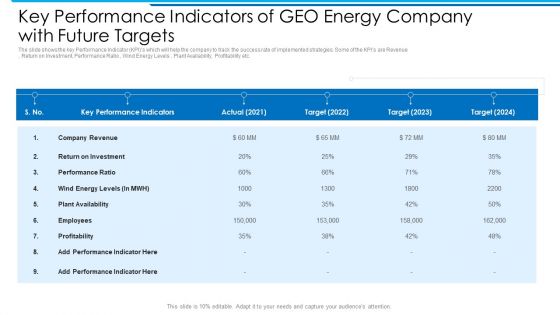
Key Performance Indicators Of GEO Energy Company With Future Targets Topics PDF
The slide shows the key Performance Indicator KPIs which will help the company to track the success rate of implemented strategies. Some of the KPIs are Revenue , Return on Investment, Performance Ratio , Wind Energy Levels , Plant Availability, Profitability etc.Deliver and pitch your topic in the best possible manner with this key performance indicators of geo energy company with future targets topics pdf. Use them to share invaluable insights on return on investment, plant availability, key performance indicators and impress your audience. This template can be altered and modified as per your expectations. So, grab it now.
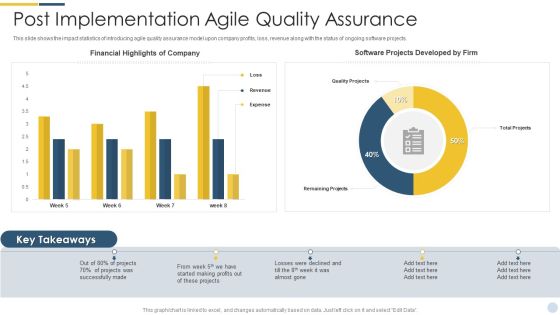
Quality Assurance Procedure In Agile Project Post Implementation Agile Quality Assurance Portrait PDF
This slide shows the impact statistics of introducing agile quality assurance model upon company profits, loss, revenue along with the status of ongoing software projects. Deliver an awe inspiring pitch with this creative quality assurance procedure in agile project post implementation agile quality assurance portrait pdf bundle. Topics like financial highlights of company, software projects developed by firm, projects was successfully made can be discussed with this completely editable template. It is available for immediate download depending on the needs and requirements of the user.
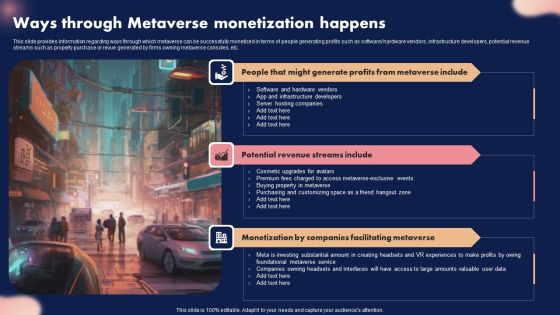
Ways Through Metaverse Monetization Happens Ppt Infographic Template Good PDF
This slide provides information regarding ways through which metaverse can be successfully monetized in terms of people generating profits such as software or hardware vendors, infrastructure developers, potential revenue streams such as property purchase or revue generated by firms owning metaverse consoles, etc. If your project calls for a presentation, then Slidegeeks is your go to partner because we have professionally designed, easy to edit templates that are perfect for any presentation. After downloading, you can easily edit Ways Through Metaverse Monetization Happens Ppt Infographic Template Good PDF and make the changes accordingly. You can rearrange slides or fill them with different images. Check out all the handy templates.

Best Practices To Achieve Integrated Marketing Framework Portrait PDF
This template shows the best practices for making a successful marketing plan. The purpose of this slide is to achieve the potential marketing target to generate a higher profit in the future. It includes tactics such as social media, direct mail, blogging, and emails.Pitch your topic with ease and precision using this Best Practices To Achieve Integrated Marketing Framework Portrait PDF. This layout presents information on Social media, Direct mail. It is also available for immediate download and adjustment. So, changes can be made in the color, design, graphics or any other component to create a unique layout.

Warehouse Fleet And Transportation Performance Analytics Dashboard Pictures PDF
This slide represents a warehouse fleet and transportation management dashboard to visualize and optimize logistics operations through advanced data analyses. It monitors KPIs such as fleet status, delivery status, deliveries by location, average delivery time hours0 and route Km, loading time and weight, and profit by location. Do you have to make sure that everyone on your team knows about any specific topic I yes, then you should give Warehouse Fleet And Transportation Performance Analytics Dashboard Pictures PDF a try. Our experts have put a lot of knowledge and effort into creating this impeccable Warehouse Fleet And Transportation Performance Analytics Dashboard Pictures PDF. You can use this template for your upcoming presentations, as the slides are perfect to represent even the tiniest detail. You can download these templates from the Slidegeeks website and these are easy to edit. So grab these today

Bubble Chart Ppt PowerPoint Presentation Layouts Design Ideas
This is a bubble chart ppt powerpoint presentation layouts design ideas. This is a eight stage process. The stages in this process are in percentage, profit, bubble chart, business, marketing.

Financial Projections Pandl Ppt PowerPoint Presentation File Example File
This is a financial projections pandl ppt powerpoint presentation file example file. This is a four stage process. The stages in this process are net sales, expenses, ebitda, profit after tax, business.
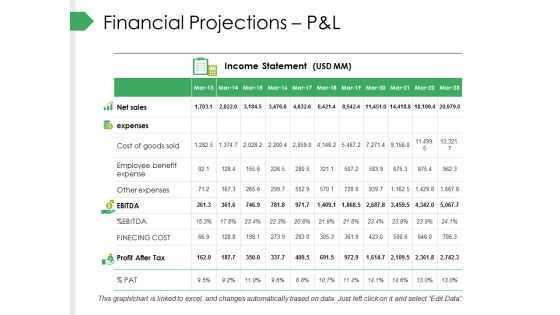
Financial Projections Pandl Ppt PowerPoint Presentation Visual Aids Professional
This is a financial projections pandl ppt powerpoint presentation visual aids professional. This is a four stage process. The stages in this process are net sales, expenses, ebitda, profit after tax, business.

Marketing And Branding Graphic Ppt Images
This is a marketing and branding graphic ppt images. This is a four stage process. The stages in this process are database marketing, business intelligence, profitable customer engagement, digital and social media marketing, brand management, implementation, integration, interaction, innovation.

Social Enterprise Management Skills Template Sample Presentation Ppt
This is a social enterprise management skills template sample presentation ppt. This is a eight stage process. The stages in this process are employees, business operations, customer relations, people, governance, marketing, profit, leadership.
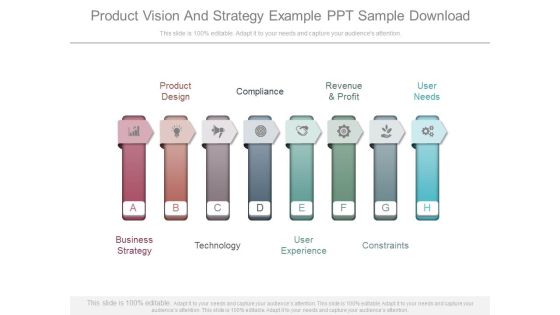
Product Vision And Strategy Example Ppt Sample Download
This is a product vision and strategy example ppt sample download. This is a eight stage process. The stages in this process are product design, compliance, revenue and profit, user needs, constraints, user experience, technology, business strategy.

Advertising Online Example Ppt Presentation
This is a advertising online example ppt presentation. This is a six stage process. The stages in this process are business strategy, constraints, revenue and profit, product design, user experience, technology.

Stacked Line Chart Ppt PowerPoint Presentation Pictures Elements
This is a stacked line chart ppt powerpoint presentation pictures elements. This is a two stage process. The stages in this process are product, profit, stacked line chart, year, business.

Clustered Bar Ppt PowerPoint Presentation Summary Design Inspiration
This is a clustered bar ppt powerpoint presentation summary design inspiration. This is a two stage process. The stages in this process are product, clustered bar, profit, business, marketing.

Stacked Line With Marker Ppt PowerPoint Presentation Ideas Themes
This is a stacked line with marker ppt powerpoint presentation ideas themes. This is a two stage process. The stages in this process are profit, stacked bar, product, business, marketing.

Cost Per Employee Ppt PowerPoint Presentation Model Graphics Download
This is a cost per employee ppt powerpoint presentation model graphics download. This is a six stage process. The stages in this process are average profit per employee, line chart, business, marketing, management.

Approaches To Modify Humanitarian Aid And Achieve Entity Goals Nonprofit Organization Structure PDF
The slide shows the strategic planning models of Red Cross non profit organization that must be implemented to achieve the main objective of enhanced humanitarian assistance. Deliver and pitch your topic in the best possible manner with this approaches to modify humanitarian aid and achieve entity goals nonprofit organization structure pdf Use them to share invaluable insights on promote humanitarian, encourage respect, diversity and human and impress your audience. This template can be altered and modified as per your expectations. So, grab it now.
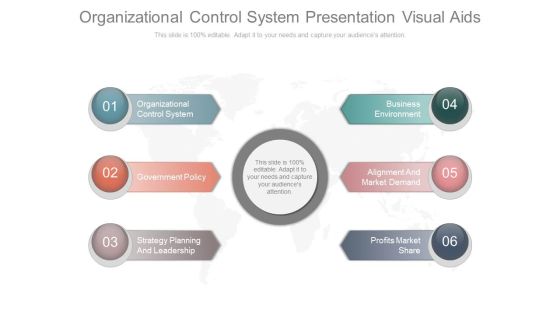
Organizational Control System Presentation Visual Aids
This is a organizational control system presentation visual aids. This is a six stage process. The stages in this process are organizational control system, government policy, strategy planning and leadership, business environment, alignment and market demand, profits market share.

Benefits Of Strategic Kips Ppt Powerpoint Show
This is a benefits of strategic kips ppt powerpoint show. This is a two stage process. The stages in this process are sales, plan, ideas, business, team, profit, venture.

Market Segmentation Evaluation Template 1 Ppt PowerPoint Presentation Templates
This is a market segmentation evaluation template 1 ppt powerpoint presentation templates. This is a two stage process. The stages in this process are market sale, net profit, evaluation, business, marketing.
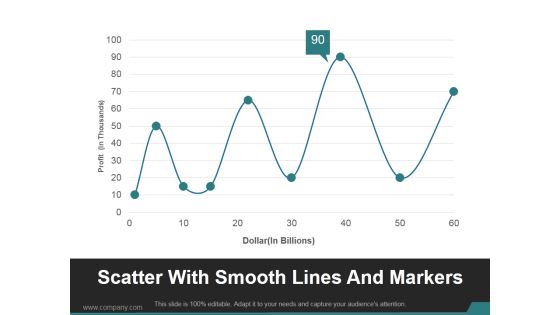
Scatter With Smooth Lines And Markers Ppt PowerPoint Presentation Show
This is a scatter with smooth lines and markers ppt powerpoint presentation show. This is a nine stage process. The stages in this process are business, marketing, line chart, profit, management.

Competitor Analysis Template Ppt PowerPoint Presentation Pictures Graphics Template
This is a competitor analysis template ppt powerpoint presentation pictures graphics template. This is a four stage process. The stages in this process are business, strategy, marketing, planning, net profit margin.
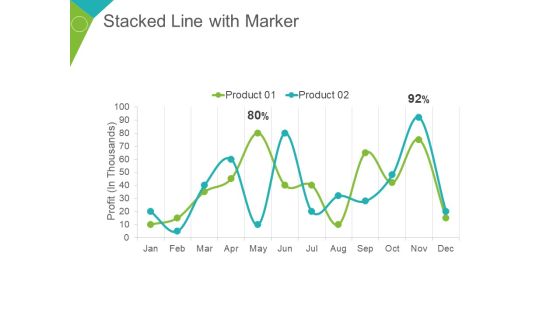
Stacked Line With Marker Ppt PowerPoint Presentation Summary Demonstration
This is a stacked line with marker ppt powerpoint presentation summary demonstration. This is a two stage process. The stages in this process are profit in thousands, product, percentage, finance, business.

Scatter With Smooth Lines And Markers Ppt PowerPoint Presentation Visual Aids Ideas
This is a scatter with smooth lines and markers ppt powerpoint presentation visual aids ideas. This is a nine stage process. The stages in this process are product, profit, dollar, business, finance.

Clustered Column Ppt PowerPoint Presentation Professional Graphic Tips
This is a clustered column ppt powerpoint presentation professional graphic tips. This is a two stage process. The stages in this process are product, profit in percentage, graph, business, marketing.
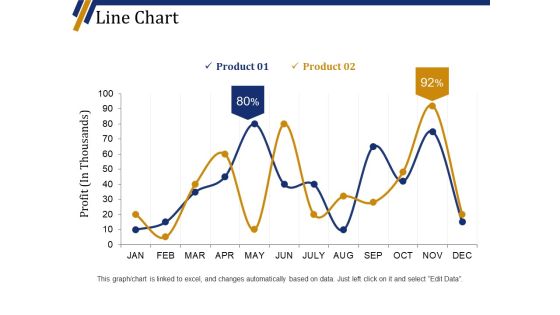
Line Chart Ppt PowerPoint Presentation Portfolio Background Designs
This is a line chart ppt powerpoint presentation portfolio background designs. This is a two stage process. The stages in this process are product, business, finance, marketing, profit in thousands.

Scatter Chart Ppt PowerPoint Presentation Summary Visuals
This is a scatter chart ppt powerpoint presentation summary visuals. This is a eight stage process. The stages in this process are product, profit in sales, in percentage, finance, business.

Clustered Column Ppt PowerPoint Presentation Inspiration Shapes
This is a clustered column ppt powerpoint presentation inspiration shapes. This is a two stage process. The stages in this process are profit in percentage, business, marketing, graph, finance.
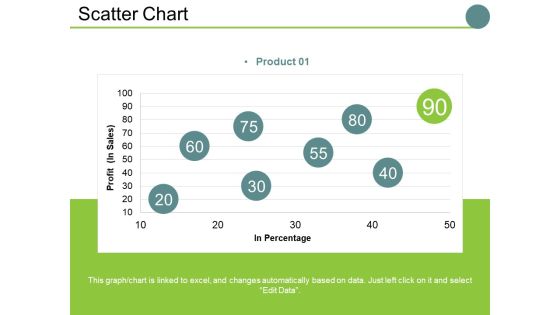
Scatter Chart Ppt PowerPoint Presentation Slides Examples
This is a scatter chart ppt powerpoint presentation slides examples. This is a one stage process. The stages in this process are profit , in percentage, business, marketing, finance, graph.
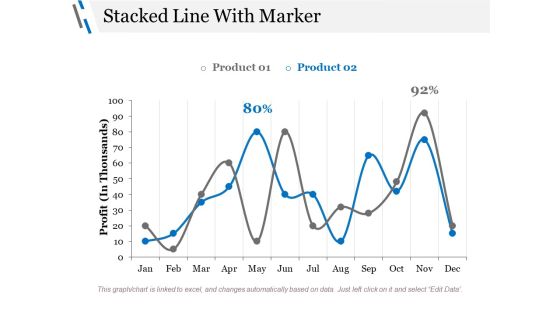
Stacked Line With Marker Ppt PowerPoint Presentation Styles Graphics Design
This is a stacked line with marker ppt powerpoint presentation styles graphics design. This is a three stage process. The stages in this process are profit, business, marketing, finance, percentage.
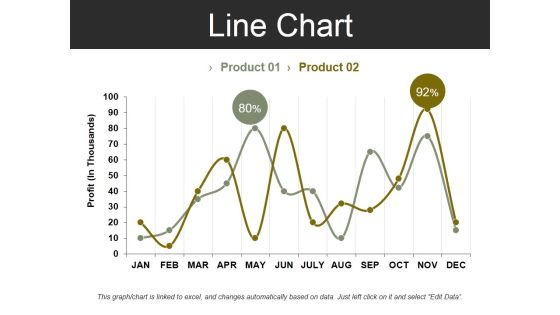
Line Chart Template 2 Ppt PowerPoint Presentation Summary Design Inspiration
This is a line chart template 2 ppt powerpoint presentation summary design inspiration. This is a two stage process. The stages in this process are profit, business, marketing, finance, chart.

Customer Retention Benefits Ppt PowerPoint Presentation File Guide
This is a customer retention benefits ppt powerpoint presentation file guide. This is a three stage process. The stages in this process are profits by, costs, business, management, process.
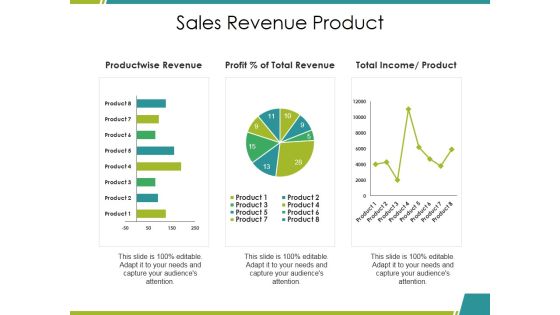
Sales Revenue Product Ppt PowerPoint Presentation Slides Visuals
This is a sales revenue product ppt powerpoint presentation slides visuals. This is a three stage process. The stages in this process are product wise revenue, total income, profit, product, business.
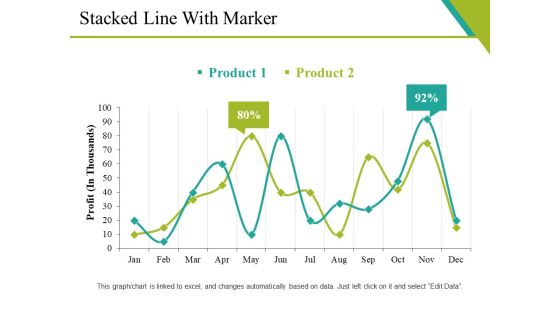
Stacked Line With Marker Ppt PowerPoint Presentation Gallery Diagrams
This is a stacked line with marker ppt powerpoint presentation gallery diagrams. This is a two stage process. The stages in this process are graph, business, marketing, strategy, profit.

Competitor Analysis Template 4 Ppt PowerPoint Presentation Gallery Design Templates
This is a competitor analysis template 4 ppt powerpoint presentation gallery design templates. This is a four stage process. The stages in this process are business, marketing, analysis, graph, net profit margin.

Clustered Column Ppt PowerPoint Presentation Visual Aids Show
This is a clustered column ppt powerpoint presentation visual aids show. This is a two stage process. The stages in this process are product, profit, business, bar graph, finance.
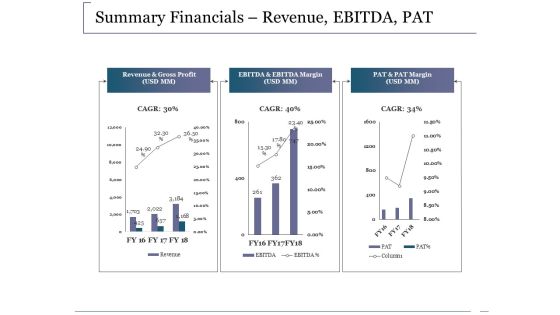
Summary Financials Revenue Ebitda Pat Ppt PowerPoint Presentation Outline Infographics
This is a summary financials revenue ebitda pat ppt powerpoint presentation outline infographics. This is a three stage process. The stages in this process are revenue and gross profit, ebitda and ebitda margin, pat and pat margin, business, marketing.

Scatter Bubble Chart Ppt PowerPoint Presentation Gallery Show
This is a scatter bubble chart ppt powerpoint presentation gallery show. This is a two stage process. The stages in this process are profit, in percentage, finance, marketing, business.

Line Chart Ppt PowerPoint Presentation Professional Portfolio
This is a line chart ppt powerpoint presentation professional portfolio. This is a two stage process. The stages in this process are business, marketing, profit, percentage, graph, strategy, finance.

Bubble Chart Ppt PowerPoint Presentation Outline Deck
This is a bubble chart ppt powerpoint presentation outline deck. This is a two stage process. The stages in this process are in percentage, profit, bubble chart, business, marketing.

Line Chart Ppt PowerPoint Presentation File Designs Download
This is a line chart ppt powerpoint presentation file designs download. This is a two stage process. The stages in this process are business, marketing, profit, line chart, percentage.

Comparison Based On Criteria Ppt PowerPoint Presentation Gallery Information
This is a comparison based on criteria ppt powerpoint presentation gallery information. This is a six stage process. The stages in this process are criteria, revenue, profit, business, competitor.

Balance Sheet Kpis Ppt PowerPoint Presentation Summary Designs Download
This is a balance sheet kpis ppt powerpoint presentation summary designs download. This is a four stage process. The stages in this process are current assets, current liabilities, total liabilities, operating profit, business.

Cash Flow Statement Kpis Ppt PowerPoint Presentation Styles Themes
This is a cash flow statement kpis ppt powerpoint presentation styles themes. This is a four stage process. The stages in this process are business, operations, operating profit, total liabilities, current liabilities.
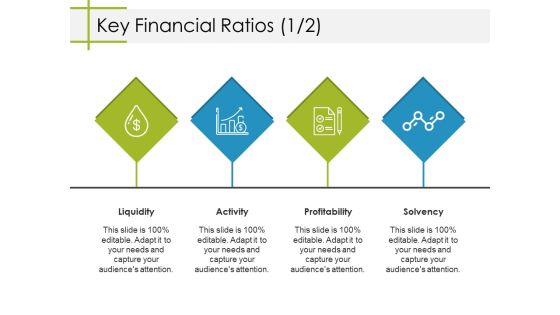
Key Financial Ratios Template 2 Ppt PowerPoint Presentation Summary Samples
This is a key financial ratios template 2 ppt powerpoint presentation summary samples. This is a four stage process. The stages in this process are liquidity, activity, profitability, solvency, business.
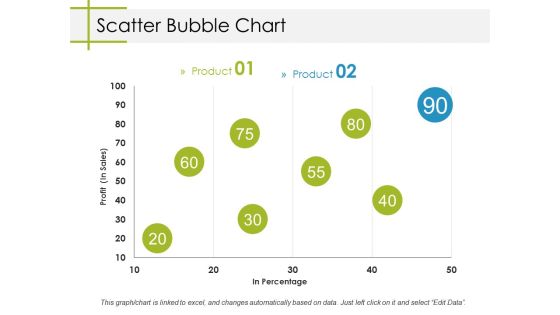
Scatter Bubble Chart Ppt PowerPoint Presentation Model Designs
This is a scatter bubble chart ppt powerpoint presentation model designs. This is a two stage process. The stages in this process are business, profit, in percentage, bubble chart, marketing.
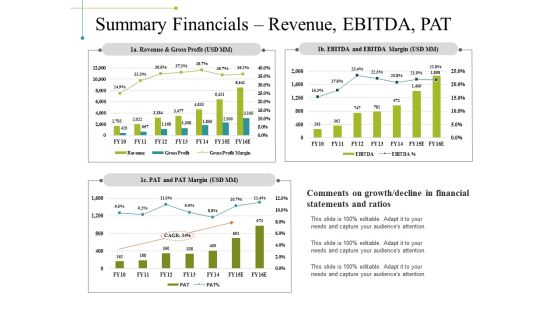
Summary Financials Revenue Ebitda Pat Ppt PowerPoint Presentation Inspiration Templates
This is a summary financials revenue ebitda pat ppt powerpoint presentation inspiration templates. This is a three stage process. The stages in this process are revenue and gross profit, pat and pat margin, ebitda and ebitda margin, business, marketing.
Stacked Line Chart Ppt PowerPoint Presentation Show Icon
This is a stacked line chart ppt powerpoint presentation show icon. This is a two stage process. The stages in this process are profit, chart, years, business, marketing, years.
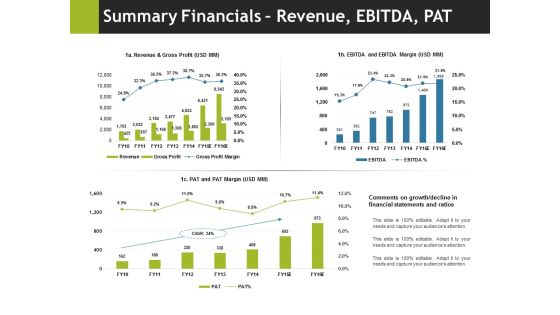
Summary Financials Revenue Ebitda Pat Ppt PowerPoint Presentation Pictures Outline
This is a summary financials revenue ebitda pat ppt powerpoint presentation pictures outline. This is a three stage process. The stages in this process are business, marketing, pat and pat margin, ebitda and ebitda margin, revenue and gross profit.

Bubble Chart Ppt PowerPoint Presentation Layouts Clipart Images
This is a bubble chart ppt powerpoint presentation layouts clipart images. This is a two stage process. The stages in this process are business, marketing, profit, innovation, technology, idea bulb.

Clustered Bar Ppt PowerPoint Presentation Icon Professional
This is a clustered bar ppt powerpoint presentation icon professional. This is a two stage process. The stages in this process are business, marketing, profit, clustered bar, finance, strategy.
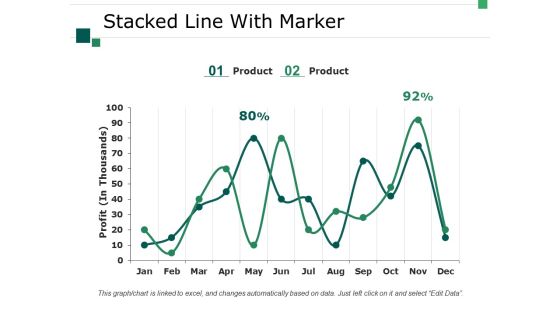
Stacked Line With Marker Ppt PowerPoint Presentation Professional Designs Download
This is a stacked line with marker ppt powerpoint presentation professional designs download. This is a two stage process. The stages in this process are business, marketing, strategy, graph, profit.
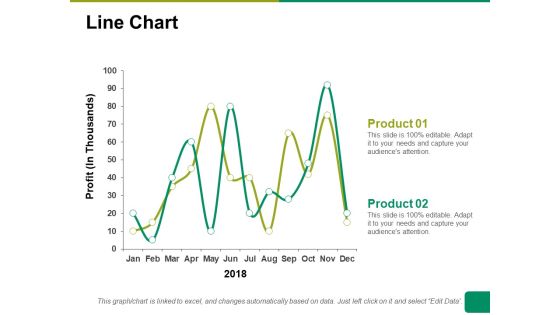
Line Chart Ppt PowerPoint Presentation Summary Ideas
This is a line chart ppt powerpoint presentation summary ideas. This is a two stage process. The stages in this process are line chart, profit, product, financial years, business.

 Home
Home