Goal Chart
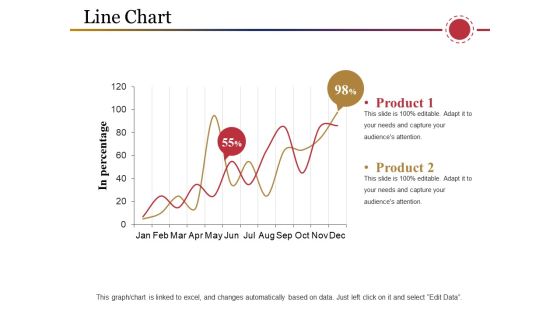
Line Chart Ppt PowerPoint Presentation Inspiration Samples
This is a line chart ppt powerpoint presentation inspiration samples. This is a two stage process. The stages in this process are product, in percentage, business, marketing, graph.

PowerPoint Designs Process Chart Strategy Ppt Slide
PowerPoint Designs process Chart Strategy PPT Slide-This Process Chart can be used as data flow diagram to show the flow of the data as it moves from beginning process to end result.-3d, arrow, art, business, chart, circle, concept, connection, cycle, development, diagram, direction, element, environment, finance, financial, flow, graphic, group, investment, isolated, market,, movement, organization, passive income, perspective, presentation, process chart, recycle, report, sign, step, success, symbol, teamwork-PowerPoint Designs process Chart Strategy PPT Slide

Inbound Marketing Department Organizational Chart Information PDF
This slide covers organisation structure chart of inbound marketing team. It includes roles of key stakeholders such as marketing board, brand and buzz team, TOFU , MOFU, marketeering with key responsibilities such as to increase brand awareness, product awareness, generate and nurture leads, make products, etc. Presenting Inbound Marketing Department Organizational Chart Information PDF to dispense important information. This template comprises three stages. It also presents valuable insights into the topics including Brand Awareness, Increases Awareness, Affiliate Marketing. This is a completely customizable PowerPoint theme that can be put to use immediately. So, download it and address the topic impactfully.

Agile Org Chart It Financial Mockup PDF
Deliver an awe inspiring pitch with this creative agile org chart it financial mockup pdf bundle. Topics like minimum, medium, maximum can be discussed with this completely editable template. It is available for immediate download depending on the needs and requirements of the user.
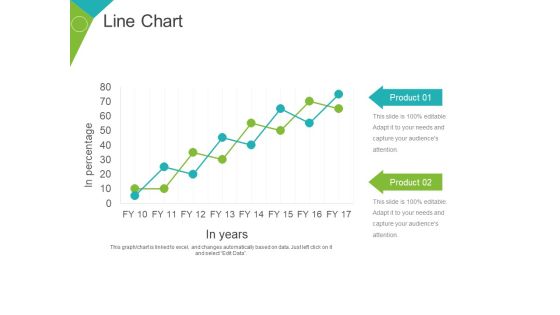
Line Chart Ppt PowerPoint Presentation Gallery Objects
This is a line chart ppt powerpoint presentation gallery objects. This is a two stage process. The stages in this process are product, business, marketing, growth, in years, in percentage.

Area Chart Ppt PowerPoint Presentation Summary Objects
This is a area chart ppt powerpoint presentation summary objects. This is a two stage process. The stages in this process are product, sales in percentage, finance, business, marketing.

Combo Chart Ppt PowerPoint Presentation Styles Objects
This is a combo chart ppt powerpoint presentation styles objects. This is a three stage process. The stages in this process are market size growth rate, growth, business, marketing, graph.

Scatter Chart Ppt PowerPoint Presentation Ideas Templates
This is a scatter chart ppt powerpoint presentation ideas templates. This is a nine stage process. The stages in this process are y values, x values, product, graph, business.

Scatter Chart Ppt PowerPoint Presentation Summary Smartart
This is a scatter chart ppt powerpoint presentation summary smartart. This is a nine stage process. The stages in this process are y values, x values, product, business, graph.

Bar Chart Ppt PowerPoint Presentation Icon Information
This is a bar chart ppt powerpoint presentation icon information. This is a one stage process. The stages in this process are product, sales in percentage, financial years, bar graph, growth.

Bar Chart Ppt PowerPoint Presentation Layouts Pictures
This is a bar chart ppt powerpoint presentation layouts pictures. This is a three stage process. The stages in this process are bar graph, product, sales in percentage, business, marketing.

Bar Chart Ppt PowerPoint Presentation Outline Introduction
This is a bar chart ppt powerpoint presentation outline introduction. This is a one stage process. The stages in this process are sales in percentage, product, business, financial years, graph.

Bar Chart Ppt PowerPoint Presentation Outline Guidelines
This is a bar chart ppt powerpoint presentation outline guidelines. This is a four stage process. The stages in this process are product, unit count, in years, graph, finance, business.

Combo Chart Ppt PowerPoint Presentation Summary Slides
This is a combo chart ppt powerpoint presentation summary slides. This is a three stage process. The stages in this process are market size, product, growth rate, bar graph, success.

Combo Chart Ppt PowerPoint Presentation Inspiration Background
This is a combo chart ppt powerpoint presentation inspiration background. This is a three stage process. The stages in this process are product, bar graph, market size, growth, growth rate.

Column Chart Ppt PowerPoint Presentation Infographics Deck
This is a column chart ppt powerpoint presentation infographics deck. This is a two stage process. The stages in this process are product, expenditure in, years, bar graph, growth.

Combo Chart Ppt PowerPoint Presentation Show Influencers
This is a combo chart ppt powerpoint presentation show influencers. This is a three stage process. The stages in this process are product, bar graph, growth, growth rate, market size.

Column Chart Ppt PowerPoint Presentation File Summary
This is a column chart ppt powerpoint presentation file summary. This is a two stage process. The stages in this process are product, dollars, in years, bar graph, growth.

Column Chart Ppt PowerPoint Presentation Infographics Guidelines
This is a column chart ppt powerpoint presentation infographics guidelines. This is a two stage process. The stages in this process are product, expenditure in, years, business, bar graph.

Combo Chart Ppt PowerPoint Presentation Pictures Summary
This is a combo chart ppt powerpoint presentation pictures summary. This is a three stage process. The stages in this process are product, market size, growth rate, bar graph, success.

Area Chart Ppt PowerPoint Presentation Show Templates
This is a area chart ppt powerpoint presentation show templates. This is a two stage process. The stages in this process are product, in percentage, in years, finance, graph.

Area Chart Ppt PowerPoint Presentation Topics
This is a area chart ppt powerpoint presentation topics. This is a two stage process. The stages in this process are product, in percentage, jan, feb, mar, apr, may.

Column Chart Ppt PowerPoint Presentation Show
This is a column chart ppt powerpoint presentation show. This is a six stage process. The stages in this process are product, in percentage, jan, feb, mar, apr, may.

Area Chart Ppt Powerpoint Presentation File Show
This is a area chart ppt powerpoint presentation file show. This is a two stage process. The stages in this process are sales in percentage, financial year, product, financial, business.

Area Chart Ppt PowerPoint Presentation Slides Rules
This is a area chart ppt powerpoint presentation slides rules. This is a two stage process. The stages in this process are sales in percentage, business, marketing, product, finance.

Line Chart Ppt PowerPoint Presentation Professional Ideas
This is a line chart ppt powerpoint presentation professional ideas. This is a two stage process. The stages in this process are in percentage, product, business, marketing, finance, percentage.

Column Chart Ppt PowerPoint Presentation Layouts Ideas
This is a column chart ppt powerpoint presentation layouts ideas. This is a two stage process. The stages in this process are dollars in thousands, strategy, business, graph, product.

Combo Chart Ppt PowerPoint Presentation Infographics Introduction
This is a combo chart ppt powerpoint presentation infographics introduction. This is a three stage process. The stages in this process are profit in percentage, business, graph, strategy, product.

Column Chart Ppt PowerPoint Presentation Summary Graphics
This is a column chart ppt powerpoint presentation summary graphics. This is a nine stage process. The stages in this process are product, years, expenditure in billions, graph, business.

Combo Chart Ppt PowerPoint Presentation Summary Layouts
This is a combo chart ppt powerpoint presentation summary layouts. This is a eight stage process. The stages in this process are product, sales in percentage, in years, in price, graph.

Column Chart Ppt PowerPoint Presentation Gallery Background
This is a column chart ppt powerpoint presentation gallery background. This is a two stage process. The stages in this process are product, sales in percentage, financial year, graph, success.
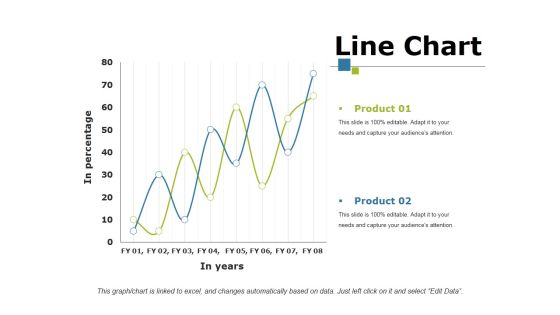
Line Chart Ppt PowerPoint Presentation Portfolio Mockup
This is a line chart ppt powerpoint presentation portfolio mockup. This is a two stage process. The stages in this process are product, in percentage, in year, growth, success.
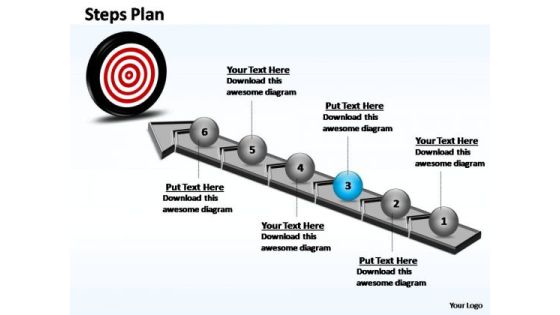
PowerPoint Themes Chart Steps Plan Ppt Slides
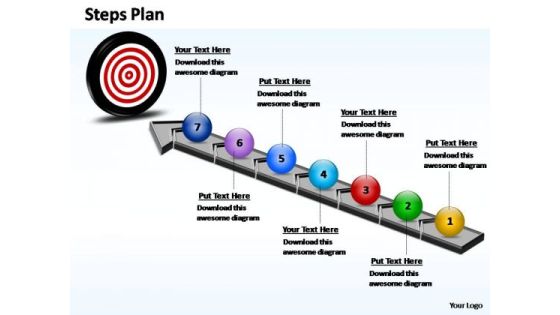
PowerPoint Themes Chart Steps Plan PPT Slides-This PowerPoint template shows Step Plan which consists of 4 Stages. It can be used to to show grouped or related information.-PowerPoint Themes Chart Steps Plan PPT Slides
PowerPoint Designs Chart Steps Plan Ppt Process
PowerPoint Designs Chart Steps Plan PPT Process-This PowerPoint template shows Step Plan which consists of 3 Stages. It can be used to to show grouped or related information.-PowerPoint Designs Chart Steps Plan PPT Process

PowerPoint Template Chart Steps Plan Ppt Slides
PowerPoint Template Chart Steps Plan PPT Slides-This PowerPoint template shows Step Plan which consists of 4 Stages. It can be used to to show grouped or related information.-PowerPoint Template Chart Steps Plan PPT Slides
Quarterly Online Products Sales Chart Graphics PDF
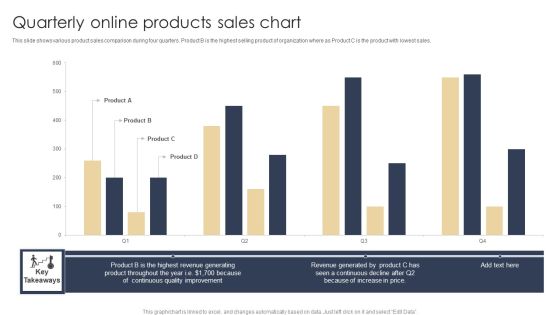
This slide shows various product sales comparison during four quarters. Product B is the highest selling product of organization where as Product C is the product with lowest sales. Showcasing this set of slides titled Quarterly Online Products Sales Chart Graphics PDF. The topics addressed in these templates are Revenue Generated, Increase In Price, Quality. All the content presented in this PPT design is completely editable. Download it and make adjustments in color, background, font etc. as per your unique business setting.

Area Chart Ppt PowerPoint Presentation Summary Templates
This is a area chart ppt powerpoint presentation summary templates. This is a two stage process. The stages in this process are product, in percentage, bar graph, growth, business.

Combo Chart Ppt PowerPoint Presentation Gallery Sample
This is a combo chart ppt powerpoint presentation gallery sample. This is a three stage process. The stages in this process are market size, product, growth rate, bar, graph.

Area Chart Ppt PowerPoint Presentation Styles Images
This is a area chart ppt powerpoint presentation styles images. This is a two stage process. The stages in this process are sales in percentage, product, graph, business, marketing.
Line Chart Ppt PowerPoint Presentation Outline Samples
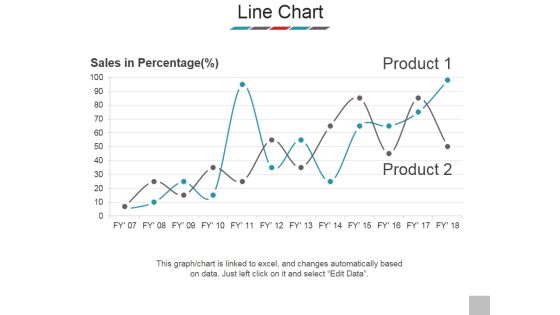
This is a line chart ppt powerpoint presentation outline samples. This is a two stage process. The stages in this process are sales in percentage, product, business, marketing, success.

Column Chart Ppt PowerPoint Presentation Gallery Topics
This is a column chart ppt powerpoint presentation gallery topics. This is a two stage process. The stages in this process are dollars in thousands, product, business, marketing, strategy.

Line Chart Ppt PowerPoint Presentation Professional Smartart
This is a line chart ppt powerpoint presentation professional smartart. This is a two stage process. The stages in this process are in percentage, in years, product, finance, business.

Combo Chart Ppt PowerPoint Presentation Styles Good
This is a combo chart ppt powerpoint presentation styles good. This is a eight stage process. The stages in this process are market size, growth rate, product, growth, strategy, graph, finance.
PowerPoint Presentation Chart Four Results Ppt Theme
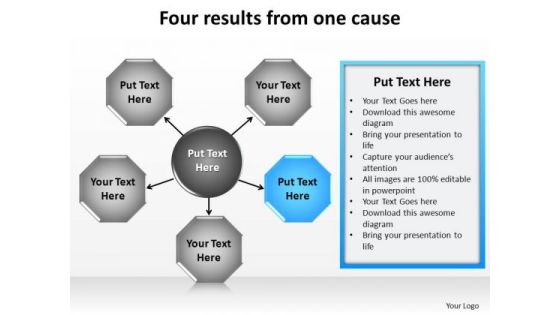
PowerPoint Presentation Chart Four Results PPT Theme-The Circle of Life - a concept emmbedded in our minds and hence easy to comprehend. Life and Business is made up of processes comprising stages that flow from one to another. An excellent graphic to attract the attention of and understanding by your audience to improve earnings.-These amazing PowerPoint pre-designed slides and PowerPoint templates have been carefully created by our team of experts to help you impress your audience. Our stunning collection of Powerpoint slides are 100% editable and can easily fit in any PowerPoint presentations. By using these animations and graphics in PowerPoint and you can easily make professional presentations. Any text can be entered at any point in the PowerPoint template or slide. Just DOWNLOAD our awesome PowerPoint templates and you are ready to go.

Column Chart Ppt PowerPoint Presentation Icon Show
This is a column chart ppt powerpoint presentation icon show. This is a two stage process. The stages in this process are column chart, product, years, bar graph, growth.

Chart For Financial Percentage Analysis Powerpoint Slides
This PowerPoint template has been designed with financial chart with dollar icon. This PPT slide may be used to display dollar value analysis chart. Download this slide to build unique presentation.

Combo Chart Ppt PowerPoint Presentation Portfolio Themes
This is a combo chart ppt powerpoint presentation portfolio themes. This is a three stage process. The stages in this process are market size, product, management, finance, chart, marketing.

Bubble Chart Ppt PowerPoint Presentation Icon Slides
This is a bubble chart ppt powerpoint presentation icon slides. This is a three stage process. The stages in this process are product, finance, business, marketing, bubble chart .

Area Chart Ppt PowerPoint Presentation Icon Show
This is a area chart ppt powerpoint presentation icon show. This is a two stage process. The stages in this process are product, financial year, in percentage, area chart.

Combo Chart Ppt PowerPoint Presentation Icon Introduction
This is a combo chart ppt powerpoint presentation icon introduction. This is a three stage process. The stages in this process are combo chart, product, growth rate, market size, growth.
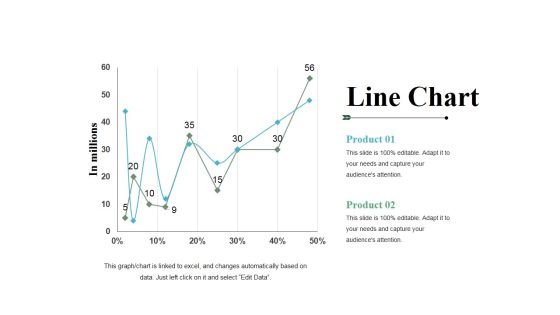
Line Chart Ppt PowerPoint Presentation File Templates
This is a line chart ppt powerpoint presentation file templates. This is a two stage process. The stages in this process are product, line chart, growth, percentage, in millions.

Line Chart Ppt PowerPoint Presentation Infographics Infographics
This is a line chart ppt powerpoint presentation infographics infographics. This is a two stage process. The stages in this process are product, sales in percentage, financial year, line chart, finance.

Scatter Chart Ppt PowerPoint Presentation Outline Ideas
This is a scatter chart ppt powerpoint presentation outline ideas. This is a two stage process. The stages in this process are product, scatter chart, business, in percentage, marketing.

Area Chart Ppt PowerPoint Presentation Slides Example
This is a area chart ppt powerpoint presentation slides example. This is a two stage process. The stages in this process are sales in percentage, product, area chart, business, finance.

Line Chart Ppt PowerPoint Presentation Gallery Rules
This is a line chart ppt powerpoint presentation gallery rules. This is a two stage process. The stages in this process are financial years, product, sales in percentage, line chart, growth.

Bar Chart Ppt PowerPoint Presentation Inspiration Demonstration
This is a bar chart ppt powerpoint presentation inspiration demonstration. This is a two stage process. The stages in this process are bar chart, financial years, sales in percentage, product, finance.

Line Chart Ppt PowerPoint Presentation Gallery Templates
This is a line chart ppt powerpoint presentation gallery templates. This is a two stage process. The stages in this process are product, financial years, sales in percentage, line chart.

Bar Chart Ppt PowerPoint Presentation Model Picture
This is a bar chart ppt powerpoint presentation model picture. This is a two stage process. The stages in this process are product, sales in percentage, financial years, bar chart.

Area Chart Ppt PowerPoint Presentation Inspiration Graphics
This is a area chart ppt powerpoint presentation inspiration graphics. This is a two stage process. The stages in this process are product, area chart, business, growth, sales in percentage.

Clustered Chart Ppt PowerPoint Presentation Outline Templates
This is a clustered chart ppt powerpoint presentation outline templates. This is a three stage process. The stages in this process are product, in percentage, in years, clustered chart.

 Home
Home