Goal Chart

Area Chart Ppt PowerPoint Presentation Professional Display
This is a area chart ppt powerpoint presentation professional display. This is a two stage process. The stages in this process are business, finance, growth, strategy, marketing, analysis.

Ppt Parallel Steps Plan Toward Meeting The Goal Business PowerPoint Templates
PPT parallel steps plan toward meeting the goal Business PowerPoint Templates-This PowerPoint Diagram shows the steps towards meeting the goal. This PowerPoint Diagram represents fortune, gain, good luck, good times, grand slam, and lap of luxury, laughter, maturation, profit, progress, prosperity, realization, reward, triumph, and victory.-PPT parallel steps plan toward meeting the goal Business PowerPoint Templates

Business Target Achievement Hexagon Chart Powerpoint Slides
This PowerPoint template has been designed with graphics of hexagon chart. You may use this PPT slide to display strategy for target achievement. Impress your audiences by using this PPT slide.
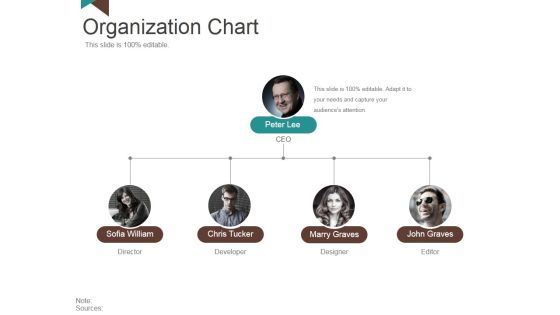
Organization Chart Ppt PowerPoint Presentation Styles Outfit
This is a organization chart ppt powerpoint presentation styles outfit. This is a four stage process. The stages in this process are peter lee, sofia william, chris tucker, marry graves, john graves.

Ppt Parallel Steps Plan To Achieve Goal Business Management PowerPoint Business Templates
PPT parallel steps plan to achieve goal business management powerpoint Business Templates-This PowerPoint Diagram shows the steps to reach the Destination. It portrays the concept of accomplishment, achievement, attainment, benefit, big hit, eminence, fame, flying colors.-PPT parallel steps plan to achieve goal business management powerpoint Business Templates
Web Marketing Analytics Bounce Rate Goal Conversion Ppt PowerPoint Presentation Inspiration Icon
This is a web marketing analytics bounce rate goal conversion ppt powerpoint presentation inspiration icon. This is a six stage process. The stages in this process are digital analytics, digital dashboard, marketing.

Project Management Office Flow Chart Inspiration PDF
Presenting project management office flow chart inspiration pdf to dispense important information. This template comprises three stages. It also presents valuable insights into the topics including develop change management plan, project management simulation, vision, mission and goals. This is a completely customizable PowerPoint theme that can be put to use immediately. So, download it and address the topic impactfully.
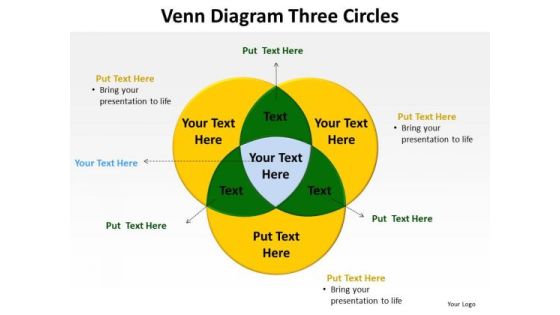
PowerPoint Backgrounds Chart Venn Diagram Ppt Design
PowerPoint Backgrounds Chart Venn Diagram PPT Design-The Venn graphic comprising interlinking circles geometrically demonstrate how various functions operating independently, to a large extent, are essentially interdependent. Amplify on this basic corporate concept and forefront the benefits of overlapping processes to arrive at common goals.-Background, Black, Blue, Business, Chart, Circle, Diagram, Drop, Financial, Green, Icon, Isolated, Overlapping, Process, Red, Round, Shadow, Shape, Three, Transparency, Vector, Venn, White

Great Team Building Ideas Chart Presentation Graphics
This is a great team building ideas chart presentation graphics. This is a four stage process. The stages in this process are goal, reality, options, way forward.

Change Management Flow Chart Ppt Presentation
This is a change management flow chart ppt presentation. This is a four stage process. The stages in this process are defined goals, implementation, diagnosis, learning.
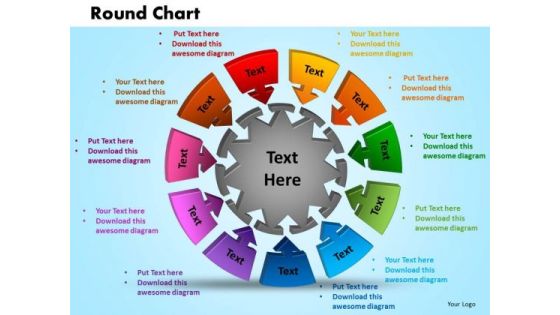
PowerPoint Template Round Chart Success Ppt Slides
PowerPoint Template Round Chart Success PPT Slides-Round charts show the relative importance of values over a period of time. Although Round charts are similar to line charts, area charts emphasize the amount of change or magnitude of values, rather than time and the rate of change. This PowerPoint Diagram is an excellent graphic to attract the attention of and understanding by your audience to improve earnings.-PowerPoint Template Round Chart Success PPT Slides
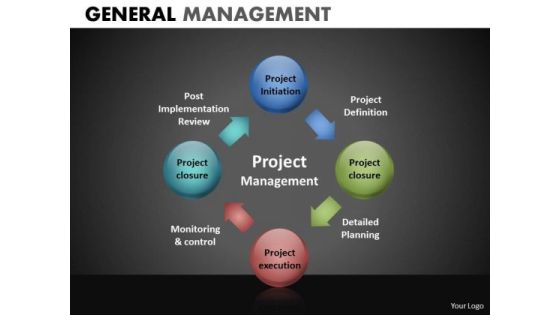
Project Management Process Circle Chart PowerPoint Templates
Project Management Process Circle Chart PowerPoint Templates-These high quality powerpoint pre-designed slides and powerpoint templates have been carefully created by our professional team to help you impress your audience. All slides have been created and are 100% editable in powerpoint. Each and every property of any graphic - color, size, orientation, shading, outline etc. can be modified to help you build an effective powerpoint presentation. Any text can be entered at any point in the powerpoint template or slide. Simply DOWNLOAD, TYPE and PRESENT!-These PowerPoint presentation slides can be used to represent concepts relating to--Abstract, action, analysis, blank, business, chart, clipart, commerce, concept, conceptual, design, diagram, direction, flow, generic, goals, guide, guidelines, heirarchy, icon, idea, illustration, lingakes, links, manage, management, mba, model, organization, performance, plan, process, project, relationship, representation, resource, steps, strategy, success, tactics, theoretical, theory, tool, workflow-Project Management Process Circle Chart PowerPoint Templates
Marketing Plan Procedural Flow Chart Icons PDF
This slide showcases the marketing process flow to provide stand-alone value for customers and prospects with the long-term objective of proving the worth of the product. It also includes campaign goals, analyzing, forecasting efforts, target market, comparing results, etc. Presenting Marketing Plan Procedural Flow Chart Icons PDF to dispense important information. This template comprises one stages. It also presents valuable insights into the topics including Analyze Markets, Realistic Goal, Update Needed. This is a completely customizable PowerPoint theme that can be put to use immediately. So, download it and address the topic impactfully.

Bubble Chart Ppt PowerPoint Presentation Infographics Objects
This is a bubble chart ppt powerpoint presentation infographics objects. This is a two stage process. The stages in this process are finance, business, analysis, marketing, bubble chart.

Bar Chart Ppt PowerPoint Presentation Inspiration Outfit
This is a bar chart ppt powerpoint presentation inspiration outfit. This is a three stage process. The stages in this process are percentage, product, bar chart, marketing.

Bar Chart Ppt PowerPoint Presentation Portfolio Slides
This is a bar chart ppt powerpoint presentation portfolio slides. This is a one stage process. The stages in this process are product, percentage, marketing, business, bar chart.

Column Chart Ppt PowerPoint Presentation Layouts Images
This is a column chart ppt powerpoint presentation layouts images. This is a two stage process. The stages in this process are product, column chart, bar graph, marketing.
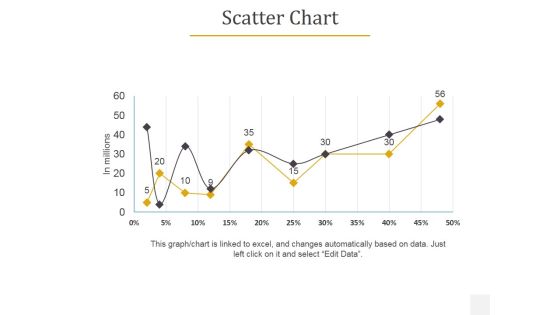
Scatter Chart Ppt PowerPoint Presentation Inspiration Styles
This is a scatter chart ppt powerpoint presentation inspiration styles. This is a two stage process. The stages in this process are business, chart, marketing, product, management.

Line Chart Ppt PowerPoint Presentation Visual Aids
This is a line chart ppt powerpoint presentation visual aids. This is a two stage process. The stages in this process are product, line chart, growth, strategy, business.

Line Chart Ppt PowerPoint Presentation Summary Picture
This is a line chart ppt powerpoint presentation summary picture. This is a two stage process. The stages in this process are business, marketing, line chart, management, product.

Bubble Chart Ppt PowerPoint Presentation Ideas Slideshow
This is a bubble chart ppt powerpoint presentation ideas slideshow. This is a four stage process. The stages in this process are product, business, marketing, chart.

Line Chart Ppt PowerPoint Presentation Styles Introduction
This is a line chart ppt powerpoint presentation styles introduction. This is a two stage process. The stages in this process are in percentage, product, chart, business, marketing.

Bubble Chart Ppt PowerPoint Presentation Model Gallery
This is a bubble chart ppt powerpoint presentation model gallery. This is a three stage process. The stages in this process are product, bubble chart, business, marketing, graph.

Area Chart Ppt PowerPoint Presentation Background Image
This is a area chart ppt powerpoint presentation background image. This is a two stage process. The stages in this process are product, area chart, business, growth, success.

Radar Chart Ppt PowerPoint Presentation Inspiration Layouts
This is a radar chart ppt powerpoint presentation inspiration layouts. This is a two stage process. The stages in this process are radar chart, product, marketing, strategy, analysis.

Area Chart Ppt PowerPoint Presentation Ideas Deck
This is a area chart ppt powerpoint presentation ideas deck. This is a two stage process. The stages in this process are product, area chart, success, growth, business.

Area Chart Ppt PowerPoint Presentation Layouts Visuals
This is a area chart ppt powerpoint presentation layouts visuals. This is a two stage process. The stages in this process are product, area chart, growth, success, business.

Bubble Chart Ppt PowerPoint Presentation Model Influencers
This is a bubble chart ppt powerpoint presentation model influencers. This is a three stage process. The stages in this process are product, bubble chart, business, marketing, management.

Area Chart Ppt PowerPoint Presentation Styles Professional
This is a area chart ppt powerpoint presentation styles professional. This is a two stage process. The stages in this process are sales in percentage, product, area chart.

Bubble Chart Ppt PowerPoint Presentation Outline Demonstration
This is a bubble chart ppt powerpoint presentation outline demonstration. This is a two stage process. The stages in this process are bubble chart, product, in percentage.

Bubble Chart Ppt PowerPoint Presentation Outline Example
This is a bubble chart ppt powerpoint presentation outline example. This is a two stage process. The stages in this process are bubble chart, product, growth.

Area Chart Ppt PowerPoint Presentation Portfolio Examples
This is a area chart ppt powerpoint presentation portfolio examples. This is a two stage process. The stages in this process are product, area chart, sales in percentage.

Area Chart Ppt PowerPoint Presentation Layouts Gridlines
This is a area chart ppt powerpoint presentation layouts gridlines. This is a two stage process. The stages in this process are area chart, product, percentage, analysis, capture.
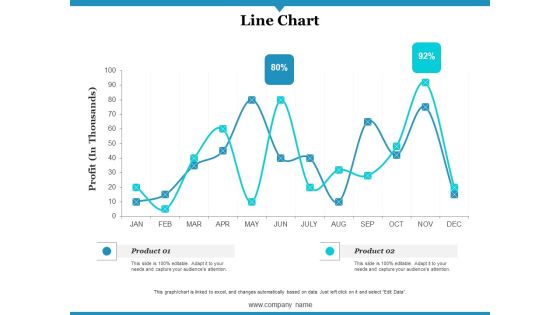
Line Chart Ppt PowerPoint Presentation Gallery Infographics
This is a line chart ppt powerpoint presentation gallery infographics. This is a two stage process. The stages in this process are profit, product, line chart.

Column Chart Ppt PowerPoint Presentation Gallery Show
This is a column chart ppt powerpoint presentation gallery show. This is a two stage process. The stages in this process are column chart, product, year, expenditure, growth.

Bubble Chart Ppt PowerPoint Presentation Summary Background
This is a bubble chart ppt powerpoint presentation summary background. This is a two stage process. The stages in this process are bubble chart, profit, product, finance, business.

Bubble Chart Ppt PowerPoint Presentation Slides Portrait
This is a bubble chart ppt powerpoint presentation slides portrait. This is a two stage process. The stages in this process are bubble chart, product, finance, business, marketing.

Scatter Chart Ppt PowerPoint Presentation Styles Guidelines
This is a scatter chart ppt powerpoint presentation styles guidelines. This is a two stage process. The stages in this process are scatter chart, percentage, product.

Radar Chart Ppt PowerPoint Presentation Professional Ideas
This is a radar chart ppt powerpoint presentation professional ideas. This is a two stage process. The stages in this process are product, percentage, management, marketing, chart.
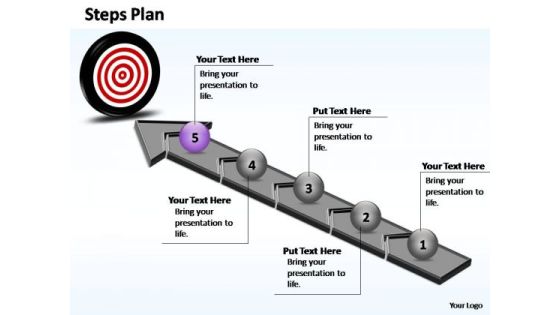
PowerPoint Designs Chart Steps Plan Ppt Theme
PowerPoint Designs Chart Steps Plan PPT Theme-This PowerPoint template shows Step Plan which consists of 5 Stages. It can be used to to show grouped or related information.-PowerPoint Designs Chart Steps Plan PPT Theme
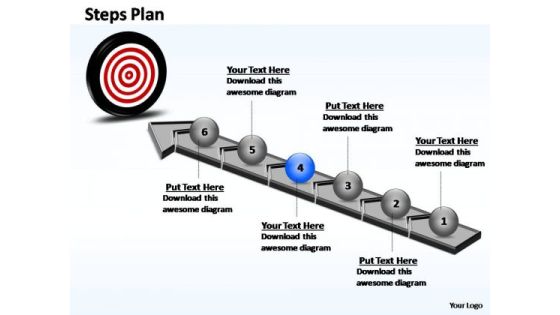
PowerPoint Process Chart Steps Plan Ppt Designs
PowerPoint Process Chart Steps Plan PPT Designs-This PowerPoint template shows Step Plan which consists of 6 Stages. It can be used to to show grouped or related information.-PowerPoint Process Chart Steps Plan PPT Designs
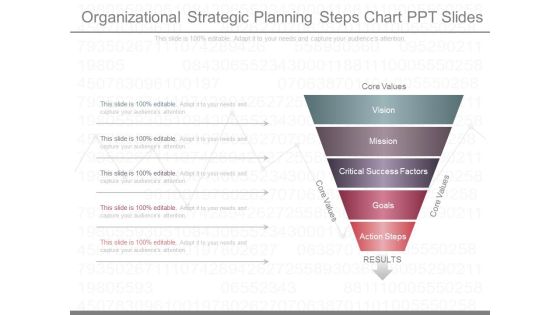
Organizational Strategic Planning Steps Chart Ppt Slides
This is a organizational strategic planning steps chart ppt slides. This is a five stage process. The stages in this process are vision, mission, critical success factors, goals, action steps, core values, results.

Business Assessment Ppt Chart Powerpoint Slides Show
This is a business assessment ppt chart powerpoint slides show. This is a six stage process. The stages in this process are mission, goals, objectives, outcomes, result analysis, action.
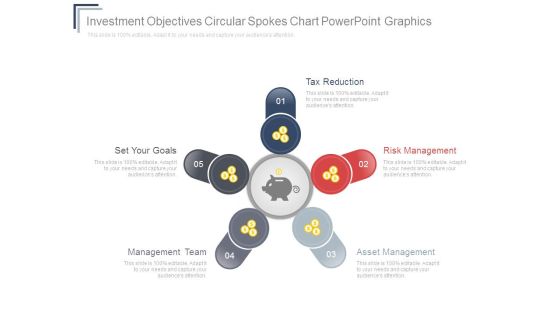
Investment Objectives Circular Spokes Chart Powerpoint Graphics
This is a investment objectives circular spokes chart powerpoint graphics. This is a five stage process. The stages in this process are tax reduction, set your goals, management team, asset management, risk management.
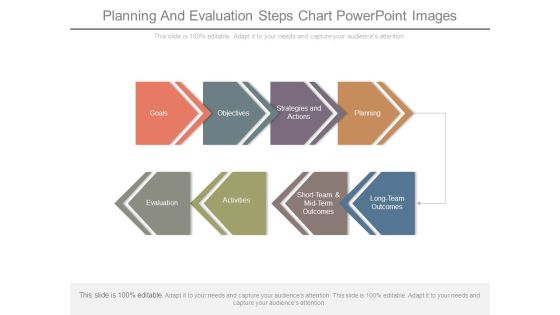
Planning And Evaluation Steps Chart Powerpoint Images
This is a planning and evaluation steps chart powerpoint images. This is a eight stage process. The stages in this process are goals, objectives, strategies and actions, planning, evaluation, activities, short team and mid term outcomes, long team outcomes.

Business Strategy Process Steps Chart Powerpoint Slides
This is a business strategy process steps chart powerpoint slides. This is a six stage process. The stages in this process are goals, mission, value, vision, strategy, action plan.
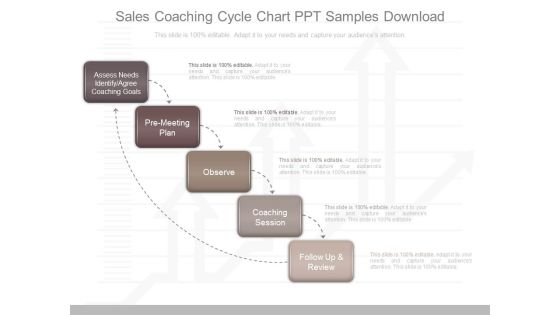
Sales Coaching Cycle Chart Ppt Samples Download
This is a sales coaching cycle chart ppt samples download. This is a five stage process. The stages in this process are assess needs identify agree coaching goals, pre meeting plan, observe, coaching session, follow up and review.

PowerPoint Presentation Process Flow Chart Circular Templates
We present our powerpoint presentation process flow chart Circular templates.Present our Business PowerPoint Templates because like the famed William Tell, they put aside all emotions and concentrate on the target. Download and present our Flow Charts PowerPoint Templates because it helps you to inform your team of your innovative ideas. Use our Process and Flows PowerPoint Templates because you can Signpost your preferred roadmap to your eager co- travellers and demonstrate clearly how you intend to navigate them towards the desired corporate goal. Download and present our Shapes PowerPoint Templates because brilliant ideas are your forte. Download our Success PowerPoint Templates because the choices you make today will determine the future growth of your enterprise.Use these PowerPoint slides for presentations relating to Arrows, Business, Central, Centralized, Chart, Circle, Circular, Circulation, Concept, Conceptual, Illustration, Organization, Pointing, Process, Radial, Resource, Strategy, Template, Graphic, Group, Illustration, Process, Progress. The prominent colors used in the PowerPoint template are Blue, Gray, White. People tell us our powerpoint presentation process flow chart Circular templates are Stunning. Professionals tell us our Circle PowerPoint templates and PPT Slides will generate and maintain the level of interest you desire. They will create the impression you want to imprint on your audience. Customers tell us our powerpoint presentation process flow chart Circular templates are No-nonsense. Use our Circular PowerPoint templates and PPT Slides are Beautiful. We assure you our powerpoint presentation process flow chart Circular templates will impress their bosses and teams. Professionals tell us our Concept PowerPoint templates and PPT Slides are Tasteful.

Bar Chart Ppt PowerPoint Presentation Pictures Mockup
This is a bar chart ppt powerpoint presentation pictures mockup. This is a twelve stage process. The stages in this process are dollars, product, bar chart.

Area Chart Ppt PowerPoint Presentation Diagrams
This is a area chart ppt powerpoint presentation diagrams.This is a two stage process. The stages in this process are in percentage, area chart, product.

Column Chart Ppt PowerPoint Presentation Summary Icon
This is a column chart ppt powerpoint presentation summary icon. This is a two stage process. The stages in this process are column chart, dollars, product.

Area Chart Ppt PowerPoint Presentation Inspiration Images
This is a area chart ppt powerpoint presentation inspiration images. This is a two stage process. The stages in this process are area chart, product, sales in percentage.

Column Chart Ppt PowerPoint Presentation Ideas Guidelines
This is a column chart ppt powerpoint presentation ideas guidelines. This is a two stage process. The stages in this process are column chart, product, year, business, marketing.
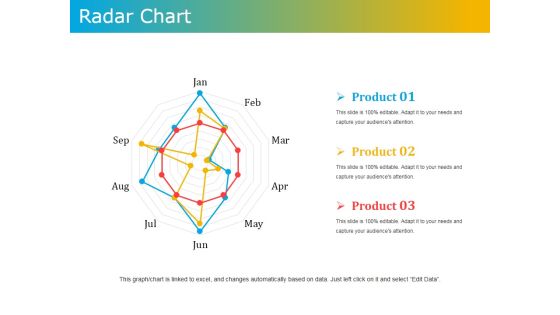
Radar Chart Ppt PowerPoint Presentation Outline Model
This is a radar chart ppt powerpoint presentation outline model. This is a three stage process. The stages in this process are radar chart, product, business, marketing, management.
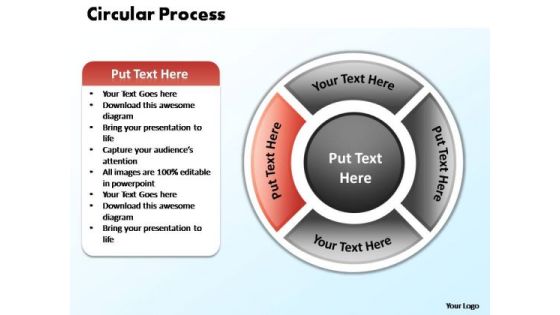
PowerPoint Template Chart Circular Process Ppt Template
PowerPoint Template Chart Circular Process PPT Template-Highlight the key components of your entire manufacturing/ business process. Illustrate how each element flows seamlessly onto the next stage. Emphasise on any critical or key factors within them. Demonstrate how they all combine to form the final product.-PowerPoint Template Chart Circular Process PPT Template
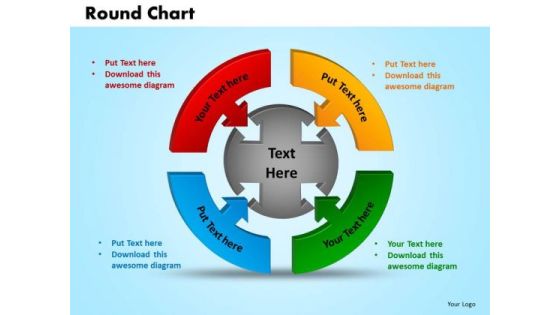
PowerPoint Presentation Round Chart Sales Ppt Themes
PowerPoint Presentation Round Chart Sales PPT Themes-This PowerPoint Diagram represents the Round Sales Chart in which four different approaches which results in one common Outcome. It Imitates the concept of Teamwork as they are inter-related to each other.-PowerPoint Presentation Round Chart Sales PPT Themes
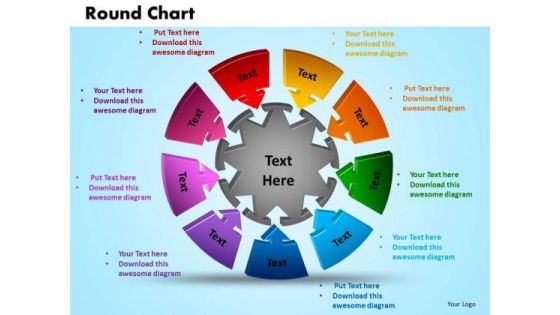
PowerPoint Presentation Round Chart Sales Ppt Template
PowerPoint Presentation Round Chart Sales PPT template-This PowerPoint Diagram represents the Round Sales Chart in which nine different problems or issues results in one common Outcome. It Portrays the concept of Teamwork as they are interconnected to each other.-PowerPoint Presentation Round Chart Sales PPT template

Combo Chart Ppt PowerPoint Presentation Portfolio Template
This is a combo chart ppt powerpoint presentation portfolio template. This is a three stage process. The stages in this process are product, business, marketing, combo chart, percentage.

PowerPoint Theme Chart Contributing Factors Ppt Templates
PowerPoint Theme Chart Contributing Factors PPT Templates-PowerPoint Process Teamwork Contributing Factors PPT Themes-Explore the various directions and layers existing in your in your plans and processes. Unravel the desired and essential elements of your overall strategy. Explain the relevance of the different layers and stages and directions in getting down to your core competence, ability and desired result.-PowerPoint Theme Chart Contributing Factors PPT Templates
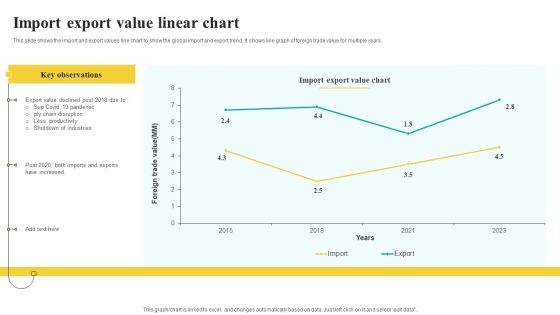
Import Export Value Linear Chart Summary PDF
This slide shows the import and export values line chart to show the global import and export trend. It shows line graph of foreign trade value for multiple years Showcasing this set of slides titled Import Export Value Linear Chart Summary PDF. The topics addressed in these templates are Key Observations, Value Chart, Industries. All the content presented in this PPT design is completely editable. Download it and make adjustments in color, background, font etc. as per your unique business setting.

 Home
Home