Goal Chart
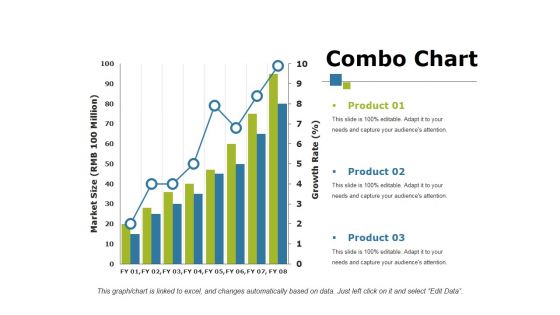
Combo Chart Ppt PowerPoint Presentation Show Influencers
This is a combo chart ppt powerpoint presentation show influencers. This is a three stage process. The stages in this process are product, bar graph, growth, growth rate, market size.
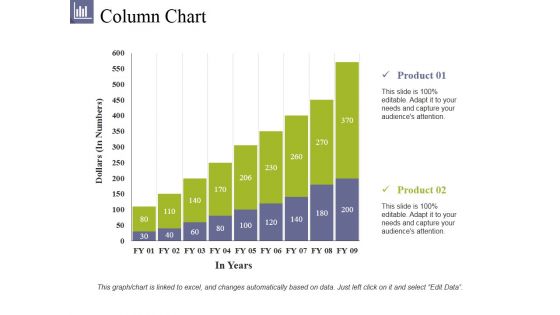
Column Chart Ppt PowerPoint Presentation File Summary
This is a column chart ppt powerpoint presentation file summary. This is a two stage process. The stages in this process are product, dollars, in years, bar graph, growth.
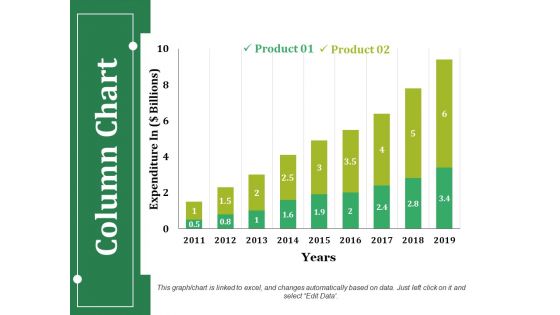
Column Chart Ppt PowerPoint Presentation Infographics Guidelines
This is a column chart ppt powerpoint presentation infographics guidelines. This is a two stage process. The stages in this process are product, expenditure in, years, business, bar graph.

Combo Chart Ppt PowerPoint Presentation Pictures Summary
This is a combo chart ppt powerpoint presentation pictures summary. This is a three stage process. The stages in this process are product, market size, growth rate, bar graph, success.
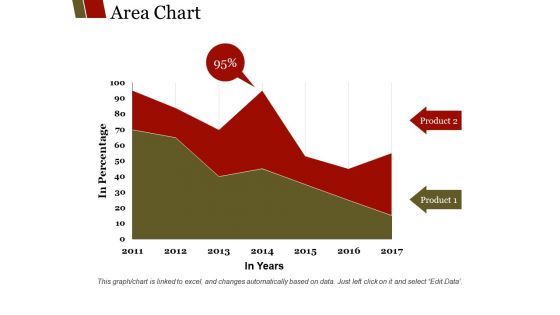
Area Chart Ppt PowerPoint Presentation Show Templates
This is a area chart ppt powerpoint presentation show templates. This is a two stage process. The stages in this process are product, in percentage, in years, finance, graph.

Line Chart Ppt PowerPoint Presentation Outline Samples
This is a line chart ppt powerpoint presentation outline samples. This is a two stage process. The stages in this process are sales in percentage, product, business, marketing, success.
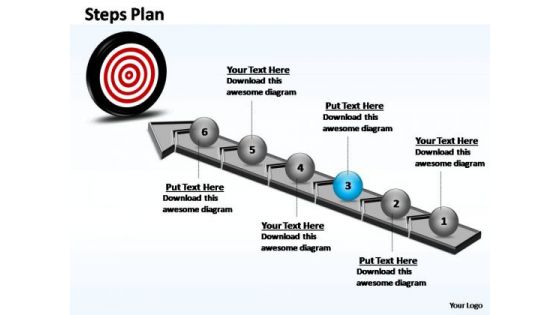
PowerPoint Themes Chart Steps Plan Ppt Slides
PowerPoint Themes Chart Steps Plan PPT Slides-This PowerPoint template shows Step Plan which consists of 4 Stages. It can be used to to show grouped or related information.-PowerPoint Themes Chart Steps Plan PPT Slides

Area Chart Ppt PowerPoint Presentation Topics
This is a area chart ppt powerpoint presentation topics. This is a two stage process. The stages in this process are product, in percentage, jan, feb, mar, apr, may.
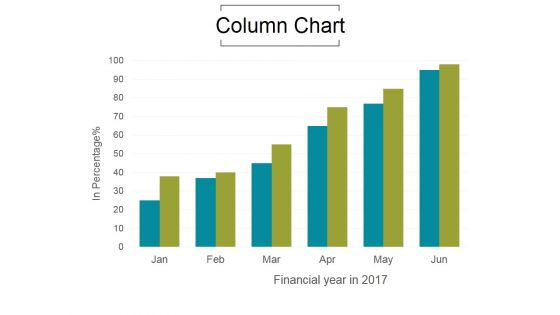
Column Chart Ppt PowerPoint Presentation Show
This is a column chart ppt powerpoint presentation show. This is a six stage process. The stages in this process are product, in percentage, jan, feb, mar, apr, may.

Area Chart Ppt Powerpoint Presentation File Show
This is a area chart ppt powerpoint presentation file show. This is a two stage process. The stages in this process are sales in percentage, financial year, product, financial, business.
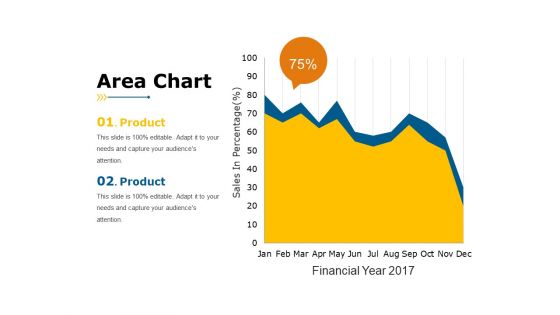
Area Chart Ppt PowerPoint Presentation Slides Rules
This is a area chart ppt powerpoint presentation slides rules. This is a two stage process. The stages in this process are sales in percentage, business, marketing, product, finance.

Line Chart Ppt PowerPoint Presentation Professional Ideas
This is a line chart ppt powerpoint presentation professional ideas. This is a two stage process. The stages in this process are in percentage, product, business, marketing, finance, percentage.
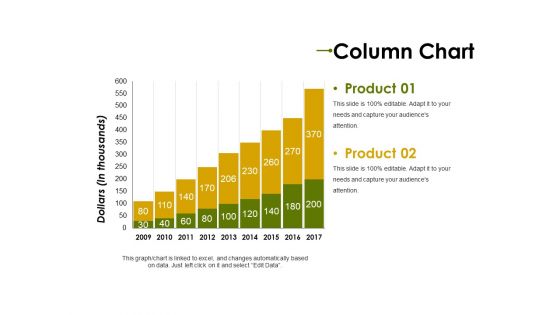
Column Chart Ppt PowerPoint Presentation Layouts Ideas
This is a column chart ppt powerpoint presentation layouts ideas. This is a two stage process. The stages in this process are dollars in thousands, strategy, business, graph, product.

Combo Chart Ppt PowerPoint Presentation Infographics Introduction
This is a combo chart ppt powerpoint presentation infographics introduction. This is a three stage process. The stages in this process are profit in percentage, business, graph, strategy, product.
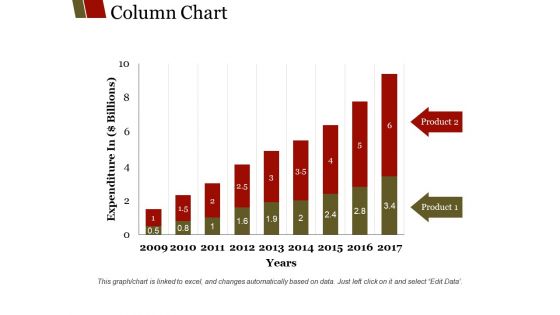
Column Chart Ppt PowerPoint Presentation Summary Graphics
This is a column chart ppt powerpoint presentation summary graphics. This is a nine stage process. The stages in this process are product, years, expenditure in billions, graph, business.
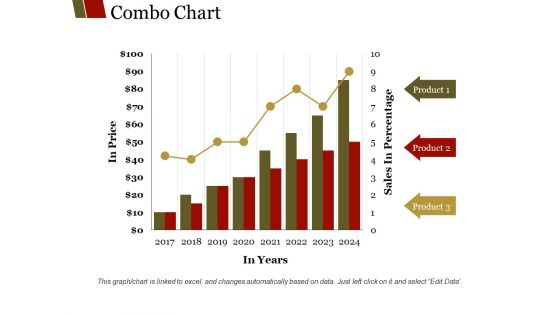
Combo Chart Ppt PowerPoint Presentation Summary Layouts
This is a combo chart ppt powerpoint presentation summary layouts. This is a eight stage process. The stages in this process are product, sales in percentage, in years, in price, graph.
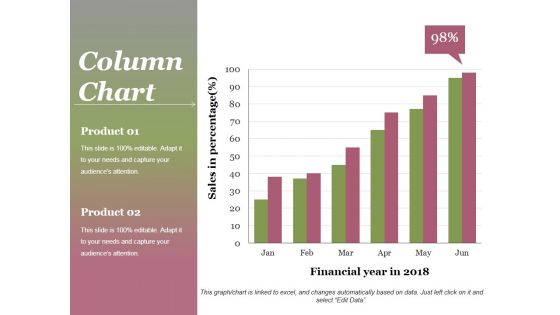
Column Chart Ppt PowerPoint Presentation Gallery Background
This is a column chart ppt powerpoint presentation gallery background. This is a two stage process. The stages in this process are product, sales in percentage, financial year, graph, success.
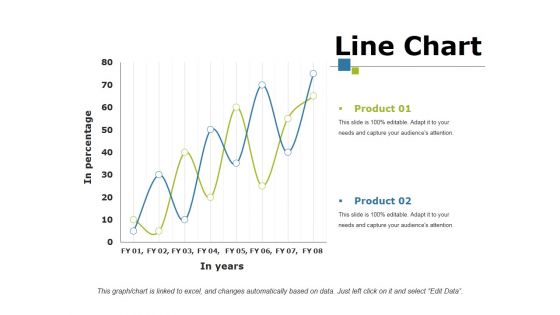
Line Chart Ppt PowerPoint Presentation Portfolio Mockup
This is a line chart ppt powerpoint presentation portfolio mockup. This is a two stage process. The stages in this process are product, in percentage, in year, growth, success.
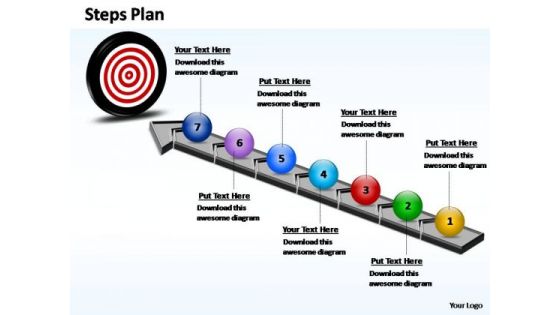
PowerPoint Designs Chart Steps Plan Ppt Process
PowerPoint Designs Chart Steps Plan PPT Process-This PowerPoint template shows Step Plan which consists of 3 Stages. It can be used to to show grouped or related information.-PowerPoint Designs Chart Steps Plan PPT Process

PowerPoint Template Chart Steps Plan Ppt Slides
PowerPoint Template Chart Steps Plan PPT Slides-This PowerPoint template shows Step Plan which consists of 4 Stages. It can be used to to show grouped or related information.-PowerPoint Template Chart Steps Plan PPT Slides
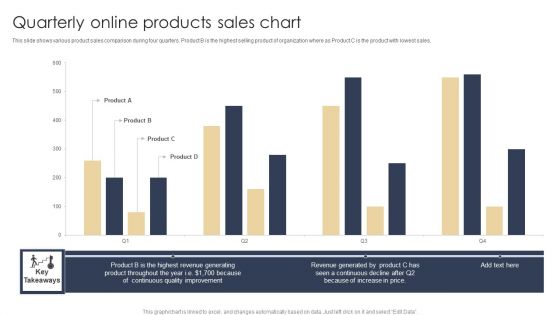
Quarterly Online Products Sales Chart Graphics PDF
This slide shows various product sales comparison during four quarters. Product B is the highest selling product of organization where as Product C is the product with lowest sales. Showcasing this set of slides titled Quarterly Online Products Sales Chart Graphics PDF. The topics addressed in these templates are Revenue Generated, Increase In Price, Quality. All the content presented in this PPT design is completely editable. Download it and make adjustments in color, background, font etc. as per your unique business setting.

Area Chart Ppt PowerPoint Presentation Summary Templates
This is a area chart ppt powerpoint presentation summary templates. This is a two stage process. The stages in this process are product, in percentage, bar graph, growth, business.
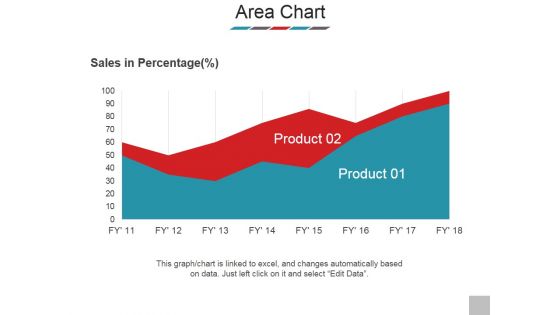
Area Chart Ppt PowerPoint Presentation Styles Images
This is a area chart ppt powerpoint presentation styles images. This is a two stage process. The stages in this process are sales in percentage, product, graph, business, marketing.

Column Chart Ppt PowerPoint Presentation Gallery Topics
This is a column chart ppt powerpoint presentation gallery topics. This is a two stage process. The stages in this process are dollars in thousands, product, business, marketing, strategy.

Line Chart Ppt PowerPoint Presentation Professional Smartart
This is a line chart ppt powerpoint presentation professional smartart. This is a two stage process. The stages in this process are in percentage, in years, product, finance, business.

Combo Chart Ppt PowerPoint Presentation Styles Good
This is a combo chart ppt powerpoint presentation styles good. This is a eight stage process. The stages in this process are market size, growth rate, product, growth, strategy, graph, finance.

PowerPoint Presentation Chart Four Results Ppt Theme
PowerPoint Presentation Chart Four Results PPT Theme-The Circle of Life - a concept emmbedded in our minds and hence easy to comprehend. Life and Business is made up of processes comprising stages that flow from one to another. An excellent graphic to attract the attention of and understanding by your audience to improve earnings.-These amazing PowerPoint pre-designed slides and PowerPoint templates have been carefully created by our team of experts to help you impress your audience. Our stunning collection of Powerpoint slides are 100% editable and can easily fit in any PowerPoint presentations. By using these animations and graphics in PowerPoint and you can easily make professional presentations. Any text can be entered at any point in the PowerPoint template or slide. Just DOWNLOAD our awesome PowerPoint templates and you are ready to go.
Column Chart Ppt PowerPoint Presentation Icon Show
This is a column chart ppt powerpoint presentation icon show. This is a two stage process. The stages in this process are column chart, product, years, bar graph, growth.
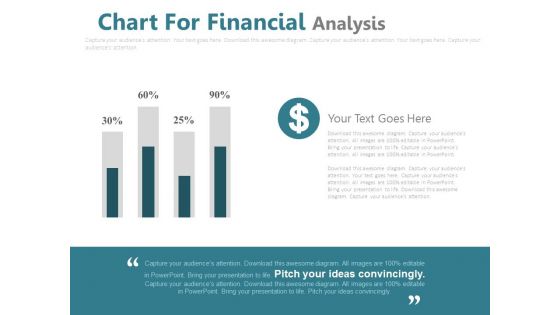
Chart For Financial Percentage Analysis Powerpoint Slides
This PowerPoint template has been designed with financial chart with dollar icon. This PPT slide may be used to display dollar value analysis chart. Download this slide to build unique presentation.
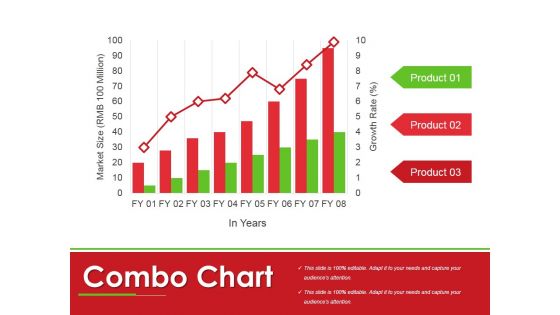
Combo Chart Ppt PowerPoint Presentation Portfolio Themes
This is a combo chart ppt powerpoint presentation portfolio themes. This is a three stage process. The stages in this process are market size, product, management, finance, chart, marketing.
Bubble Chart Ppt PowerPoint Presentation Icon Slides
This is a bubble chart ppt powerpoint presentation icon slides. This is a three stage process. The stages in this process are product, finance, business, marketing, bubble chart .
Area Chart Ppt PowerPoint Presentation Icon Show
This is a area chart ppt powerpoint presentation icon show. This is a two stage process. The stages in this process are product, financial year, in percentage, area chart.
Combo Chart Ppt PowerPoint Presentation Icon Introduction
This is a combo chart ppt powerpoint presentation icon introduction. This is a three stage process. The stages in this process are combo chart, product, growth rate, market size, growth.
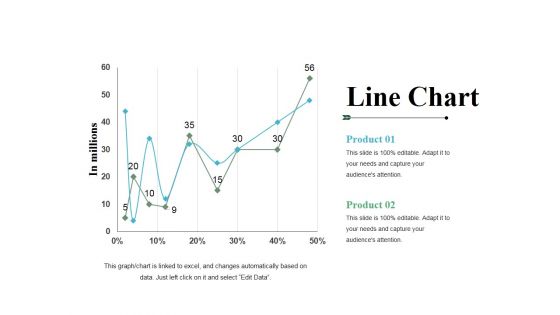
Line Chart Ppt PowerPoint Presentation File Templates
This is a line chart ppt powerpoint presentation file templates. This is a two stage process. The stages in this process are product, line chart, growth, percentage, in millions.

Line Chart Ppt PowerPoint Presentation Infographics Infographics
This is a line chart ppt powerpoint presentation infographics infographics. This is a two stage process. The stages in this process are product, sales in percentage, financial year, line chart, finance.
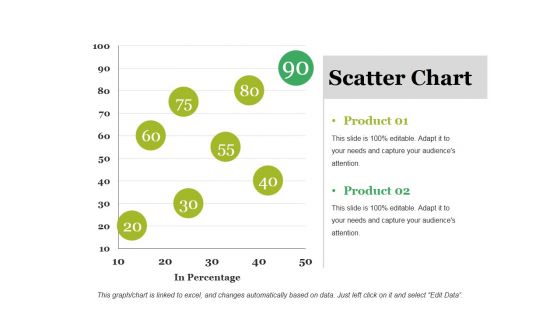
Scatter Chart Ppt PowerPoint Presentation Outline Ideas
This is a scatter chart ppt powerpoint presentation outline ideas. This is a two stage process. The stages in this process are product, scatter chart, business, in percentage, marketing.
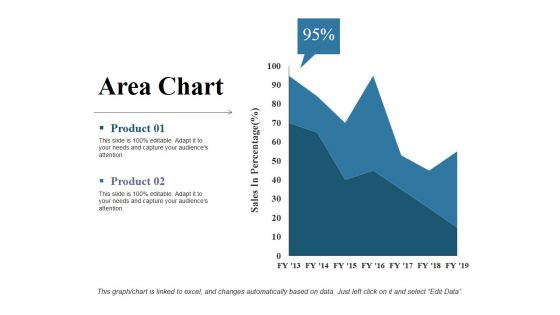
Area Chart Ppt PowerPoint Presentation Slides Example
This is a area chart ppt powerpoint presentation slides example. This is a two stage process. The stages in this process are sales in percentage, product, area chart, business, finance.

Line Chart Ppt PowerPoint Presentation Gallery Rules
This is a line chart ppt powerpoint presentation gallery rules. This is a two stage process. The stages in this process are financial years, product, sales in percentage, line chart, growth.
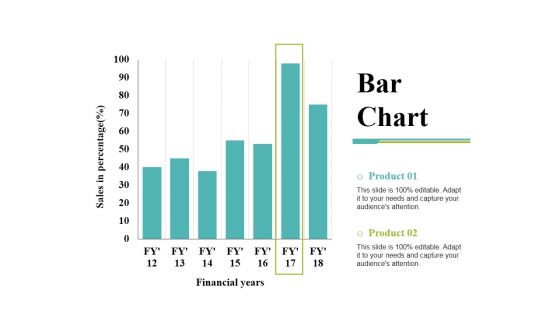
Bar Chart Ppt PowerPoint Presentation Inspiration Demonstration
This is a bar chart ppt powerpoint presentation inspiration demonstration. This is a two stage process. The stages in this process are bar chart, financial years, sales in percentage, product, finance.

Line Chart Ppt PowerPoint Presentation Gallery Templates
This is a line chart ppt powerpoint presentation gallery templates. This is a two stage process. The stages in this process are product, financial years, sales in percentage, line chart.

Bar Chart Ppt PowerPoint Presentation Model Picture
This is a bar chart ppt powerpoint presentation model picture. This is a two stage process. The stages in this process are product, sales in percentage, financial years, bar chart.
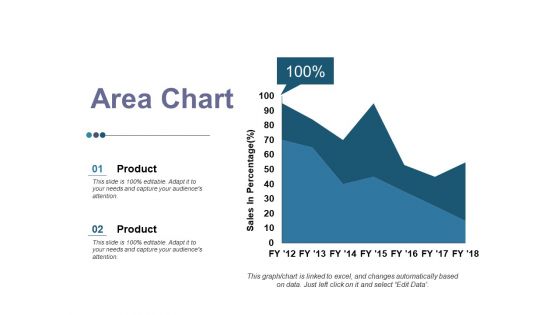
Area Chart Ppt PowerPoint Presentation Inspiration Graphics
This is a area chart ppt powerpoint presentation inspiration graphics. This is a two stage process. The stages in this process are product, area chart, business, growth, sales in percentage.

Clustered Chart Ppt PowerPoint Presentation Outline Templates
This is a clustered chart ppt powerpoint presentation outline templates. This is a three stage process. The stages in this process are product, in percentage, in years, clustered chart.

Column Chart Ppt PowerPoint Presentation Slides Show
This is a column chart ppt powerpoint presentation slides show. This is a two stage process. The stages in this process are column chart, product, sales in percentage, financial year, growth.

Line Chart Ppt PowerPoint Presentation Summary Ideas
This is a line chart ppt powerpoint presentation summary ideas. This is a two stage process. The stages in this process are line chart, profit, product, financial years, business.

Stacked Bar Chart Ppt PowerPoint Presentation Influencers
This is a stacked bar chart ppt powerpoint presentation influencers. This is a three stage process. The stages in this process are stacked bar chart, product, percentage, finance, business.

Pie Chart Ppt PowerPoint Presentation Ideas Designs
This is a pie chart ppt powerpoint presentation ideas designs. This is a six stage process. The stages in this process are pie chart, business, management, marketing, percentage, product.

PowerPoint Templates Marketing Arrows Chart Ppt Themes
PowerPoint Templates Marketing Arrows Chart PPT Themes-Explore the various directions and layers existing in your in your plans and processes. Unravel the desired and essential elements of your overall strategy. Explain the relevance of the different layers and stages and directions in getting down to your core competence, ability and desired result.-These amazing PowerPoint pre-designed slides and PowerPoint templates have been carefully created by our team of experts to help you impress your audience. Our stunning collection of Powerpoint slides are 100% editable and can easily fit in any PowerPoint presentations. By using these animations and graphics in PowerPoint and you can easily make professional presentations. Any text can be entered at any point in the PowerPoint template or slide. Just DOWNLOAD our awesome PowerPoint templates and you are ready to go.

PowerPoint Templates Growth Arrows Chart Ppt Designs
PowerPoint Templates Growth Arrows Chart PPT Designs-Explore the various directions and layers existing in your in your plans and processes. Unravel the desired and essential elements of your overall strategy. Explain the relevance of the different layers and stages and directions in getting down to your core competence, ability and desired result.-These amazing PowerPoint pre-designed slides and PowerPoint templates have been carefully created by our team of experts to help you impress your audience. Our stunning collection of Powerpoint slides are 100% editable and can easily fit in any PowerPoint presentations. By using these animations and graphics in PowerPoint and you can easily make professional presentations. Any text can be entered at any point in the PowerPoint template or slide. Just DOWNLOAD our awesome PowerPoint templates and you are ready to go.
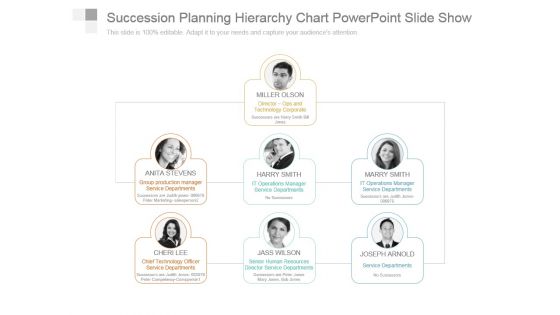
Succession Planning Hierarchy Chart Powerpoint Slide Show
This is a succession planning hierarchy chart powerpoint slide show. This is a three stage process. The stages in this process are miller olson director ops and technology corporate, anita stevens group production manager service departments, harry smith it operations manager service departments, marry smith it operations manager service departments, cheri lee chief technology officer service departments, jass wilson senior human resources director service departments, joseph arnold service departments.
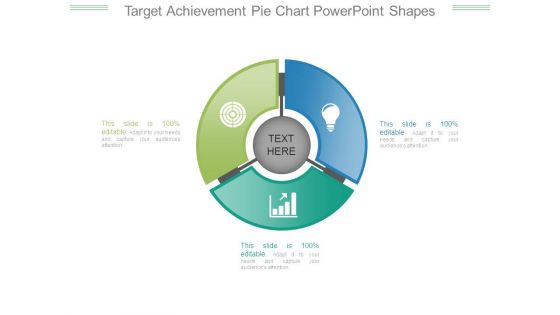
Target Achievement Pie Chart Powerpoint Shapes
This is a target achievement pie chart powerpoint shapes. This is a three stage process. The stages in this process are business, marketing, strategy, process, presentation.

Website Development Procedural Flow Chart Download PDF
This slide showcases website development process flow and demonstrates steps to be taken from start to finish to complete a typical web design project. It also includes various services, technologies, contacting sources, portfolios, products, etc. Persuade your audience using this Website Development Procedural Flow Chart Download PDF. This PPT design covers one stages, thus making it a great tool to use. It also caters to a variety of topics including Research, Client Training, Website Launch. Download this PPT design now to present a convincing pitch that not only emphasizes the topic but also showcases your presentation skills.

Cybersecurity Transformation Process Flow Chart Structure PDF
The following slide presents a process flow which can be utilized for implementing business transformation and modernization. The steps are related to design, optimize, implement, execute and monitor. Persuade your audience using this Cybersecurity Transformation Process Flow Chart Structure PDF. This PPT design covers Six stages, thus making it a great tool to use. It also caters to a variety of topics including Decide About Outsourcing, Review Risks, Establish Goals. Download this PPT design now to present a convincing pitch that not only emphasizes the topic but also showcases your presentation skills.
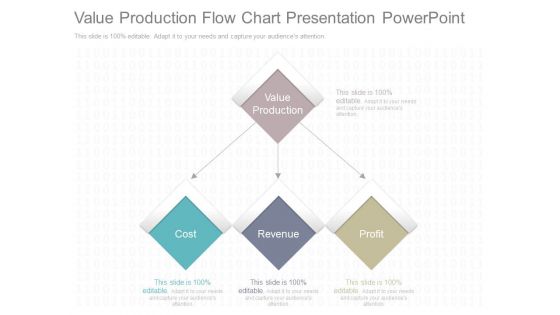
Value Production Flow Chart Presentation Powerpoint
This is a value production flow chart presentation powerpoint. This is a three stage process. The stages in this process are value production, cost, revenue, profit.
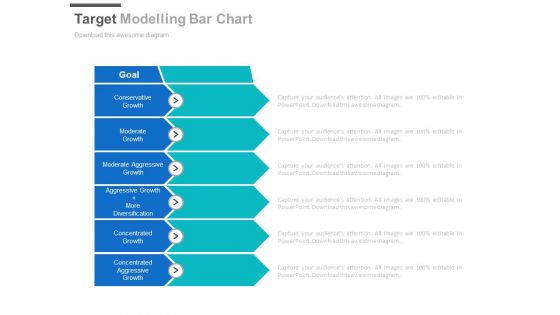
Target Modelling Bar Chart Ppt Slides
This is a target modelling bar chart ppt slides. This is a six stage process. The stages in this process are arrows, business, success.
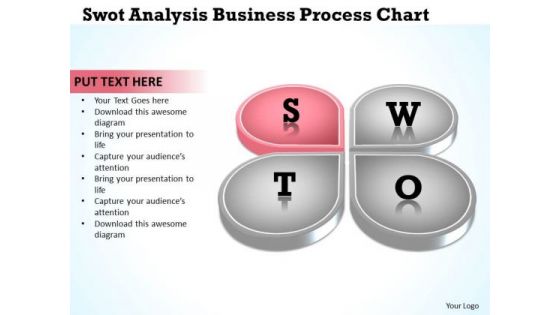
Business Flow Chart PowerPoint Presentations Process Slides
We present our business flow chart powerpoint presentations process Slides.Use our Advertising PowerPoint Templates because this PPt slide can educate your listeners on the relevance and importance of each one as per your plan and how they all contribute as you strive to hit the Bullseye. Present our Business PowerPoint Templates because the great Bald headed Eagle embodies your personality. the eagle eye to seize upon the smallest of opportunities. Download and present our Marketing PowerPoint Templates because that was the well known Musketeers call. Use our Finance PowerPoint Templates because you envisage some areas of difficulty in the near future. The overall financial situation could be a source of worry. Download and present our Shapes PowerPoint Templates because there is a key aspect to be emphasised.Use these PowerPoint slides for presentations relating to Analysis, Business, Concept, Design, Diagram, Direction, Goals, Guide, Icon, Idea, Management, Model, Opportunity, Organization, Performance, Plan, Process, Project, Representation, Resource, Strategy, Swot. The prominent colors used in the PowerPoint template are Blue, Black, Gray. PowerPoint presentation experts tell us our business flow chart powerpoint presentations process Slides are Perfect. Professionals tell us our Diagram PowerPoint templates and PPT Slides are Striking. People tell us our business flow chart powerpoint presentations process Slides are Appealing. We assure you our Icon PowerPoint templates and PPT Slides are Endearing. PowerPoint presentation experts tell us our business flow chart powerpoint presentations process Slides are Appealing. Professionals tell us our Direction PowerPoint templates and PPT Slides effectively help you save your valuable time.

Stock Chart Ppt PowerPoint Presentation Professional Objects
This is a stock chart ppt powerpoint presentation professional objects. This is a five stage process. The stages in this process are product, high, volume, low, open, close.

Area Chart Ppt PowerPoint Presentation Outline Objects
This is a area chart ppt powerpoint presentation outline objects. This is a two stage process. The stages in this process are product, sales in percentage, financial year.
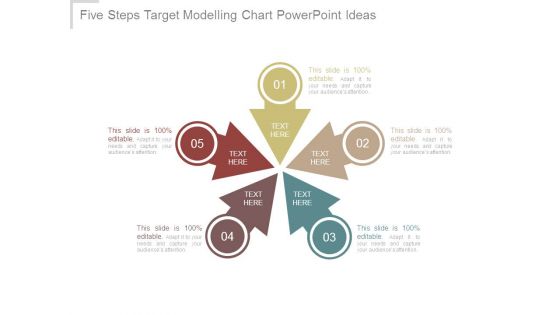
Five Steps Target Modelling Chart Powerpoint Ideas
This is a five steps target modelling chart powerpoint ideas. This is a five stage process. The stages in this process are business, process, marketing, arrows, management.
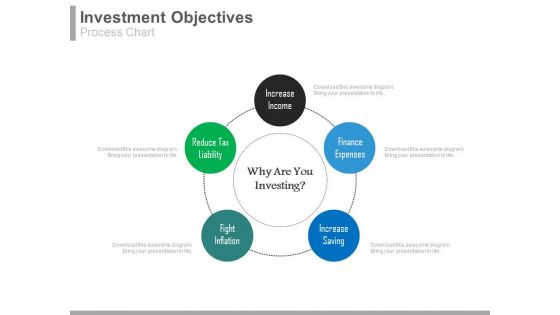
Investment Objectives Process Chart Ppt Slides
This is an investment objectives process chart ppt slides. This is a five stage process. The stages in this process are business, success, marketing.

 Home
Home