Goal Chart
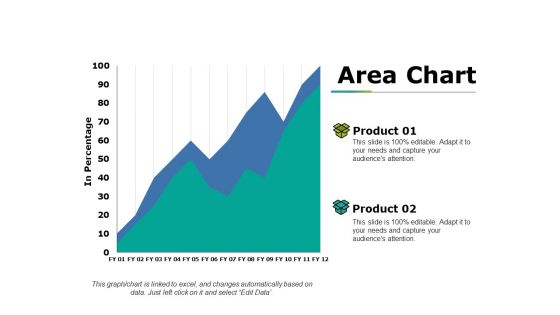
Area Chart Ppt PowerPoint Presentation Show Professional
This is a area chart ppt powerpoint presentation show professional. This is a two stage process. The stages in this process are product, in percentage, area chart, growth, success.

Line Chart Ppt PowerPoint Presentation Ideas Elements
This is a line chart ppt powerpoint presentation ideas elements. This is a two stage process. The stages in this process are product, sales in percentage, financial year, business, line chart.
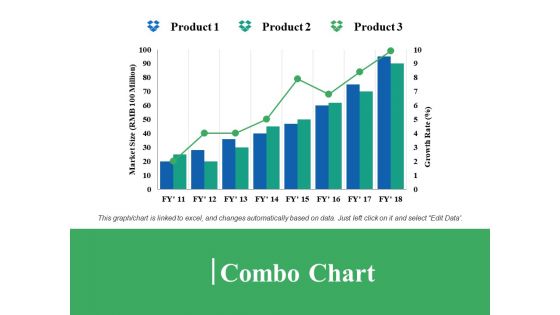
Combo Chart Ppt PowerPoint Presentation Model Microsoft
This is a combo chart ppt powerpoint presentation model microsoft. This is a three stage process. The stages in this process are combo chart, product, market size, growth rate.
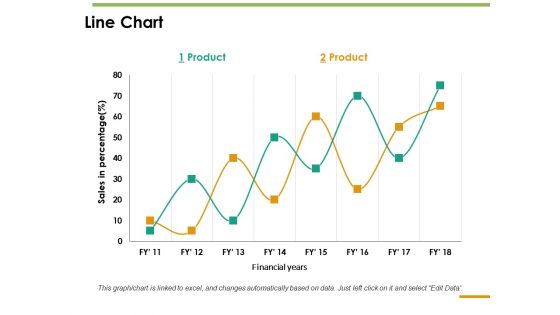
Line Chart Ppt PowerPoint Presentation Inspiration Guide
This is a line chart ppt powerpoint presentation inspiration guide. This is a two stage process. The stages in this process are line chart, sales in percentage, product, financial years.
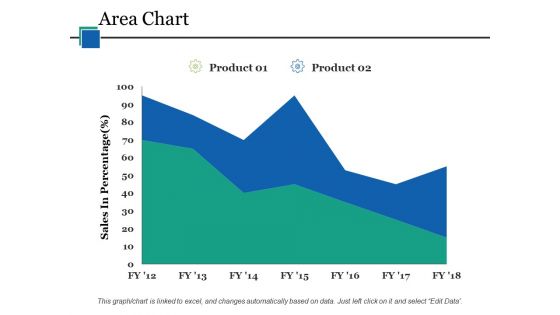
Area Chart Ppt PowerPoint Presentation Infographics Guide
This is a area chart ppt powerpoint presentation infographics guide. This is a two stage process. The stages in this process are area chart, product, sales in percentage, finance, business.

Combo Chart Ppt PowerPoint Presentation Slides Outline
This is a combo chart ppt powerpoint presentation slides outline. This is a three stage process. The stages in this process are combo chart, growth, product, financial year, business.

Scatter Bubble Chart Ppt PowerPoint Presentation Professional
This is a scatter bubble chart ppt powerpoint presentation professional. This is a three stage process. The stages in this process are scatter bubble chart, product, in price, percentage, business.

PowerPoint Design Round Chart Leadership Ppt Process
PowerPoint Design Round Chart Leadership PPT Process-Determine your targets and sequence them as per your priorities. Unravel each one for your audience while setting key timelines as you go along. Educate your listeners on the relevance and importance of each one as per your plan and how they all contribute as you strive to hit the Bullseye-PowerPoint Design Round Chart Leadership PPT Process-This ppt can be used for presentations relating to-3d, Angle, Arrow, Business, Chart, Circle, Complex, Concept, Data, Depth, Diagram, Dimensional, Financial, Graph, Graphic, Process

Line Chart Ppt Visual Aids Outline PDF
Deliver an awe-inspiring pitch with this creative line chart ppt visual aids outline pdf. bundle. Topics like line chart can be discussed with this completely editable template. It is available for immediate download depending on the needs and requirements of the user.
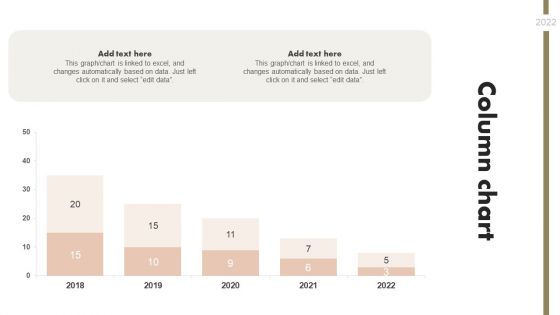
Organizational Transformation Column Chart Clipart PDF
Deliver and pitch your topic in the best possible manner with this Organizational Transformation Column Chart Clipart PDF. Use them to share invaluable insights on Column Chart and impress your audience. This template can be altered and modified as per your expectations. So, grab it now.
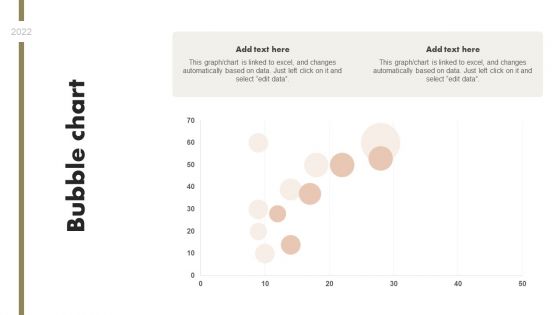
Organizational Transformation Bubble Chart Topics PDF
Deliver an awe inspiring pitch with this creative Organizational Transformation Bubble Chart Topics PDF bundle. Topics like Bubble chart can be discussed with this completely editable template. It is available for immediate download depending on the needs and requirements of the user.

PowerPoint Layouts Chart Circular Reasoning Ppt Themes
PowerPoint Layouts Chart Circular Reasoning PPT Themes-PowerPoint Slide Designs Teamwork Round Moving PPT Slide Designs-Explore the various directions and layers existing in your in your plans and processes. Unravel the desired and essential elements of your overall strategy. Explain the relevance of the different layers and stages and directions in getting down to your core competence, ability and desired result.-PowerPoint Layouts Chart Circular Reasoning PPT Themes
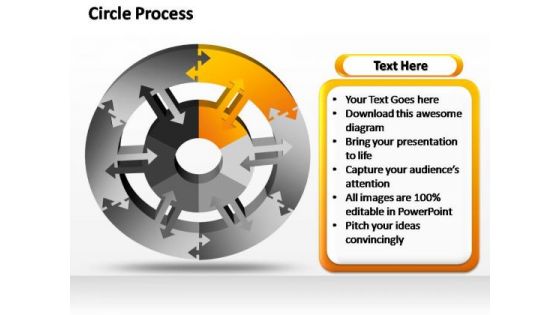
PowerPoint Layouts Chart Round Moving Ppt Template
PowerPoint Layouts Chart Round Moving PPT Template-PowerPoint Slide Designs Teamwork Round Moving PPT Slide Designs-Explore the various directions and layers existing in your in your plans and processes. Unravel the desired and essential elements of your overall strategy. Explain the relevance of the different layers and stages and directions in getting down to your core competence, ability and desired result.-PowerPoint Layouts Chart Round Moving PPT Template
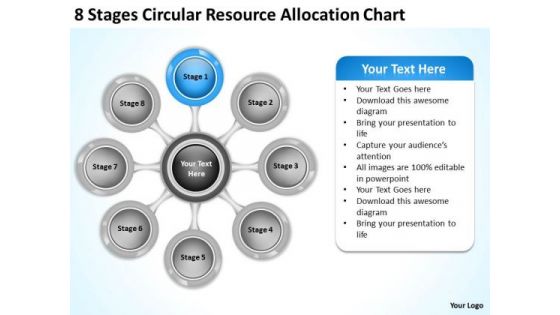
Business Strategy Implementation Resource Allocation Chart Internet
We present our business strategy implementation resource allocation chart internet.Use our Marketing PowerPoint Templates because You will get more than you ever bargained for. Use our Business PowerPoint Templates because Our PowerPoint Templates and Slides will let your words and thoughts hit bullseye everytime. Use our Circle Charts PowerPoint Templates because They will Put the wind in your sails. Skim smoothly over the choppy waters of the market. Download and present our Arrows PowerPoint Templates because Our PowerPoint Templates and Slides will bullet point your ideas. See them fall into place one by one. Present our Process and Flows PowerPoint Templates because Our PowerPoint Templates and Slides will definately Enhance the stature of your presentation. Adorn the beauty of your thoughts with their colourful backgrounds.Use these PowerPoint slides for presentations relating to 3d, Action, Analysis, Attitude, Brainstorming, Business, Chart, Classroom, Concept, Conceptual, Conference, Connection, Corporate, Design, Diagram, Direction, Element, Employee, Enhance, Financial, Formula, Future, Goal, Graphic, Guidelines, Idea, Link, Management, Market, Marketing, Mind, Mind Map, Organization, Organize, Plan, Process, Product, Relation, Render, Solutions, Strategy, Success, Successful, Tactic, Target, Text, Training, Unity. The prominent colors used in the PowerPoint template are Tan, Gray, Black.
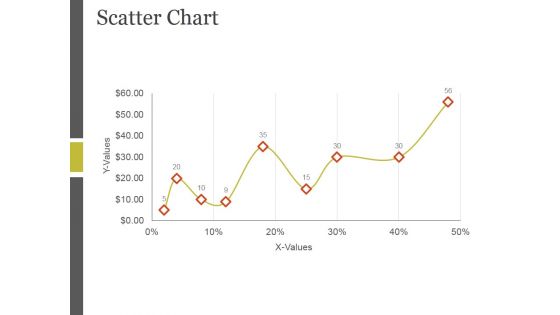
Scatter Chart Ppt PowerPoint Presentation Microsoft
This is a scatter chart ppt powerpoint presentation microsoft. This is a one stage process. The stages in this process are x values, scatter chart, bar graph, growth, business.
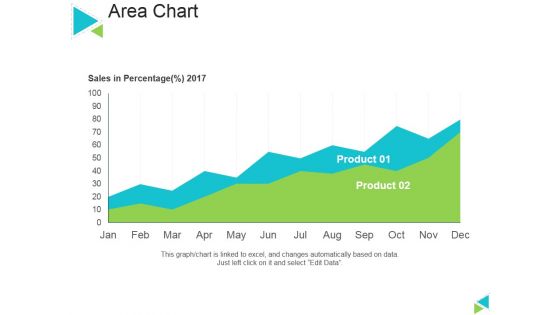
Area Chart Ppt PowerPoint Presentation Inspiration Themes
This is a area chart ppt powerpoint presentation inspiration themes. This is a two stage process. The stages in this process are sales in percentage, product, area chart, business, marketing.

Combo Chart Ppt PowerPoint Presentation Design Ideas
This is a combo chart ppt powerpoint presentation design ideas. This is a eight stage process. The stages in this process are market size, combo chart, in years, product, growth rate.

Combo Chart Ppt PowerPoint Presentation Infographics Summary
This is a combo chart ppt powerpoint presentation infographics summary. This is a three stage process. The stages in this process are market size, product, combo chart, years, business.
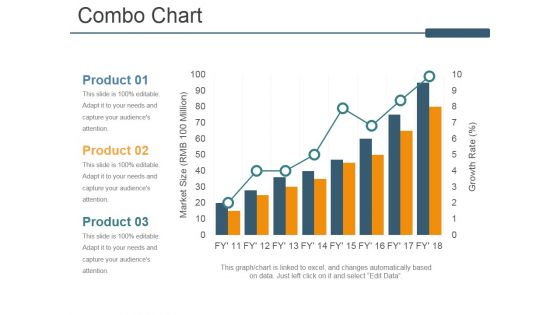
Combo Chart Ppt PowerPoint Presentation Layouts Portfolio
This is a combo chart ppt powerpoint presentation layouts portfolio. This is a three stage process. The stages in this process are combo chart, product, market size, growth rate.
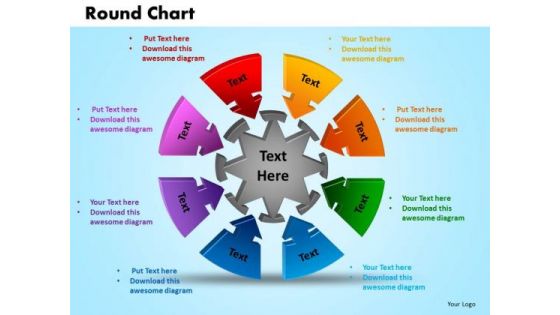
PowerPoint Theme Round Chart Marketing Ppt Slides
PowerPoint Theme Round Chart Marketing PPT Slides-This Diagram shows you the eight factors responsible for economic growth in Business .It can be used for creating Business presentations where four factors combined to result in one factor.-PowerPoint Theme Round Chart Marketing PPT Slides
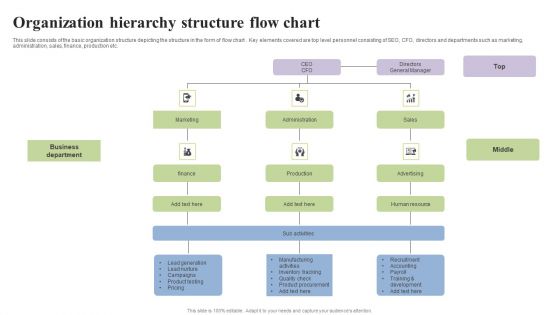
Organization Hierarchy Structure Flow Chart Slides PDF
This slide consists of the basic organization structure depicting the structure in the form of flow chart . Key elements covered are top level personnel consisting of SEO, CFO, directors and departments such as marketing, administration, sales, finance, production etc. Presenting Organization Hierarchy Structure Flow Chart Slides PDF to dispense important information. This template comprises one stages. It also presents valuable insights into the topics including Marketing, Business Department, Administration. This is a completely customizable PowerPoint theme that can be put to use immediately. So, download it and address the topic impactfully.
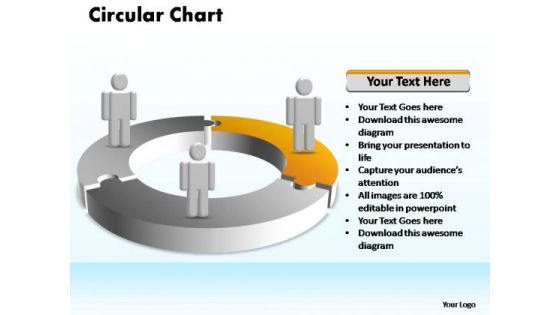
PowerPoint Design Slides Chart Circular Ppt Process
PowerPoint Design Slides Chart Circular PPT Process-Highlight the key components of your entire manufacturing/ business process. Illustrate how each element flows seamlessly onto the next stage. Emphasise on any critical or key factors within them. Demonstrate how they all combine to form the final product.-PowerPoint Design Slides Chart Circular PPT Process
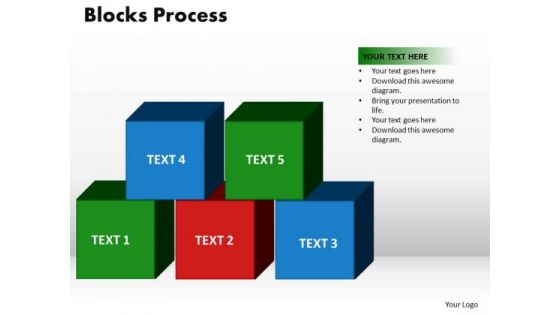
PowerPoint Theme Blocks Process Chart Ppt Backgrounds
PowerPoint Theme blocks process Chart PPT Backgrounds-Use this Diagram to show groups and sub-groups of information, or steps and sub-steps in a task, process, or workflow.-Achievement, action, activity, block, box, building, business, cartoon, challenge, concept, construction, cube, decisions, goal, human, idea, illustration, label, male, meeting, occupation, organization, partnership, people, person, process, progress, puppet, rendering, solution, stack, strategy, success, support, teamwork-PowerPoint Theme blocks process Chart PPT Backgrounds

Company Product Sales Forecast Chart Guidelines PDF
This slide shows the Product sales forecast table with Product names along with price per unit and total units sold for the current as well as the projected period till the year 2023 Deliver an awe inspiring pitch with this creative company product sales forecast chart guidelines pdf bundle. Topics like company product sales forecast chart can be discussed with this completely editable template. It is available for immediate download depending on the needs and requirements of the user.

Radar Chart Ppt PowerPoint Presentation Styles Objects
This is a radar chart ppt powerpoint presentation styles objects. This is a two stage process. The stages in this process are product radar chart, business, marketing, process.
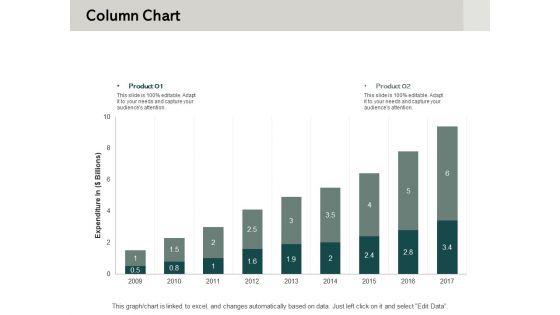
Column Chart Ppt PowerPoint Presentation Show Objects
This is a column chart ppt powerpoint presentation show objects. This is a two stage process. The stages in this process are percentage, product, business, management, marketing.
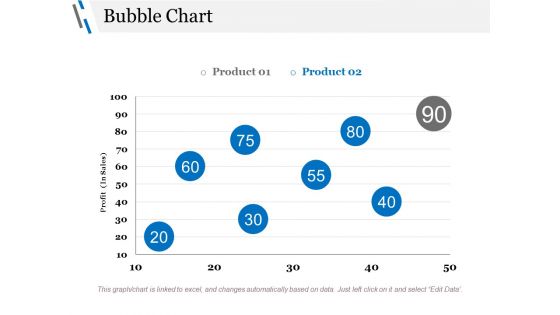
Bubble Chart Ppt PowerPoint Presentation Styles Objects
This is a bubble chart ppt powerpoint presentation styles objects. This is a two stage process. The stages in this process are profit, business, marketing, finance, chart.

Radar Chart Ppt PowerPoint Presentation Model Objects
This is a radar chart ppt powerpoint presentation model objects. This is a two stage process. The stages in this process are business, marketing, strategy, planning, finance.
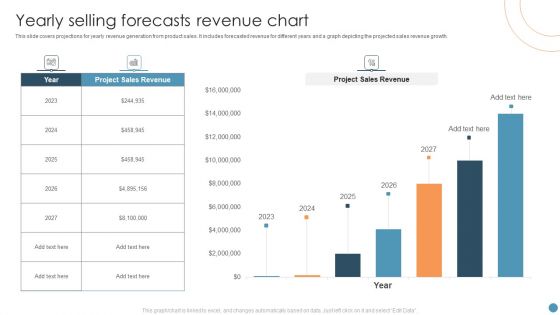
Yearly Selling Forecasts Revenue Chart Summary PDF
This slide covers projections for yearly revenue generation from product sales. It includes forecasted revenue for different years and a graph depicting the projected sales revenue growth. Showcasing this set of slides titled Yearly Selling Forecasts Revenue Chart Summary PDF. The topics addressed in these templates are Project Sales Revenue, Forecasts Revenue Chart. All the content presented in this PPT design is completely editable. Download it and make adjustments in color, background, font etc. as per your unique business setting.
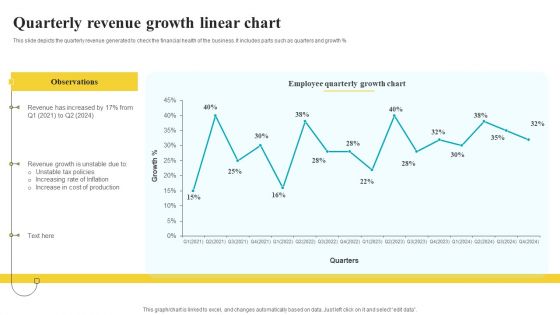
Quarterly Revenue Growth Linear Chart Elements PDF
This slide depicts the quarterly revenue generated to check the financial health of the business. It includes parts such as quarters and growth percent Showcasing this set of slides titled Quarterly Revenue Growth Linear Chart Elements PDF. The topics addressed in these templates are Observations, Growth Chart, Production. All the content presented in this PPT design is completely editable. Download it and make adjustments in color, background, font etc. as per your unique business setting.
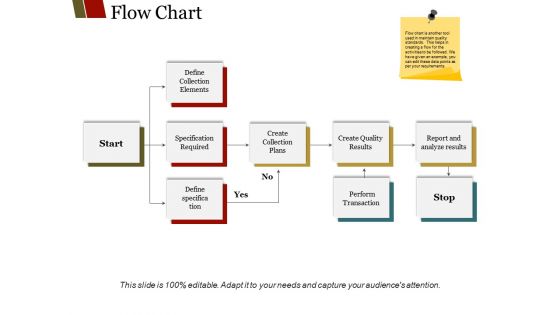
Flow Chart Ppt PowerPoint Presentation Infographic Template
This is a flow chart ppt powerpoint presentation infographic template. This is a four stage process. The stages in this process are define collection elements, specification required, create collection plans, create quality results, report and analyze results.

Scatter Chart Ppt PowerPoint Presentation Templates
This is a scatter chart ppt powerpoint presentation templates. This is a nine stage process. The stages in this process are product, values, business, marketing, growth, success.

PowerPoint Slide Chart Four Circular Ppt Template
PowerPoint Slide Chart Four Circular PPT Template-PowerPoint Slide Designs Teamwork Round Moving PPT Slide Designs-Explore the various directions and layers existing in your in your plans and processes. Unravel the desired and essential elements of your overall strategy. Explain the relevance of the different layers and stages and directions in getting down to your core competence, ability and desired result.-PowerPoint Slide Chart Four Circular PPT Template
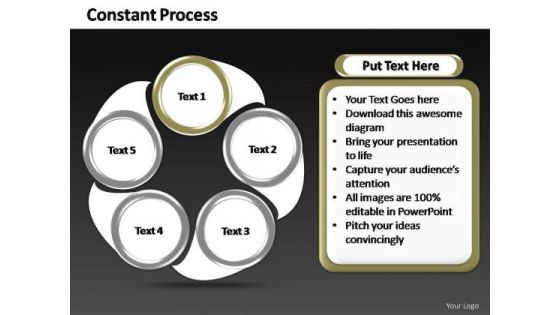
PowerPoint Slide Chart Constant Process Ppt Design
PowerPoint Slide Chart Constant Process PPT Design-PowerPoint Slide Designs Teamwork Round Moving PPT Slide Designs-Explore the various directions and layers existing in your in your plans and processes. Unravel the desired and essential elements of your overall strategy. Explain the relevance of the different layers and stages and directions in getting down to your core competence, ability and desired result.-PowerPoint Slide Chart Constant Process PPT Design
Scatter Chart Ppt PowerPoint Presentation Icon Inspiration
This is a scatter chart ppt powerpoint presentation icon inspiration. This is a one stage process. The stages in this process are chart, business, marketing, strategy, values.

Flow Chart Ppt PowerPoint Presentation Show Brochure
This is a flow chart ppt powerpoint presentation show brochure. This is a three stage process. The stages in this process are define collection elements, specification required, define specification, create collection plans, create quality results.
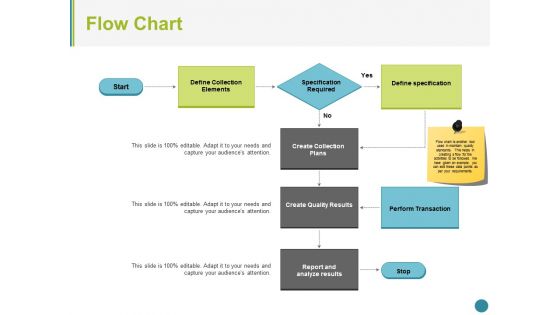
Flow Chart Ppt PowerPoint Presentation Model Skills
This is a Flow Chart Ppt PowerPoint Presentation Model Skills. This is a four stage process. The stages in this process are define collection elements, specification required, define specification, create collection plans, create quality results, perform transaction.
Bar Chart Ppt PowerPoint Presentation Infographics Icon
This is a bar chart ppt powerpoint presentation infographics icon. This is a three stage process. The stages in this process are product, bar graph, success, business, growth.

Bar Chart Ppt PowerPoint Presentation Model
This is a bar chart ppt powerpoint presentation model. This is a two stage process. The stages in this process are business, marketing, product, planning, management.
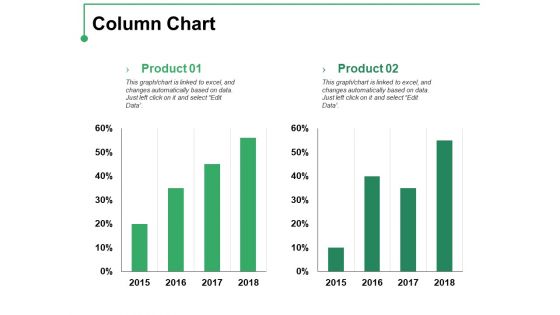
Column Chart Ppt PowerPoint Presentation Professional Template
This is a column chart ppt powerpoint presentation professional template. This is a two stage process. The stages in this process are product, percentage, finance, bar graph, growth.
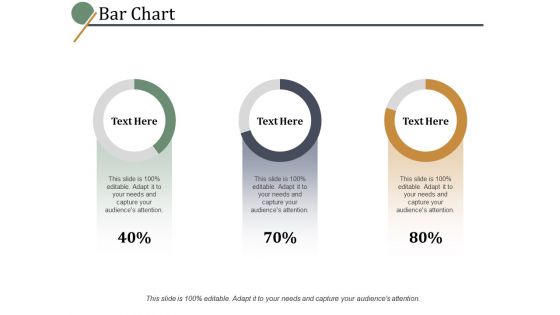
Bar Chart Ppt PowerPoint Presentation Professional Examples
This is a bar chart ppt powerpoint presentation professional examples. This is a four stage process. The stages in this process are percentage, marketing, management, product.

Bar Chart Ppt PowerPoint Presentation Show Deck
This is a bar chart ppt powerpoint presentation show deck. This is a two stage process. The stages in this process are percentage, product, business, marketing.
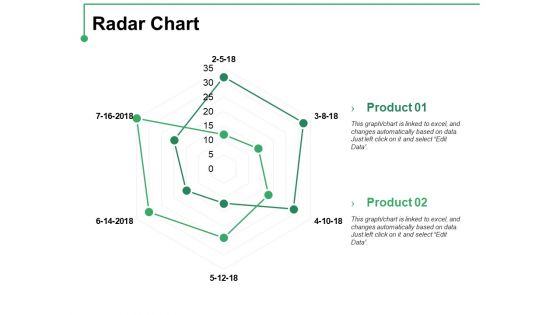
Radar Chart Ppt PowerPoint Presentation Pictures Themes
This is a radar chart ppt powerpoint presentation pictures themes. This is a two stage process. The stages in this process are product, radar chart, finance, business.
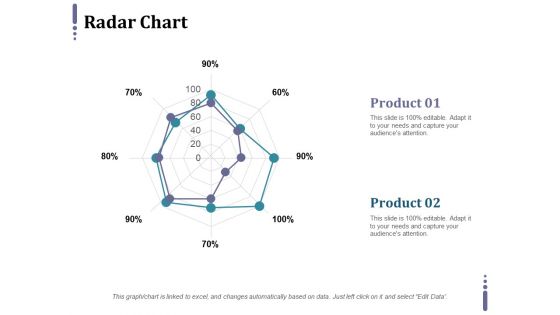
Radar Chart Ppt PowerPoint Presentation Styles Themes
This is a radar chart ppt powerpoint presentation styles themes. This is a two stage process. The stages in this process are product, finance, shape, radar chart, business.
Line Chart Ppt PowerPoint Presentation Ideas Icon
This is a line chart ppt powerpoint presentation ideas icon. This is a two stage process. The stages in this process are profit, product, line chart.
Area Chart Ppt PowerPoint Presentation Icon Gallery
This is a area chart ppt powerpoint presentation icon gallery. This is a two stage process. The stages in this process are sales in percentage, product, bar graph.
Line Chart Ppt PowerPoint Presentation Icon Example
This is a line chart ppt powerpoint presentation icon example. This is a two stage process. The stages in this process are products, profit, line chart, business, marketing.
Bubble Chart Ppt PowerPoint Presentation Pictures Icons
This is a bubble chart ppt powerpoint presentation pictures icons. This is a two stage process. The stages in this process are product, profit, bubble chart.
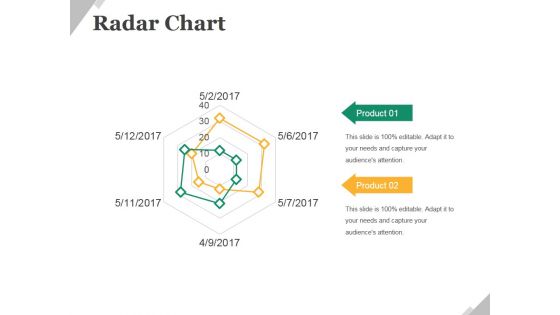
Radar Chart Ppt PowerPoint Presentation Portfolio Tips
This is a radar chart ppt powerpoint presentation portfolio tips. This is a two stage process. The stages in this process are radar chart, business, product, planning, strategy.

Bubble Chart Ppt PowerPoint Presentation Layouts Demonstration
This is a bubble chart ppt powerpoint presentation icon structure. This is a three stage process. The stages in this process are product, sales in percentage, bubble chart.

Radar Chart Ppt PowerPoint Presentation Styles
This is a radar chart ppt powerpoint presentation styles. This is a two stage process. The stages in this process are product, business, marketing, radar chart, process.

Pie Chart Ppt PowerPoint Presentation Gallery Styles
This is a pie chart ppt powerpoint presentation gallery styles. This is a five stage process. The stages in this process are pie chart, product.
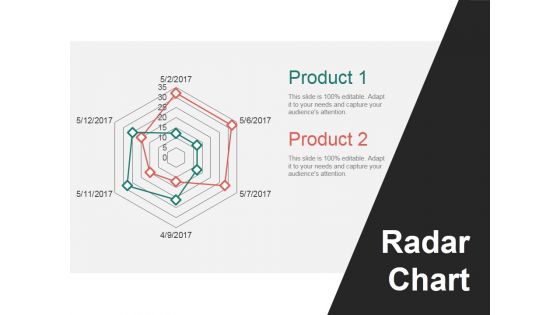
Radar Chart Ppt PowerPoint Presentation Outline Skills
This is a radar chart ppt powerpoint presentation outline skills. This is a two stage process. The stages in this process are product, radar chart, business, process, marketing.

Bubble Chart Ppt PowerPoint Presentation Slides Download
This is a bubble chart ppt powerpoint presentation slides download. This is a four stage process. The stages in this process are business, marketing, bubble chart, finance, product.

Pie Chart Ppt PowerPoint Presentation Styles Slideshow
This is a pie chart ppt powerpoint presentation styles slideshow. This is a five stage process. The stages in this process are pie chart, process, product, marketing, business.
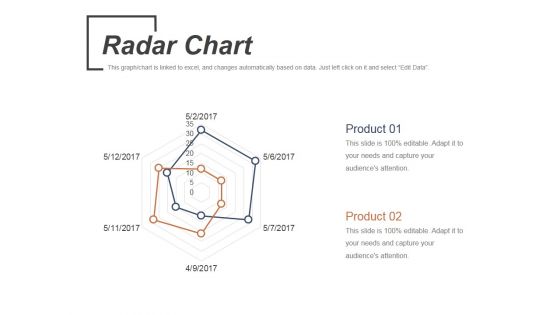
Radar Chart Ppt PowerPoint Presentation Gallery Picture
This is a radar chart ppt powerpoint presentation gallery picture. This is a two stage process. The stages in this process are product, radar chart, process, business, marketing.
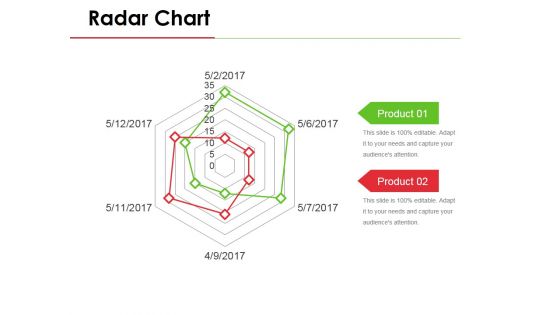
Radar Chart Ppt PowerPoint Presentation Styles Infographics
This is a radar chart ppt powerpoint presentation styles infographics. This is a six stage process. The stages in this process are business, marketing, product, radar chart, strategy.
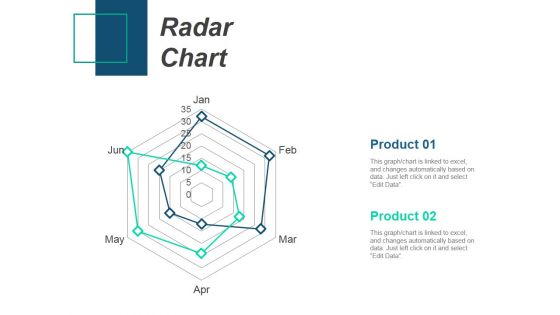
Radar Chart Ppt PowerPoint Presentation Templates
This is a radar chart ppt powerpoint presentation templates. This is a two stage process. The stages in this process are radar chart, product, business, process, success.

Column Chart Ppt PowerPoint Presentation Summary Maker
This is a column chart ppt powerpoint presentation summary maker. This is a two stage process. The stages in this process are business, marketing, product, bar graph, years.
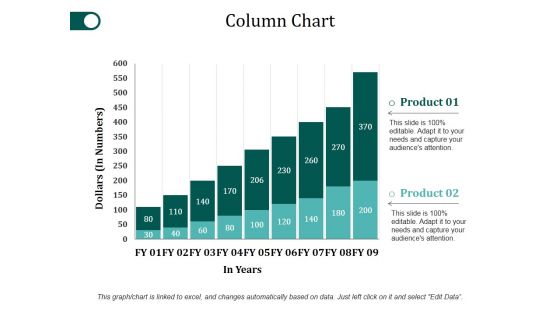
Column Chart Ppt PowerPoint Presentation Portfolio Clipart
This is a column chart ppt powerpoint presentation portfolio clipart. This is a two stage process. The stages in this process are bar graph, growth, success, product, dollars.

 Home
Home