Gauge Chart
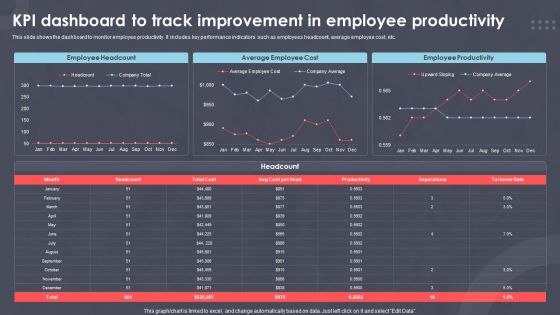
Kpi Dashboard To Track Improvement In Employee Productivity Ppt PowerPoint Presentation Outline Samples PDF
This slide shows the dashboard to monitor employee productivity. It includes key performance indicators such as employees headcount, average employee cost, etc.Showcasing this set of slides titled XXXXXXXXX. The topics addressed in these templates are Employee Headcount, Average Employee, Employee Productivity. All the content presented in this PPT design is completely editable. Download it and make adjustments in color, background, font etc. as per your unique business setting.
Shipping And Logistics Tracking Dashboard With Shipments And Fleet Status Pictures PDF
This slide covers Key performance indicators to track the automation system of the company. This dashboard includes Logistics Efficiency Status, delivery time accuracy etc. Deliver an awe inspiring pitch with this creative Shipping And Logistics Tracking Dashboard With Shipments And Fleet Status Pictures PDF bundle. Topics like Profit, Costs, Revenue can be discussed with this completely editable template. It is available for immediate download depending on the needs and requirements of the user.

Cloud Performance Tracking Dashboard Professional PDF
This slide covers the Key performance indicators for tracking performance of the cloud such as violations break down, sources, rules and severity. Deliver an awe inspiring pitch with this creative Cloud Performance Tracking Dashboard Professional PDF bundle. Topics like Cloud Performance, Tracking Dashboard can be discussed with this completely editable template. It is available for immediate download depending on the needs and requirements of the user.

Analyzing Impact Of Blockchain Iot On Major Kpis Formats PDF
This slide showcases impact analysis of blockchain internet of things IoT on key performance indicators KPIs. It provides information about efficiency, security, risk, costs, business models, revenue resources, etc. Deliver an awe inspiring pitch with this creative Analyzing Impact Of Blockchain Iot On Major Kpis Formats PDF bundle. Topics like Operational Efficiency, Information, Existing System can be discussed with this completely editable template. It is available for immediate download depending on the needs and requirements of the user.

KPI Dashboard To Measure Employee Growth Performance Rules PDF
This slides signifies the key performance indicator dashboard to evaluate employee development performance. It covers information about tickets solved, average resolution time and response time.Showcasing this set of slides titled KPI Dashboard To Measure Employee Growth Performance Rules PDF. The topics addressed in these templates are Documentation Tags, Search Refinements, Full Resolution. All the content presented in this PPT design is completely editable. Download it and make adjustments in color, background, font etc. as per your unique business setting.

Project KPI Dashboard To Monitor Financial Budget Evaluation Demonstration PDF
This slide signifies the key performance indicator dashboard to evaluate financial estimation. It covers information regarding to expense, payable account and monthly performance. Showcasing this set of slides titled Project KPI Dashboard To Monitor Financial Budget Evaluation Demonstration PDF. The topics addressed in these templates are Project KPI Dashboard, Monitor Financial Budget Evaluation. All the content presented in this PPT design is completely editable. Download it and make adjustments in color, background, font etc. as per your unique business setting.

KPI Dashboard To Track Enterprise Information Protection Topics PDF
This slide shows key performance indicator dashboard which can be used by organizations to monitor business information protection. It includes metrics such as compliance, project protection, stimulating projects, etc. Showcasing this set of slides titled KPI Dashboard To Track Enterprise Information Protection Topics PDF. The topics addressed in these templates are Security Projects, Projects Sustainability, Services. All the content presented in this PPT design is completely editable. Download it and make adjustments in color, background, font etc. as per your unique business setting.

Performance Strategic Analysis Dashboard For Tactical Management Rules PDF
This slide defines the dashboard for analyzing the sales key performance indicators KPIs. It includes information related to the number of sales, revenue, profit, and cost. Showcasing this set of slides titled Performance Strategic Analysis Dashboard For Tactical Management Rules PDF. The topics addressed in these templates are Revenue, New Customers, Average Revenue, Per Customer. All the content presented in this PPT design is completely editable. Download it and make adjustments in color, background, font etc. as per your unique business setting.
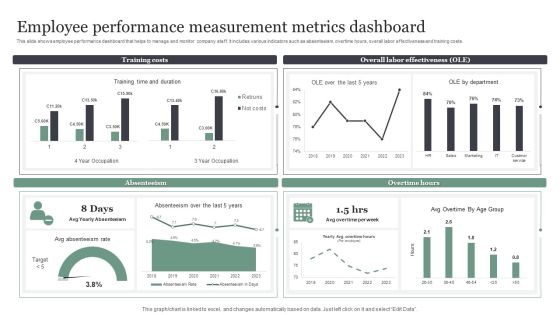
Employee Performance Measurement Metrics Dashboard Brochure PDF
This slide shows employee performance dashboard that helps to manage and monitor company staff. It includes various indicators such as absenteeism, overtime hours, overall labor effectiveness and training costs. Showcasing this set of slides titled Employee Performance Measurement Metrics Dashboard Brochure PDF. The topics addressed in these templates are Training Costs, Overall Labor Effectiveness. All the content presented in this PPT design is completely editable. Download it and make adjustments in color, background, font etc. as per your unique business setting.
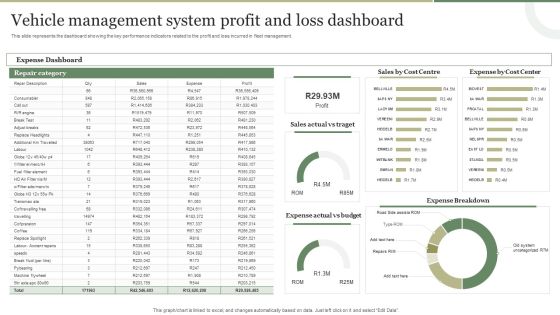
Vehicle Management System Profit And Loss Dashboard Brochure PDF
This slide represents the dashboard showing the key performance indicators related to the profit and loss incurred in fleet management. Showcasing this set of slides titled Vehicle Management System Profit And Loss Dashboard Brochure PDF. The topics addressed in these templates are Vehicle Management System, Profit And Loss Dashboard. All the content presented in this PPT design is completely editable. Download it and make adjustments in color, background, font etc. as per your unique business setting.

Campus Recruitment Workforce Report Dashboard Guidelines PDF
This slide showcases HR report and talent tracking dashboard. It provides information about headcount, performers, leavers, joiners, promotions, campus hires, managed, etc. Showcasing this set of slides titled Campus Recruitment Workforce Report Dashboard Guidelines PDF. The topics addressed in these templates are Recruitment, Cost, Key Performance Indicators. All the content presented in this PPT design is completely editable. Download it and make adjustments in color, background, font etc. as per your unique business setting.
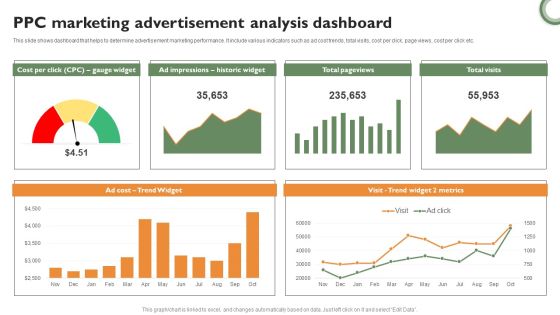
PPC Marketing Advertisement Analysis Dashboard Background PDF
This slide shows dashboard that helps to determine advertisement marketing performance. It include various indicators such as ad cost trends, total visits, cost per click, page views, cost per click etc. Showcasing this set of slides titled PPC Marketing Advertisement Analysis Dashboard Background PDF. The topics addressed in these templates are PPC Marketing, Advertisement Analysis Dashboard. All the content presented in this PPT design is completely editable. Download it and make adjustments in color, background, font etc. as per your unique business setting.

KPI Dashboard To Measure Sales Divisional Strategy Growth Formats PDF
This slide signifies the key performance indicator to measure sales department strategy growth. It covers information regarding to the units sold, top 10 project, target per agent. Showcasing this set of slides titled KPI Dashboard To Measure Sales Divisional Strategy Growth Formats PDF. The topics addressed in these templates are Sales, Target. All the content presented in this PPT design is completely editable. Download it and make adjustments in color, background, font etc. as per your unique business setting.
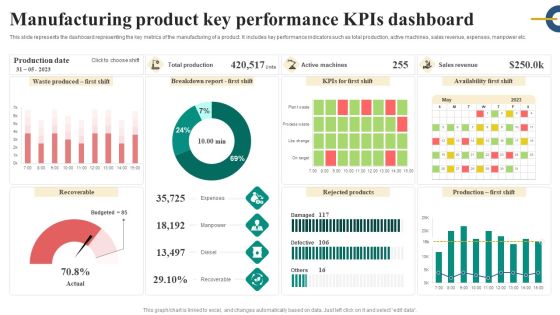
Manufacturing Product Key Performance Kpis Dashboard Inspiration PDF
This slide represents the dashboard representing the key metrics of the manufacturing of a product. It includes key performance indicators such as total production, active machines, sales revenue, expenses, manpower etc. Showcasing this set of slides titled Manufacturing Product Key Performance Kpis Dashboard Inspiration PDF. The topics addressed in these templates are Expenses, Manpower, Diesel, Recoverable. All the content presented in this PPT design is completely editable. Download it and make adjustments in color, background, font etc. as per your unique business setting.
KPI Dashboard Of Client Support Icons PDF
This slide shows customer service delivery key performance indicators dashboard. It includes KPIs such as issues received, average time to close issues, first call resolution, top performers, etc. Pitch your topic with ease and precision using this KPI Dashboard Of Client Support Icons PDF. This layout presents information on KPI Dashboard, Client Support. It is also available for immediate download and adjustment. So, changes can be made in the color, design, graphics or any other component to create a unique layout.

Company Performance Of Construction Company With Key Insights Portrait PDF
This slide showcases the construction companys performance on various areas. It include cost, time, quality and safety management, cash flow indicator etc. Pitch your topic with ease and precision using this company performance of construction company with key insights portrait pdf. This layout presents information on performance, management. It is also available for immediate download and adjustment. So, changes can be made in the color, design, graphics or any other component to create a unique layout.

Corporate Earnings And Risk Metrics Dashboard Guidelines PDF
This slide illustrates graphical representation of risk key performance indicators. It includes financial risks, operational risk and risk expenditure etc. Pitch your topic with ease and precision using this Corporate Earnings And Risk Metrics Dashboard Guidelines PDF. This layout presents information on Financial Risk, Operational Risk Expenditure. It is also available for immediate download and adjustment. So, changes can be made in the color, design, graphics or any other component to create a unique layout.

Insurance Business Model Of Healthcare Insurance Industry Dashboard Slides PDF
Following slide showcases the dashboard of healthcare insurance industrys claim model. It indicates the no. of claims paid, rejections, trends of claims paid etc.Pitch your topic with ease and precision using this Insurance Business Model Of Healthcare Insurance Industry Dashboard Slides PDF This layout presents information on Rejections, Reimbursement, Account Payable It is also available for immediate download and adjustment. So, changes can be made in the color, design, graphics or any other component to create a unique layout.
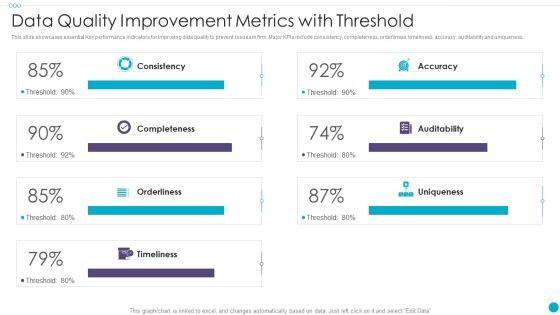
Data Quality Improvement Metrics With Threshold Formats PDF
This slide showcases essential Key performance indicators for improving data quality to prevent issues in firm. Major KPIs include consistency, completeness, orderliness, timeliness, accuracy, auditability and uniqueness. Pitch your topic with ease and precision using this Data Quality Improvement Metrics With Threshold Formats PDF This layout presents information on Auditability, Completeness, Consistency It is also available for immediate download and adjustment. So, changes can be made in the color, design, graphics or any other component to create a unique layout.

Communication Barriers Manager Dashboard For Analyzing Ppt PowerPoint Presentation Inspiration Grid PDF
This slide represents the dashboard of communication manager. It includes KPIs such as current conversation, performance, customers and opportunities.Pitch your topic with ease and precision using this Communication Barriers Manager Dashboard For Analyzing Ppt PowerPoint Presentation Inspiration Grid PDF. This layout presents information on Current Conversation, Economic Indicator, Conversation Calls. It is also available for immediate download and adjustment. So, changes can be made in the color, design, graphics or any other component to create a unique layout.
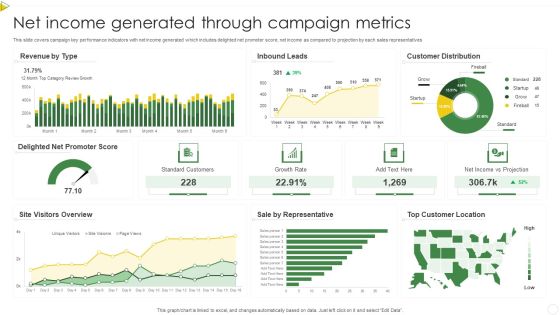
Net Income Generated Through Campaign Metrics Summary PDF
This slide covers campaign key performance indicators with net income generated which includes delighted net promoter score, net income as compared to projection by each sales representatives. Pitch your topic with ease and precision using this Net Income Generated Through Campaign Metrics Summary PDF. This layout presents information on Standard Customers, Growth Rate, Net Income. It is also available for immediate download and adjustment. So, changes can be made in the color, design, graphics or any other component to create a unique layout.

Software Market Penetration KPI Dashboard Ppt Outline Aids PDF
This slide shows market penetration key performance indicator KPI dashboard for software sector. It provides information about growth rate, portfolio, platform, applications, services, on premises, cloud, etc. Pitch your topic with ease and precision using this Software Market Penetration KPI Dashboard Ppt Outline Aids PDF. This layout presents information on Market Size, Global Market, Cloud. It is also available for immediate download and adjustment. So, changes can be made in the color, design, graphics or any other component to create a unique layout.
Email Marketing Campaign Kpis Tracking Dashboard Graphics PDF
This slide shows key performance indicators KPI dashboard for measuring effectiveness of email campaigns. It provides information about sent, delivered, opens, clicks, unsubscribed, bounces, complaints, etc. Pitch your topic with ease and precision using this Email Marketing Campaign Kpis Tracking Dashboard Graphics PDF. This layout presents information on Email Marketing Campaign, Tracking Dashboard. It is also available for immediate download and adjustment. So, changes can be made in the color, design, graphics or any other component to create a unique layout.

Internal Audit Metrics Dashboard And Status Ppt Layouts Graphic Images PDF
This slide covers the key performance indicator dashboard and status for internal audit. It includes information related to the audit status and risk rating. Pitch your topic with ease and precision using this Internal Audit Metrics Dashboard And Status Ppt Layouts Graphic Images PDF. This layout presents information on Audit Status, Risk Rating, Auditable Entry. It is also available for immediate download and adjustment. So, changes can be made in the color, design, graphics or any other component to create a unique layout.
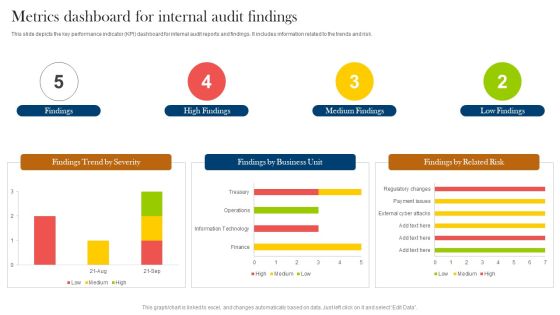
Metrics Dashboard For Internal Audit Findings Ppt Styles Gallery PDF
This slide depicts the key performance indicator KPI dashboard for internal audit reports and findings. It includes information related to the trends and risk. Pitch your topic with ease and precision using this Metrics Dashboard For Internal Audit Findings Ppt Styles Gallery PDF. This layout presents information on Findings, High Findings, Medium Findings, Low Findings. It is also available for immediate download and adjustment. So, changes can be made in the color, design, graphics or any other component to create a unique layout.
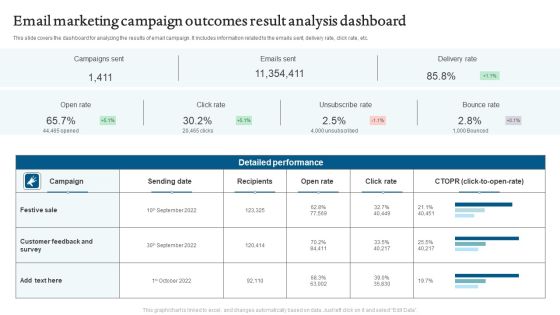
Email Marketing Campaign Outcomes Result Analysis Dashboard Mockup PDF
This slide covers the dashboard for analyzing the email campaign metrics. It includes information related to engagement a key performance indicator KPIs. Pitch your topic with ease and precision using this Email Marketing Campaign Outcomes Result Analysis Dashboard Mockup PDF. This layout presents information on Campaigns Sent, Emails Sent, Delivery Rate. It is also available for immediate download and adjustment. So, changes can be made in the color, design, graphics or any other component to create a unique layout.

Client Support KPI Dashboard Rules PDF
This slide shows key performance indicators of customer service delivery. It includes service level, request volume, cost of revenue, customer satisfaction, customer retention, etc. Pitch your topic with ease and precision using this Client Support KPI Dashboard Rules PDF. This layout presents information on Customer Retention, Cost Per Support, Average Issue Solving Time. It is also available for immediate download and adjustment. So, changes can be made in the color, design, graphics or any other component to create a unique layout.

Client Support Management Dashboard Designs PDF
This slide shows KPI dashboard of customer service delivery management. It includes key performance indicators such as total support requests received, support status, total solved and unsolved issues, etc. Pitch your topic with ease and precision using this Client Support Management Dashboard Designs PDF. This layout presents information on Client Support, Management Dashboard. It is also available for immediate download and adjustment. So, changes can be made in the color, design, graphics or any other component to create a unique layout.
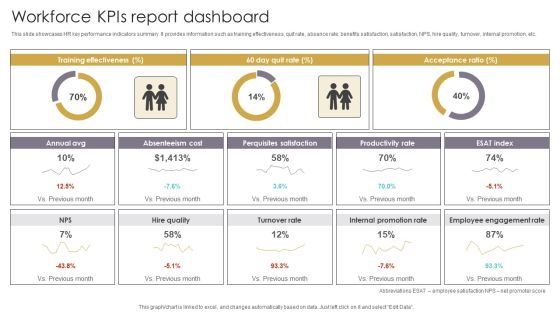
Workforce Kpis Report Dashboard Slides PDF
This slide showcases HR key performance indicators summary. It provides information such as training effectiveness, quit rate, absence rate, benefits satisfaction, satisfaction, NPS, hire quality, turnover, internal promotion, etc. Pitch your topic with ease and precision using this Workforce Kpis Report Dashboard Slides PDF. This layout presents information on Acceptance Ratio, Absenteeism Cost, Perquisites Satisfaction. It is also available for immediate download and adjustment. So, changes can be made in the color, design, graphics or any other component to create a unique layout.
Project Management Tracking Dashboard To Review Decision Download PDF
The below slide depicts the key performing indicators in project decision making. It includes elements such as overall status, progress, progress, time, cost and work volume. Pitch your topic with ease and precision using this Project Management Tracking Dashboard To Review Decision Download PDF. This layout presents information on Progress, Activity Status, Overall Status. It is also available for immediate download and adjustment. So, changes can be made in the color, design, graphics or any other component to create a unique layout.
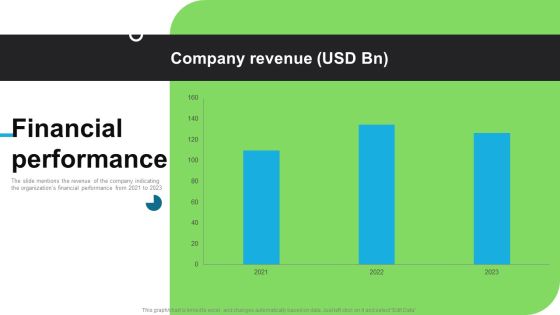
E Commerce Company Investor Funding Elevator Pitch Deck Financial Performance Microsoft PDF
The slide mentions the revenue of the company indicating the organizations financial performance from 2021 to 2023. Make sure to capture your audiences attention in your business displays with our gratis customizable E Commerce Company Investor Funding Elevator Pitch Deck Financial Performance Microsoft PDF. These are great for business strategies, office conferences, capital raising or task suggestions. If you desire to acquire more customers for your tech business and ensure they stay satisfied, create your own sales presentation with these plain slides.
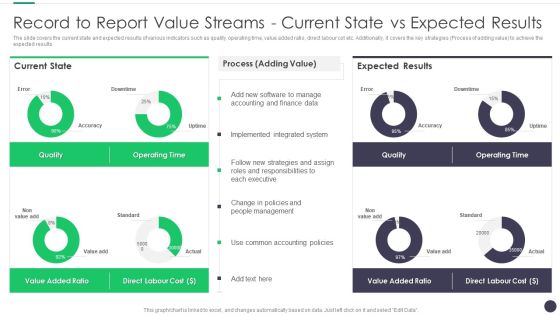
Finance And Accounting Online Conversion Plan Record To Report Value Streams Mockup PDF
The slide covers the current state and expected results of various indicators such as quality, operating time, value added ratio, direct labour cot etc. Additionally, it covers the key strategies Process of adding value to achieve the expected results. Deliver an awe inspiring pitch with this creative Finance And Accounting Online Conversion Plan Record To Report Value Streams Mockup PDF bundle. Topics like Operating Time, Process, Expected Results can be discussed with this completely editable template. It is available for immediate download depending on the needs and requirements of the user.
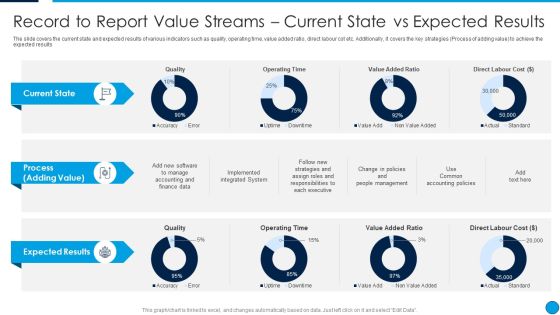
Summary Financial Record To Report Value Streams Current State Vs Expected Results Template PDF
The slide covers the current state and expected results of various indicators such as quality, operating time, value added ratio, direct labour cot etc. Additionally, it covers the key strategies Process of adding value to achieve the expected results. Deliver an awe inspiring pitch with this creative Summary Financial Record To Report Value Streams Current State Vs Expected Results Template PDF bundle. Topics like Current State, Process, Adding Value, Expected Results, Operating Time, Value Added Ratio can be discussed with this completely editable template. It is available for immediate download depending on the needs and requirements of the user.
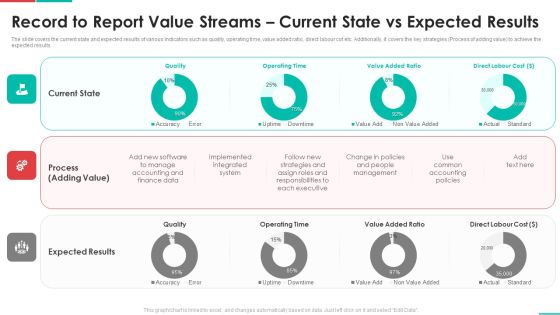
Roadmap For Financial Accounting Transformation Record To Report Value Streams Current State Professional PDF
The slide covers the current state and expected results of various indicators such as quality, operating time, value added ratio, direct labour cot etc. Additionally, it covers the key strategies Process of adding value to achieve the expected results. Deliver and pitch your topic in the best possible manner with this roadmap for financial accounting transformation record to report value streams current state professional pdf. Use them to share invaluable insights on current state, process, expected results and impress your audience. This template can be altered and modified as per your expectations. So, grab it now.
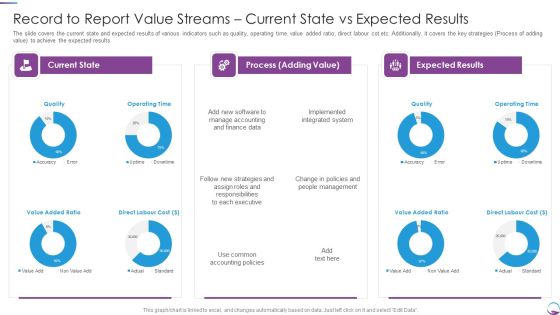
Record To Report Value Streams Current State Vs Expected Results Professional PDF
The slide covers the current state and expected results of various indicators such as quality, operating time, value added ratio, direct labour cot etc. Additionally, it covers the key strategies Process of adding value to achieve the expected results. Deliver and pitch your topic in the best possible manner with this Record To Report Value Streams Current State Vs Expected Results Professional PDF. Use them to share invaluable insights on Management, Strategies, Executive, Finance Data and impress your audience. This template can be altered and modified as per your expectations. So, grab it now.

Bar Graph Representing Macroeconomic Analysis Employment Change By Industry Background PDF
This slide focuses on the graphical presentation of macroeconomic indicator such as employment rate of different industries which includes service providing and goods producing industries which includes healthcare and social assistance, construction, manufacturing industry, etc. Pitch your topic with ease and precision using this Bar Graph Representing Macroeconomic Analysis Employment Change By Industry Background PDF. This layout presents information on Goods Producing, Service Providing, Financial, Business. It is also available for immediate download and adjustment. So, changes can be made in the color, design, graphics or any other component to create a unique layout.

Effective Sales Plan For New Product Introduction In Market Annual Sales Highlights Template PDF
Mentioned slide displays annual sales performance highlight of the firm in US region. It also portrays sales performance stats of that firm in FY2020 recorded low sales in South and Northeast America. Deliver an awe inspiring pitch with this creative Effective Sales Plan For New Product Introduction In Market Annual Sales Highlights Template PDF bundle. Topics like Sales Performance, Graph Indicates, Key Takeaways can be discussed with this completely editable template. It is available for immediate download depending on the needs and requirements of the user.
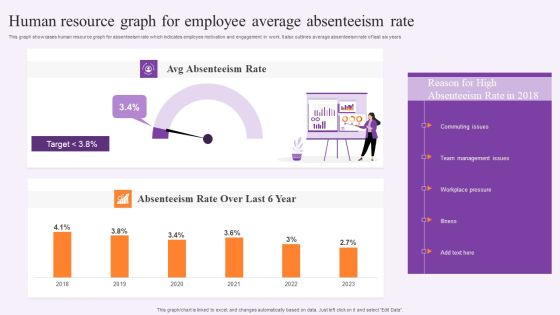
Human Resource Graph For Employee Average Absenteeism Rate Information PDF
This graph showcases human resource graph for absenteeism rate which indicates employee motivation and engagement in work. It also outlines average absenteeism rate of last six years. Showcasing this set of slides titled Human Resource Graph For Employee Average Absenteeism Rate Information PDF. The topics addressed in these templates are Team Management Issues, Workplace Pressure, Absenteeism Rate. All the content presented in this PPT design is completely editable. Download it and make adjustments in color, background, font etc. as per your unique business setting.

Dashboard To Analyse Effectiveness Of Promotions Execution Plan Diagrams PDF
This slide depicts analysis dashboard for tracking marketing activities with implementations and continuously updates data so businesses can track the marketing effectiveness. The various key performing indicators are cost, conversions and channel performance. Showcasing this set of slides titled Dashboard To Analyse Effectiveness Of Promotions Execution Plan Diagrams PDF. The topics addressed in these templates are Channel Performance, Cost, Conversions. All the content presented in this PPT design is completely editable. Download it and make adjustments in color, background, font etc. as per your unique business setting.

Sandbox VR Venture Capital Financing Pitch Deck Adoption Has Been Disappointing Information PDF
This slide illustrates the statistics about the interest of users towards virtual reality. Here the bar graph indicates that adoption of VR headsets was only five millions in comparison to Console installed base. Deliver an awe inspiring pitch with this creative sandbox vr venture capital financing pitch deck adoption has been disappointing information pdf bundle. Topics like adoption has been disappointing can be discussed with this completely editable template. It is available for immediate download depending on the needs and requirements of the user.
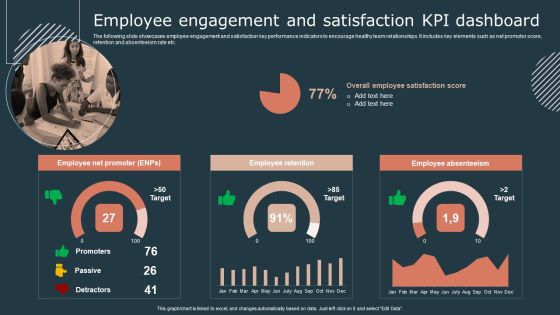
Effective Workforce Participation Action Planning Employee Engagement And Satisfaction Kpi Dashboard Themes PDF
The following slide showcases employee engagement and satisfaction key performance indicators to encourage healthy team relationships. It includes key elements such as net promotor score, retention and absenteeism rate etc. From laying roadmaps to briefing everything in detail, our templates are perfect for you. You can set the stage with your presentation slides. All you have to do is download these easy to edit and customizable templates. Effective Workforce Participation Action Planning Employee Engagement And Satisfaction Kpi Dashboard Themes PDF will help you deliver an outstanding performance that everyone would remember and praise you for. Do download this presentation today.

PMI Agile Certification Program IT Figures Showcasing Details About PMI Credential Holders Clipart PDF
Mentioned slide displays information on the total PMI credential holders over past 12 months. Here the graph indicates that professionals opted for PMP certification in 2019 and surpassed the mark of 1,000,000 active certificate holders.Deliver an awe inspiring pitch with this creative pmi agile certification program it figures showcasing details about pmi credential holders clipart pdf bundle. Topics like figures showcasing details about pmi credential holders in past 12 months can be discussed with this completely editable template. It is available for immediate download depending on the needs and requirements of the user.

Health And Wellbeing Playbook Health And Fitness Program Overall Performance Summary Guidelines PDF
Following slide highlights an employees overall performance summary after completing health and fitness program. Performance indicators covered in the slide are physical activity, sleep, stress management, water intake and emotions. Deliver an awe inspiring pitch with this creative health and wellbeing playbook health and fitness program overall performance summary guidelines pdf bundle. Topics like health and fitness program overall performance summary can be discussed with this completely editable template. It is available for immediate download depending on the needs and requirements of the user.
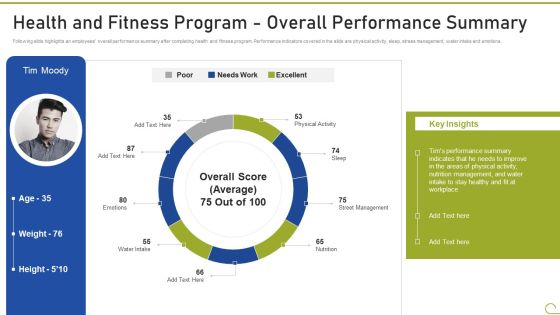
Health And Fitness Playbook Health And Fitness Program Overall Performance Summary Brochure PDF
Following slide highlights an employees overall performance summary after completing health and fitness program. Performance indicators covered in the slide are physical activity, sleep, stress management, water intake and emotions. Deliver and pitch your topic in the best possible manner with this health and fitness playbook health and fitness program overall performance summary brochure pdf. Use them to share invaluable insights on excellent needs work, tims performance summary, physical activity, nutrition management and impress your audience. This template can be altered and modified as per your expectations. So, grab it now.

KPI Dashboard To Track Effectiveness Of OJT Program Ppt Gallery Sample PDF
This slide shows key performance indicator dashboard which can be used to monitor OJT program. It includes KPIs such as training cost, total participants, cost per employee, cost per hour, training hours, etc. Showcasing this set of slides titled KPI Dashboard To Track Effectiveness Of OJT Program Ppt Gallery Sample PDF. The topics addressed in these templates are Actual Training Cost, Budgeted Training Cost, Cost per Employee. All the content presented in this PPT design is completely editable. Download it and make adjustments in color, background, font etc. as per your unique business setting.
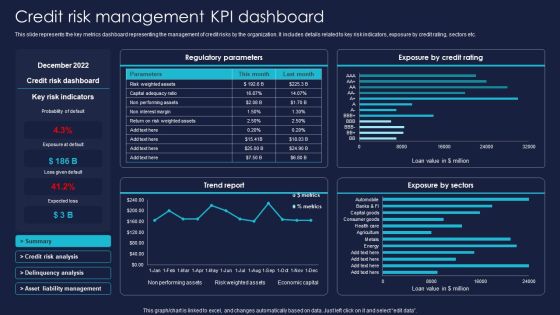
Enterprise Risk Management And Mitigation Program Credit Risk Management KPI Dashboard Introduction PDF
This slide represents the key metrics dashboard representing the management of credit risks by the organization. It includes details related to key risk indicators, exposure by credit rating, sectors etc. Want to ace your presentation in front of a live audience Our Enterprise Risk Management And Mitigation Program Credit Risk Management KPI Dashboard Introduction PDF can help you do that by engaging all the users towards you. Slidegeeks experts have put their efforts and expertise into creating these impeccable powerpoint presentations so that you can communicate your ideas clearly. Moreover, all the templates are customizable, and easy to edit and downloadable. Use these for both personal and commercial use.

Dashboard To Measure Performance Of Machine Driven Learning Implementation Ppt Gallery Gridlines PDF
This slide represents the critical performance indicators of RPA, such as time and money saved by different processes and the efficiency of the HR department in routine tasks. Deliver an awe inspiring pitch with this creative dashboard to measure performance of machine driven learning implementation ppt gallery gridlines pdf bundle. Topics like dashboard to measure performance of machine driven learning implementation can be discussed with this completely editable template. It is available for immediate download depending on the needs and requirements of the user.
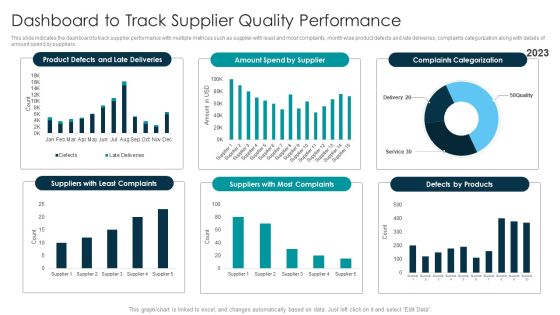
Tactical Approach For Vendor Reskilling Dashboard To Track Supplier Quality Performance Template PDF
This slide indicates the dashboard to track supplier performance with multiple metrices such as supplier with least and most complaints, month wise product defects and late deliveries, complaints categorization along with details of amount spend by suppliers. Make sure to capture your audiences attention in your business displays with our gratis customizable Tactical Approach For Vendor Reskilling Dashboard To Track Supplier Quality Performance Template PDF. These are great for business strategies, office conferences, capital raising or task suggestions. If you desire to acquire more customers for your tech business and ensure they stay satisfied, create your own sales presentation with these plain slides.
Inculcating Supplier Operation Improvement Plan Classification Of Supplier Based On Performance Icons PDF
This slide explains suppliers classification into defined groups based on their score. It indicates that vendor 1 will get placed into group A and vendor 2 into group B. Deliver and pitch your topic in the best possible manner with this inculcating supplier operation improvement plan classification of supplier based on performance icons pdf. Use them to share invaluable insights on outstanding performance, average performance, re qualification required, satisfactory performance and impress your audience. This template can be altered and modified as per your expectations. So, grab it now.

Automated Dashboard To Track Status Of Order Request Themes PDF
The following slide highlights automated dashboard which can be used to track the status of pleased orders, and manage the inventory across various outlets. The key performance indicators are order, summary, inventory, summary, cost of goods sold, financial statement. Showcasing this set of slides titled Automated Dashboard To Track Status Of Order Request Themes PDF. The topics addressed in these templates are Inventory Value, Inventory Summary, Cost. All the content presented in this PPT design is completely editable. Download it and make adjustments in color, background, font etc. as per your unique business setting.

Dashboard For Tracking Green Financing Activities Themes PDF
This slide presents a finance dashboard to track the progress of sustainability activities based on finance allocations. The key performing indicators are overall progress, energy usage by month, budget allocation and application etc. Showcasing this set of slides titled Dashboard For Tracking Green Financing Activities Themes PDF. The topics addressed in these templates are Activities, Application, Dashboard. All the content presented in this PPT design is completely editable. Download it and make adjustments in color, background, font etc. as per your unique business setting.

Five Year Comparison Of Registered Mobile Money Customers Spread By Region Introduction PDF
This slide shows the information statistics about region wise registered mobile money customers spread during last 5 years. It indicates that customers spread in south asia recorded highest that is 28.4persent over the last five years.Deliver and pitch your topic in the best possible manner with this Five Year Comparison Of Registered Mobile Money Customers Spread By Region Introduction PDF. Use them to share invaluable insights on Region Recorded, Mobile Money, Customers Spread and impress your audience. This template can be altered and modified as per your expectations. So, grab it now.

Healthcare Big Data Assessment Dashboard Slide2 Introduction PDF
This slide covers the records about the patients used to describe massive volumes of information created by the adoption of digital technologies that collect patients records and help in managing hospital performance. Showcasing this set of slides titled Healthcare Big Data Assessment Dashboard Slide2 Introduction PDF. The topics addressed in these templates are Forecasted Patient Turnover, Service Indicators, Occupancy. All the content presented in this PPT design is completely editable. Download it and make adjustments in color, background, font etc. as per your unique business setting.
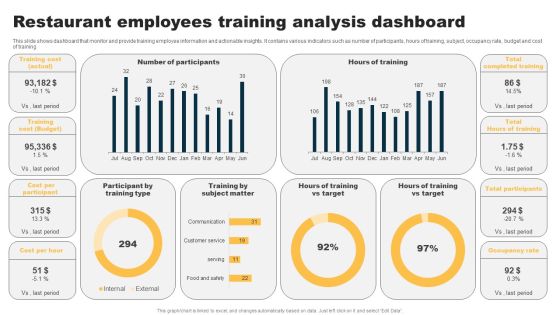
Restaurant Employees Training Analysis Dashboard Diagrams PDF
This slide shows dashboard that monitor and provide training employee information and actionable insights. It contains various indicators such as number of participants, hours of training, subject, occupancy rate, budget and cost of training. Showcasing this set of slides titled Restaurant Employees Training Analysis Dashboard Diagrams PDF. The topics addressed in these templates are Participant Training Type, Training Subject Matter, Hours Of Training Target. All the content presented in this PPT design is completely editable. Download it and make adjustments in color, background, font etc. as per your unique business setting.
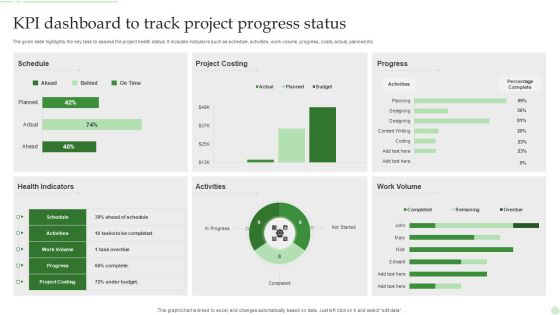
KPI Dashboard To Track Project Progress Status Ppt PowerPoint Presentation Gallery Maker PDF
The given slide highlights the key task to assess the project health status. It includes indicators such as schedule, activities, work volume, progress, costs, actual, planned etc. Showcasing this set of slides titled KPI Dashboard To Track Project Progress Status Ppt PowerPoint Presentation Gallery Maker PDF. The topics addressed in these templates are Schedule, Project Costing, Progress, Activities. All the content presented in this PPT design is completely editable. Download it and make adjustments in color, background, font etc. as per your unique business setting.

Covid19 Impact On Consumers Behavior Towards Restaurants Diagrams PDF
Mentioned slide displays informational statistics of coronavirus impact on consumer behavior towards restaurant visits. Here the graph indicates that 32 percentage customers said that they will reduce the frequency of eating at restaurants. Deliver an awe inspiring pitch with this creative covid19 impact on consumers behavior towards restaurants diagrams pdf bundle. Topics like covid 19 impact on consumers behavior towards restaurants can be discussed with this completely editable template. It is available for immediate download depending on the needs and requirements of the user.
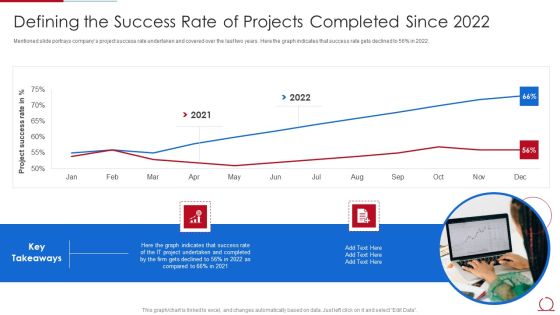
Quality Assurance Model For Agile IT Defining The Success Rate Of Projects Completed Themes PDF
Mentioned slide portrays companys project success rate undertaken and covered over the last two years. Here the graph indicates that success rate gets declined to 56 percent in 2022. Deliver an awe inspiring pitch with this creative quality assurance model for agile it defining the success rate of projects completed themes pdf bundle. Topics like success rate, it project, 2021 to 2022 can be discussed with this completely editable template. It is available for immediate download depending on the needs and requirements of the user.
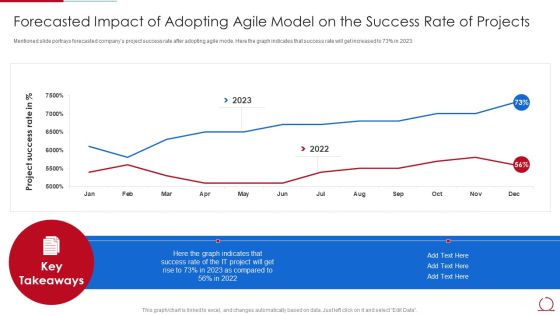
Quality Assurance Model For Agile IT Forecasted Impact Of Adopting Agile Model Themes PDF
Mentioned slide portrays forecasted companys project success rate after adopting agile mode. Here the graph indicates that success rate will get increased to 73 percent in 2023. Deliver and pitch your topic in the best possible manner with this quality assurance model for agile it forecasted impact of adopting agile model themes pdf. Use them to share invaluable insights on success rate, it project, 2022 to 2023 and impress your audience. This template can be altered and modified as per your expectations. So, grab it now.

Automation Project Status Dashboard Of Consulting Firm Report Background PDF
This slide showcases project status dashboard that provides a concise visual of key indicators progress and allow to compare actual performance with pre-built objectives. Key metrics covered are cost performance, time v or s project phase, timeline v or s resource capacity. Showcasing this set of slides titled Automation Project Status Dashboard Of Consulting Firm Report Background PDF. The topics addressed in these templates are Project Phase, Planned Value, Cost Performance Index. All the content presented in this PPT design is completely editable. Download it and make adjustments in color, background, font etc. as per your unique business setting.
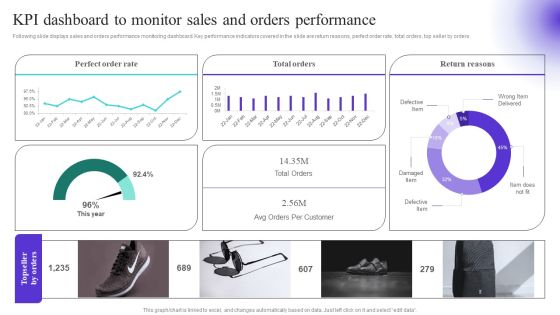
KPI Dashboard To Monitor Sales And Orders Performance Diagrams PDF
Following slide displays sales and orders performance monitoring dashboard. Key performance indicators covered in the slide are return reasons, perfect order rate, total orders, top seller by orders. Create an editable KPI Dashboard To Monitor Sales And Orders Performance Diagrams PDF that communicates your idea and engages your audience. Whether you are presenting a business or an educational presentation, pre designed presentation templates help save time. KPI Dashboard To Monitor Sales And Orders Performance Diagrams PDF is highly customizable and very easy to edit, covering many different styles from creative to business presentations. Slidegeeks has creative team members who have crafted amazing templates. So, go and get them without any delay.

 Home
Home