Gauge Chart

Drug Indicator Extension In A Pharmaceuticals Company Financial Results Of SW Care Company After Implementing Strategies Designs PDF
This slide shows the Financial Results of SW Care Company after implementing Strategies in terms of increasing Net Income and Revenue over the coming years. Deliver and pitch your topic in the best possible manner with this drug indicator extension in a pharmaceuticals company financial results of sw care company after implementing strategies designs pdf. Use them to share invaluable insights on revenue, net income and impress your audience. This template can be altered and modified as per your expectations. So, grab it now.

Flow Illustrate 9 Steps In Process Circular Layout Network PowerPoint Slides
We present our flow illustrate 9 steps in process Circular Layout Network PowerPoint Slides.Download and present our Arrows PowerPoint Templates because you have developed a vision of where you want to be a few years from now. Download our Circle Charts PowerPoint Templates because you have some excellent plans to spread some more of it across your community. Download and present our Process and Flows PowerPoint Templates because this slide brings grey areas to the table and explain in detail you assessment of the need for care to ensure continued smooth progress. Download and present our Business PowerPoint Templates because your fledgling career is in the chrysallis stage. Nurture it and watch it grow into a beautiful butterfly. Download and present our Shapes PowerPoint Templates because they are the indicators of the path you have in mind.Use these PowerPoint slides for presentations relating to Arrows, Blank, Business, Central, Centralized, Chart, Circle, Circular, Circulation, Concept, Conceptual, Converging, Design, Diagram, Empty, Executive, Icon, Idea, Illustration, Management, Map, Mapping, Moa, Model, Numbers, Organization, Outwards, Pointing, Procedure, Process, Radial, Radiating, Relationship, Resource, Sequence, Sequential, Seven, Square, Strategy. The prominent colors used in the PowerPoint template are Green, Gray, White. Professionals tell us our flow illustrate 9 steps in process Circular Layout Network PowerPoint Slides are Appealing. You can be sure our Circle PowerPoint templates and PPT Slides are Multicolored. Customers tell us our flow illustrate 9 steps in process Circular Layout Network PowerPoint Slides are Pretty. Professionals tell us our Centralized PowerPoint templates and PPT Slides are Nostalgic. People tell us our flow illustrate 9 steps in process Circular Layout Network PowerPoint Slides are Tasteful. People tell us our Chart PowerPoint templates and PPT Slides are Pretty.

Ppt Summary Of 4 State PowerPoint Project Diagram Involved Mechanism Templates
PPT summary of 4 state powerpoint project diagram involved mechanism Templates-This diagram is a graphical illustration of the relationships between and among sets of data, groups of objects that share something in common. They are indicators of the path you have in mind.-PPT summary of 4 state powerpoint project diagram involved mechanism Templates-abstract, background, balance, business, circle, colorful, complement, concept, conceptual, connected, control, cooperation, design, gear, harmony, icon, ideal, illustration, involved, machine, progress, rhythm, round, shape, spin, support, system, teamwork, technology, together, wheel
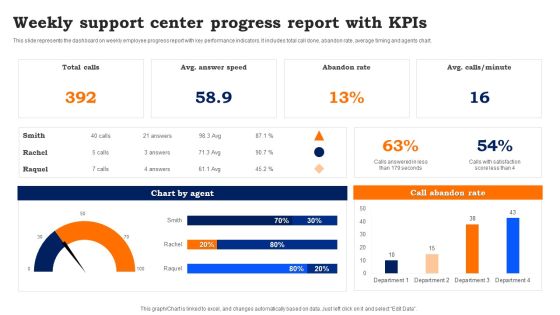
Weekly Support Center Progress Report With Kpis Template PDF
This slide represents the dashboard on weekly employee progress report with key performance indicators. It includes total call done, abandon rate, average timing and agents chart. Pitch your topic with ease and precision using this Weekly Support Center Progress Report With Kpis Template PDF. This layout presents information on Weekly Support, Center Progress Report. It is also available for immediate download and adjustment. So, changes can be made in the color, design, graphics or any other component to create a unique layout.

Managing Hybrid Waterfall Business Approach Project Dashboard Summary PDF
This slide illustrates agile key performance indicators for individual sprints. It includes tasks, story points, bugs, burndown charts, statistics etc. Showcasing this set of slides titled Managing Hybrid Waterfall Business Approach Project Dashboard Summary PDF. The topics addressed in these templates are Tasks, Story Points, Bugs. All the content presented in this PPT design is completely editable. Download it and make adjustments in color, background, font etc. as per your unique business setting.

Parallel Flow Task Management Diagram 5 Stages Business Plan Wiki PowerPoint Slides
We present our parallel flow task management diagram 5 stages business plan wiki PowerPoint Slides.Present our Process and Flows PowerPoint Templates because They will Put the wind in your sails. Skim smoothly over the choppy waters of the market. Use our Arrows PowerPoint Templates because Our PowerPoint Templates and Slides will effectively help you save your valuable time. They are readymade to fit into any presentation structure. Present our Shapes PowerPoint Templates because this template with an image of helps you chart the course of your presentation. Present our Business PowerPoint Templates because you have selected your team man for man. Present our Signs PowerPoint Templates because you can get advantage to prioritise your ideas.Use these PowerPoint slides for presentations relating to Arrows, cold, design, diagram, directional, drop, element, fahrenheit, flow, gauge, graph, graphic, green, heat, hot, icon, illustration, info graphic, orange, pointer, process, progress, red, segments, set, shadow, steps. The prominent colors used in the PowerPoint template are Orange, Gray, White. People tell us our parallel flow task management diagram 5 stages business plan wiki PowerPoint Slides will save the presenter time. You can be sure our design PowerPoint templates and PPT Slides are the best it can get when it comes to presenting. People tell us our parallel flow task management diagram 5 stages business plan wiki PowerPoint Slides are Second to none. PowerPoint presentation experts tell us our flow PowerPoint templates and PPT Slides are incredible easy to use. You can be sure our parallel flow task management diagram 5 stages business plan wiki PowerPoint Slides are Magnificent. People tell us our fahrenheit PowerPoint templates and PPT Slides are Splendid.

Adult Population That Are Actively Paying Customers Of Dating Service Formats PDF
Mentioned slide portrays worldwide informational stats of adult population that are actively paying customers of dating service. Here the graph indicates that country with the largest share is the United States.Deliver an awe inspiring pitch with this creative Adult Population That Are Actively Paying Customers Of Dating Service Formats PDF bundle. Topics like Graph Indicates, Dating Service, United States can be discussed with this completely editable template. It is available for immediate download depending on the needs and requirements of the user.
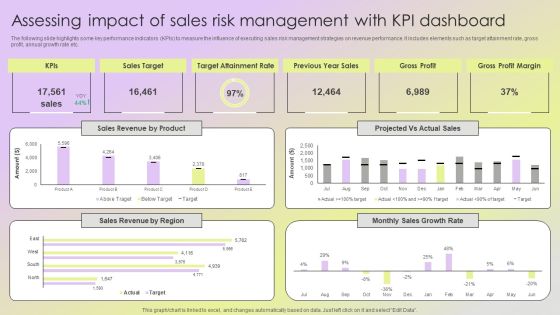
Mitigating Sales Risks With Strategic Action Planning Assessing Impact Of Sales Risk Management Diagrams PDF
The following slide highlights some key performance indicators KPIs to measure the influence of executing sales risk management strategies on revenue performance. It includes elements such as target attainment rate, gross profit, annual growth rate etc. If you are looking for a format to display your unique thoughts, then the professionally designed Mitigating Sales Risks With Strategic Action Planning Assessing Impact Of Sales Risk Management Diagrams PDF is the one for you. You can use it as a Google Slides template or a PowerPoint template. Incorporate impressive visuals, symbols, images, and other charts. Modify or reorganize the text boxes as you desire. Experiment with shade schemes and font pairings. Alter, share or cooperate with other people on your work. Download Mitigating Sales Risks With Strategic Action Planning Assessing Impact Of Sales Risk Management Diagrams PDF and find out how to give a successful presentation. Present a perfect display to your team and make your presentation unforgettable.

Iot Digital Twin Technology Post Covid Expenditure Management Healthcare Dashboard Showing Analytical Data Brochure PDF
This slide shows the healthcare dashboard that presents analytical data such as occupancy, patient turnover, efficiency and costs, satisfaction and service indicators. Deliver an awe inspiring pitch with this creative iot digital twin technology post covid expenditure management healthcare dashboard showing analytical data brochure pdf bundle. Topics like service, indicators, cost, appointments, turnover can be discussed with this completely editable template. It is available for immediate download depending on the needs and requirements of the user.

Data Safety Initiatives Risk Management KPI Dashboard With Loss Events And Actions Rules PDF
Following slide illustrates a risk management KPI dashboard. KPIs covered are top ten risks, loss events, actions, key risk indicators and compliance. Deliver an awe inspiring pitch with this creativedata safety initiatives overview of new it policy framework pictures pdf bundle. Topics like actions, key risk indicators, compliance, top 10 risks, loss events can be discussed with this completely editable template. It is available for immediate download depending on the needs and requirements of the user.

Risk Based Procedures To IT Security Risk Management KPI Dashboard With Loss Events And Actions Mockup PDF
Following slide illustrates a risk management KPI dashboard. KPIs covered are top ten risks, loss events, actions, key risk indicators and compliance. Deliver an awe inspiring pitch with this creative Risk Based Procedures To IT Security Risk Management KPI Dashboard With Loss Events And Actions Mockup PDF bundle. Topics like Key Risk, Indicators Compliance, Loss Events can be discussed with this completely editable template. It is available for immediate download depending on the needs and requirements of the user.
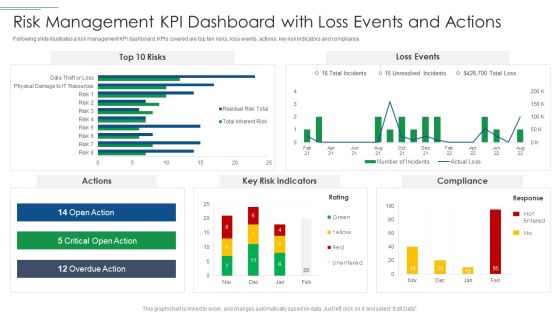
IT Security Risk Management Approach Introduction Risk Management KPI Dashboard With Loss Events Brochure PDF
Following slide illustrates a risk management KPI dashboard. KPIs covered are top ten risks, loss events, actions, key risk indicators and compliance. Deliver an awe inspiring pitch with this creative IT Security Risk Management Approach Introduction Risk Management KPI Dashboard With Loss Events Brochure PDF bundle. Topics like Key Risk Indicators, Risk Management can be discussed with this completely editable template. It is available for immediate download depending on the needs and requirements of the user.

Estimated Rise In Property Investment Introduction PDF
This slide shows potential growth of investment in real estate to showcase future economic growth. It includes growth factors like strong economic indicators, easy industrial licensing policies. Showcasing this set of slides titled Estimated Rise In Property Investment Introduction PDF. The topics addressed in these templates are Estimated Investment, Strong Economic Indicators, Growth. All the content presented in this PPT design is completely editable. Download it and make adjustments in color, background, font etc. as per your unique business setting.
HR Manager KPI Dashboard With Employee Attrition Tracking Report Brochure PDF
This slide covers performance key indicators for HR manager. It also indicates employee turnover count, new recruitment, retention, training and development of new employees. Showcasing this set of slides titled HR Manager KPI Dashboard With Employee Attrition Tracking Report Brochure PDF. The topics addressed in these templates are Recruitment, Employee Turnover, Development. All the content presented in this PPT design is completely editable. Download it and make adjustments in color, background, font etc. as per your unique business setting.
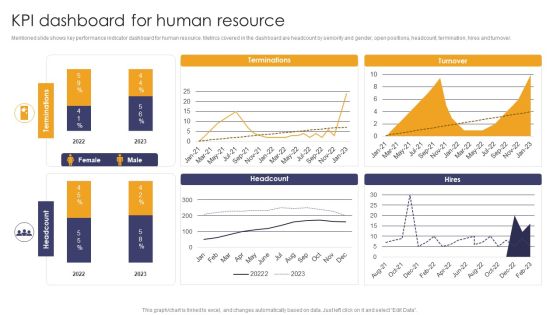
Implementing Succession Planning KPI Dashboard For Human Resource Template PDF
Mentioned slide shows key performance indicator dashboard for human resource. Metrics covered in the dashboard are headcount by seniority and gender, open positions, headcount, termination, hires and turnover. If you are looking for a format to display your unique thoughts, then the professionally designed Implementing Succession Planning KPI Dashboard For Human Resource Template PDF is the one for you. You can use it as a Google Slides template or a PowerPoint template. Incorporate impressive visuals, symbols, images, and other charts. Modify or reorganize the text boxes as you desire. Experiment with shade schemes and font pairings. Alter, share or cooperate with other people on your work. Download Implementing Succession Planning KPI Dashboard For Human Resource Template PDF and find out how to give a successful presentation. Present a perfect display to your team and make your presentation unforgettable.
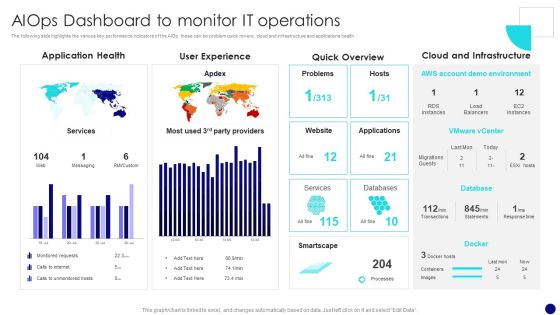
Information Technology Operations Administration With ML Aiops Dashboard To Monitor Diagrams PDF
The following slide highlights the various key performance indicators of the AIOp, these can be problem quick review, cloud and infrastructure and applications health. If you are looking for a format to display your unique thoughts, then the professionally designed Information Technology Operations Administration With ML Aiops Dashboard To Monitor Diagrams PDF is the one for you. You can use it as a Google Slides template or a PowerPoint template. Incorporate impressive visuals, symbols, images, and other charts. Modify or reorganize the text boxes as you desire. Experiment with shade schemes and font pairings. Alter, share or cooperate with other people on your work. Download Information Technology Operations Administration With ML Aiops Dashboard To Monitor Diagrams PDF and find out how to give a successful presentation. Present a perfect display to your team and make your presentation unforgettable.

Operational Strategy For ML In IT Sector Aiops Dashboard To Monitor IT Operations Diagrams PDF
The following slide highlights the various key performance indicators of the AIOps, these can be problem quick review, cloud and infrastructure and applications health If you are looking for a format to display your unique thoughts, then the professionally designed Operational Strategy For ML In IT Sector Aiops Dashboard To Monitor IT Operations Diagrams PDF is the one for you. You can use it as a Google Slides template or a PowerPoint template. Incorporate impressive visuals, symbols, images, and other charts. Modify or reorganize the text boxes as you desire. Experiment with shade schemes and font pairings. Alter, share or cooperate with other people on your work. Download Operational Strategy For ML In IT Sector Aiops Dashboard To Monitor IT Operations Diagrams PDF and find out how to give a successful presentation. Present a perfect display to your team and make your presentation unforgettable.
Impact Of Customer Churn On Organization Performance Icons PDF
Mentioned slide outlines the impact of a higher attrition rate on the companys financial performance. It contains information about major financial key performance indicators KPIs such as monthly recurring revenue MRR, customer lifetime value CLV, and customer acquisition cost CAC. If you are looking for a format to display your unique thoughts, then the professionally designed Impact Of Customer Churn On Organization Performance Icons PDF is the one for you. You can use it as a Google Slides template or a PowerPoint template. Incorporate impressive visuals, symbols, images, and other charts. Modify or reorganize the text boxes as you desire. Experiment with shade schemes and font pairings. Alter, share or cooperate with other people on your work. Download Impact Of Customer Churn On Organization Performance Icons PDF and find out how to give a successful presentation. Present a perfect display to your team and make your presentation unforgettable.

Cost And Purchase Order Procurement Dashboard Icons PDF
This slide provides an overview of the cost and purchase order-related performance indicators to improve efficiency and optimize processes. The dashboard includes the cost of the purchase order, cost reduction, savings, procurement ROI and top 5 suppliers. If you are looking for a format to display your unique thoughts, then the professionally designed Cost And Purchase Order Procurement Dashboard Icons PDF is the one for you. You can use it as a Google Slides template or a PowerPoint template. Incorporate impressive visuals, symbols, images, and other charts. Modify or reorganize the text boxes as you desire. Experiment with shade schemes and font pairings. Alter, share or cooperate with other people on your work. Download Cost And Purchase Order Procurement Dashboard Icons PDF and find out how to give a successful presentation. Present a perfect display to your team and make your presentation unforgettable.

Human Resources Related Risk Metrics Dashboard Information PDF
This slide illustrates graphical representation of people key risk indicators. It includes indicators namely staff turnover, employee satisfaction, employee absenteeism etc. Pitch your topic with ease and precision using this Human Resources Related Risk Metrics Dashboard Information PDF. This layout presents information on Human Resources Related Risk Metrics Dashboard. It is also available for immediate download and adjustment. So, changes can be made in the color, design, graphics or any other component to create a unique layout.

Determining The Ransom Payment Paid By Organizations Over Time Information PDF
Following graphical slide shows the amount of ransom paid by organizations over the last two years. Graph indicates that ransom payments appear to have stabilized as a result of effective incident response approaches.If you are looking for a format to display your unique thoughts, then the professionally designed Determining The Ransom Payment Paid By Organizations Over Time Information PDF is the one for you. You can use it as a Google Slides template or a PowerPoint template. Incorporate impressive visuals, symbols, images, and other charts. Modify or reorganize the text boxes as you desire. Experiment with shade schemes and font pairings. Alter, share or cooperate with other people on your work. Download Determining The Ransom Payment Paid By Organizations Over Time Information PDF and find out how to give a successful presentation. Present a perfect display to your team and make your presentation unforgettable.
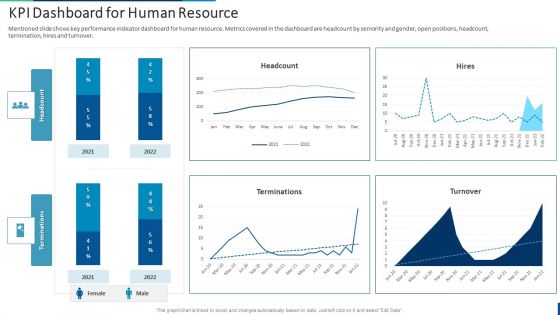
Internal Employee Succession KPI Dashboard For Human Resource Information PDF
Mentioned slide shows key performance indicator dashboard for human resource. Metrics covered in the dashboard are headcount by seniority and gender, open positions, headcount, termination, hires and turnover. If you are looking for a format to display your unique thoughts, then the professionally designed Internal Employee Succession KPI Dashboard For Human Resource Information PDF is the one for you. You can use it as a Google Slides template or a PowerPoint template. Incorporate impressive visuals, symbols, images, and other charts. Modify or reorganize the text boxes as you desire. Experiment with shade schemes and font pairings. Alter, share or cooperate with other people on your work. Download Internal Employee Succession KPI Dashboard For Human Resource Information PDF and find out how to give a successful presentation. Present a perfect display to your team and make your presentation unforgettable.

Aiops Dashboard To Monitor IT Operations Aiops Integration Summary Report Clipart PDF
The following slide highlights the various key performance indicators of the AIOp, these can be problem quick review, cloud and infrastructure and applications health. If you are looking for a format to display your unique thoughts, then the professionally designed Aiops Dashboard To Monitor IT Operations Aiops Integration Summary Report Clipart PDF is the one for you. You can use it as a Google Slides template or a PowerPoint template. Incorporate impressive visuals, symbols, images, and other charts. Modify or reorganize the text boxes as you desire. Experiment with shade schemes and font pairings. Alter, share or cooperate with other people on your work. Download Aiops Dashboard To Monitor IT Operations Aiops Integration Summary Report Clipart PDF and find out how to give a successful presentation. Present a perfect display to your team and make your presentation unforgettable.

AI Deployment In IT Process Aiops Dashboard To Monitor IT Operations Infographics PDF
The following slide highlights the various key performance indicators of the AIOp, these can be problem quick review, cloud and infrastructure and applications health. If you are looking for a format to display your unique thoughts, then the professionally designed AI Deployment In IT Process Aiops Dashboard To Monitor IT Operations Infographics PDF is the one for you. You can use it as a Google Slides template or a PowerPoint template. Incorporate impressive visuals, symbols, images, and other charts. Modify or reorganize the text boxes as you desire. Experiment with shade schemes and font pairings. Alter, share or cooperate with other people on your work. Download AI Deployment In IT Process Aiops Dashboard To Monitor IT Operations Infographics PDF and find out how to give a successful presentation. Present a perfect display to your team and make your presentation unforgettable.

Creating Positioning Techniques For Market Research Analyzing Customer Demographics Through Performance Background PDF
The following slide outlines key performance indicator KPI dashboard outlining customer demographics. Information covered in this slide is related to metrics such as gender, education level, technology adoption life cycle, and brand innovation consent. If you are looking for a format to display your unique thoughts, then the professionally designed Creating Positioning Techniques For Market Research Analyzing Customer Demographics Through Performance Background PDF is the one for you. You can use it as a Google Slides template or a PowerPoint template. Incorporate impressive visuals, symbols, images, and other charts. Modify or reorganize the text boxes as you desire. Experiment with shade schemes and font pairings. Alter, share or cooperate with other people on your work. Download Creating Positioning Techniques For Market Research Analyzing Customer Demographics Through Performance Background PDF and find out how to give a successful presentation. Present a perfect display to your team and make your presentation unforgettable.

Dashboard To Analyze Flexible Working Strategies Impact On Employees Performance Professional PDF
The following slide delineates a key performance indicator KPI dashboard through which managers can evaluate the success of a flexible working policy on workforce performance. The major KPIs are absenteeism rate, overall labor effectiveness etc. If you are looking for a format to display your unique thoughts, then the professionally designed Dashboard To Analyze Flexible Working Strategies Impact On Employees Performance Professional PDF is the one for you. You can use it as a Google Slides template or a PowerPoint template. Incorporate impressive visuals, symbols, images, and other charts. Modify or reorganize the text boxes as you desire. Experiment with shade schemes and font pairings. Alter, share or cooperate with other people on your work. Download Dashboard To Analyze Flexible Working Strategies Impact On Employees Performance Professional PDF and find out how to give a successful presentation. Present a perfect display to your team and make your presentation unforgettable.

Ml And Big Data In Information Technology Processes Aiops Dashboard To Monitor IT Operations Sample PDF
The following slide highlights the various key performance indicators of the AIOp, these can be problem quick review, cloud and infrastructure and applications health If you are looking for a format to display your unique thoughts, then the professionally designed Ml And Big Data In Information Technology Processes Aiops Dashboard To Monitor IT Operations Sample PDF is the one for you. You can use it as a Google Slides template or a PowerPoint template. Incorporate impressive visuals, symbols, images, and other charts. Modify or reorganize the text boxes as you desire. Experiment with shade schemes and font pairings. Alter, share or cooperate with other people on your work. Download Ml And Big Data In Information Technology Processes Aiops Dashboard To Monitor IT Operations Sample PDF and find out how to give a successful presentation. Present a perfect display to your team and make your presentation unforgettable.
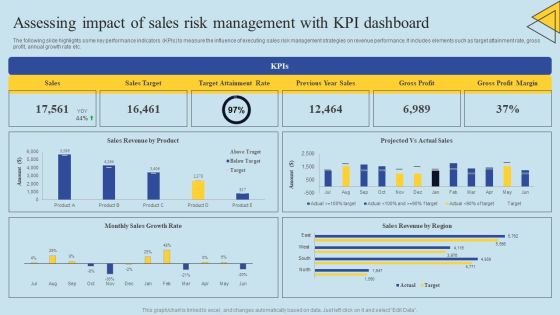
Determining Risks In Sales Administration Procedure Assessing Impact Of Sales Risk Management Sample PDF
The following slide highlights some key performance indicators KPIs to measure the influence of executing sales risk management strategies on revenue performance. It includes elements such as target attainment rate, gross profit, annual growth rate etc. If you are looking for a format to display your unique thoughts, then the professionally designed Determining Risks In Sales Administration Procedure Assessing Impact Of Sales Risk Management Sample PDF is the one for you. You can use it as a Google Slides template or a PowerPoint template. Incorporate impressive visuals, symbols, images, and other charts. Modify or reorganize the text boxes as you desire. Experiment with shade schemes and font pairings. Alter, share or cooperate with other people on your work. Download Determining Risks In Sales Administration Procedure Assessing Impact Of Sales Risk Management Sample PDF and find out how to give a successful presentation. Present a perfect display to your team and make your presentation unforgettable.

Increasing Consumer Engagement With Database Dashboard To Evaluate Targeted Social Media Portrait PDF
The purpose of this slide is to outline a comprehensive dashboard through which marketers can analyze effectiveness of targeted social media campaign performance. The key performance indicators KPIs are social media followers, LinkedIn key metrics, page likes, page impressions, etc. If you are looking for a format to display your unique thoughts, then the professionally designed Increasing Consumer Engagement With Database Dashboard To Evaluate Targeted Social Media Portrait PDF is the one for you. You can use it as a Google Slides template or a PowerPoint template. Incorporate impressive visuals, symbols, images, and other charts. Modify or reorganize the text boxes as you desire. Experiment with shade schemes and font pairings. Alter, share or cooperate with other people on your work. Download Increasing Consumer Engagement With Database Dashboard To Evaluate Targeted Social Media Portrait PDF and find out how to give a successful presentation. Present a perfect display to your team and make your presentation unforgettable.

Cost And Schedule Variance Analysis In Earned Value Management Ppt Pictures Design Ideas PDF
This slide represents cost and schedule variance analysis in earned value management illustrating planned value, earned value, actual cost etc used for indicating cost performance index. Showcasing this set of slides titled Cost And Schedule Variance Analysis In Earned Value Management Ppt Pictures Design Ideas PDF. The topics addressed in these templates are CPI Indicates, Financial Effectiveness, Efficiency Project. All the content presented in this PPT design is completely editable. Download it and make adjustments in color, background, font etc. as per your unique business setting.
Kpis List Of Project Management Lifecycle Formats PDF
This slide depicts project management indicators list which helps manager to measure company and sector and evaluate performance achieving strategies. It include indicators such as average score, result areas and review of the project. Pitch your topic with ease and precision using this Kpis List Of Project Management Lifecycle Formats PDF. This layout presents information on Project Management, Performance Score, Average. It is also available for immediate download and adjustment. So, changes can be made in the color, design, graphics or any other component to create a unique layout.

Corporate Physical Health And Fitness Culture Playbook Health And Fitness Program Overall Portrait PDF
Following slide highlights an employees overall performance summary after completing health and fitness program. Performance indicators covered in the slide are physical activity, sleep, stress management, water intake and emotions. Deliver an awe inspiring pitch with this creative corporate physical health and fitness culture playbook health and fitness program overall portrait pdf bundle. Topics like tims performance summary indicates, physical activity, nutrition management can be discussed with this completely editable template. It is available for immediate download depending on the needs and requirements of the user.

IT Value Story Significant To Corporate Leadership Financial Fundamental Metrics Diagrams PDF
These indicators assist IT leaders in stewarding technology expenditures and investments, and they are essential to managing the IT company. These measures aid in the management of the departments financial health and may indicate levers for cost reduction, improved resource allocation, and enhanced accountability. Deliver and pitch your topic in the best possible manner with this it value story significant to corporate leadership financial fundamental metrics diagrams pdf. Use them to share invaluable insights on organizations, budget, metric, cost and impress your audience. This template can be altered and modified as per your expectations. So, grab it now.

Agriculture Budgeting And Management Based On Dashboard Report Topics PDF
Following slide presents a dashboard that will assist farmers in planning and budgeting based on the key performance indicators. The key performance indicators are crop name, area, last production, current temperature, etc. Showcasing this set of slides titled Agriculture Budgeting And Management Based On Dashboard Report Topics PDF. The topics addressed in these templates are Production Details. All the content presented in this PPT design is completely editable. Download it and make adjustments in color, background, font etc. as per your unique business setting.

Professional Scrum Master Certification Percent Change In Workplace Productivity Post Adoption Infographics PDF
Following slide illustrates informational stats about percent change in workplace productivity post agile methodology adaption. Here the graph indicates that workplace productivity gets decreased by 1.6 percent. Deliver and pitch your topic in the best possible manner with this professional scrum master certification percent change in workplace productivity post adoption infographics pdf. Use them to share invaluable insights on workplace productivity, 2017 to 2022, graph indicates and impress your audience. This template can be altered and modified as per your expectations. So, grab it now.
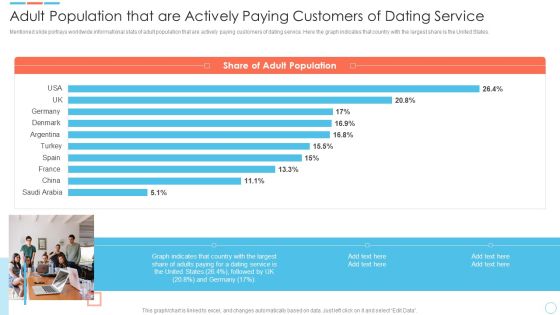
Elevator Online Dating Software Adult Population That Are Actively Paying Customers Guidelines PDF
Mentioned slide portrays worldwide informational stats of adult population that are actively paying customers of dating service. Here the graph indicates that country with the largest share is the United States. Deliver an awe inspiring pitch with this creative Elevator Online Dating Software Adult Population That Are Actively Paying Customers Guidelines PDF bundle. Topics like Share Adult Population, Graph indicates, Customers can be discussed with this completely editable template. It is available for immediate download depending on the needs and requirements of the user.
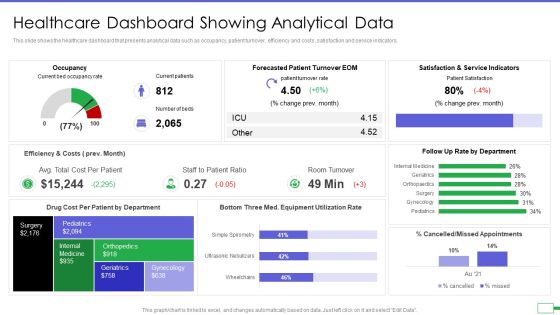
Iot And Digital Twin To Reduce Costs Post Covid Healthcare Dashboard Showing Analytical Data Elements PDF
This slide shows the healthcare dashboard that presents analytical data such as occupancy, patient turnover, efficiency and costs, satisfaction and service indicators. Deliver and pitch your topic in the best possible manner with this iot and digital twin to reduce costs post covid healthcare dashboard showing analytical data elements pdf. Use them to share invaluable insights on occupancy, patient turnover, efficiency and costs, satisfaction and service indicators and impress your audience. This template can be altered and modified as per your expectations. So, grab it now.

Financial Fundamental Metrics Infrastructure Unit Costs Vs Target Benchmarks Ppt Professional Example PDF
These indicators assist IT leaders in stewarding technology expenditures and investments, and they are essential to managing the IT company. These measures aid in the management of the departments financial health and may indicate levers for cost reduction, improved resource allocation, and enhanced accountability. Deliver and pitch your topic in the best possible manner with this financial fundamental metrics infrastructure unit costs vs target benchmarks ppt professional example pdf. Use them to share invaluable insights on outsourcing, organizations, budget and impress your audience. This template can be altered and modified as per your expectations. So, grab it now.

Communicate Company Value To Your Stakeholders Financial Fundamental Metrics Graphics PDF
These indicators assist IT leaders in stewarding technology expenditures and investments, and they are essential to managing the IT company. These measures aid in the management of the departments financial health and may indicate levers for cost reduction, improved resource allocation, and enhanced accountability. Deliver and pitch your topic in the best possible manner with this communicate company value to your stakeholders financial fundamental metrics graphics pdf. Use them to share invaluable insights on organizations, budget, protect and impress your audience. This template can be altered and modified as per your expectations. So, grab it now.

How To Evaluate And Develop The Organizational Value Of IT Service Financial Fundamental Metrics Slides PDF
These indicators assist IT leaders in stewarding technology expenditures and investments, and they are essential to managing the IT company. These measures aid in the management of the departments financial health and may indicate levers for cost reduction, improved resource allocation, and enhanced accountability. Deliver and pitch your topic in the best possible manner with this how to evaluate and develop the organizational value of it service financial fundamental metrics slides pdf. Use them to share invaluable insights on organizations, budget, business, efficiency and impress your audience. This template can be altered and modified as per your expectations. So, grab it now.
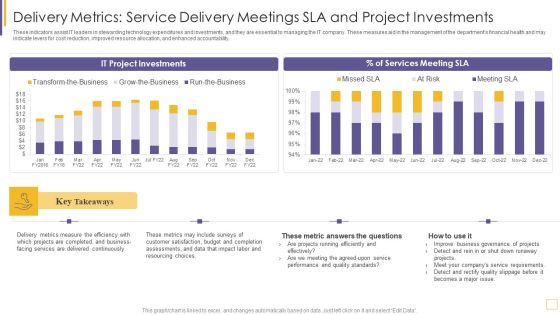
Guidelines For Exhibiting Business Value Of Information And Technology Delivery Metrics Service Portrait PDF
These indicators assist IT leaders in stewarding technology expenditures and investments, and they are essential to managing the IT company. These measures aid in the management of the departments financial health and may indicate levers for cost reduction, improved resource allocation, and enhanced accountability. Deliver and pitch your topic in the best possible manner with this guidelines for exhibiting business value of information and technology delivery metrics service portrait pdf. Use them to share invaluable insights on metrics measure, services, budget, resourcing and impress your audience. This template can be altered and modified as per your expectations. So, grab it now.

Guidelines For Exhibiting Business Value Of Information And Technology Financial Fundamental Metrics IT Spend Mockup PDF
These indicators assist IT leaders in stewarding technology expenditures and investments, and they are essential to managing the IT company. These measures aid in the management of the departments financial health and may indicate levers for cost reduction, improved resource allocation, and enhanced accountability. Deliver an awe inspiring pitch with this creative guidelines for exhibiting business value of information and technology financial fundamental metrics it spend mockup pdf bundle. Topics like metric, organizations, budget, demonstrate can be discussed with this completely editable template. It is available for immediate download depending on the needs and requirements of the user.

Annual B2C Business Review Dashboard Microsoft PDF
The following slide shows dashboard to help organizations arrange financial business indicators and communicate important companys information to key stakeholders. It includes sales, gross, operating and net profit and other major performance indicators. Showcasing this set of slides titled Annual B2C Business Review Dashboard Microsoft PDF. The topics addressed in these templates are Gross Profit, Sales, Operating Profit. All the content presented in this PPT design is completely editable. Download it and make adjustments in color, background, font etc. as per your unique business setting.

Kpis To Optimize For Overcoming Decline Of Sales Mockup PDF
This slide consists of key performance indicators that can be implemented by managers for optimizing and overcoming lost sales. Major key performance indicators are stockout rate, order fulfilment rate, customer satisfaction rate, etc. Showcasing this set of slides titled Kpis To Optimize For Overcoming Decline Of Sales Mockup PDF. The topics addressed in these templates are Target, Actual, Deviation. All the content presented in this PPT design is completely editable. Download it and make adjustments in color, background, font etc. as per your unique business setting.
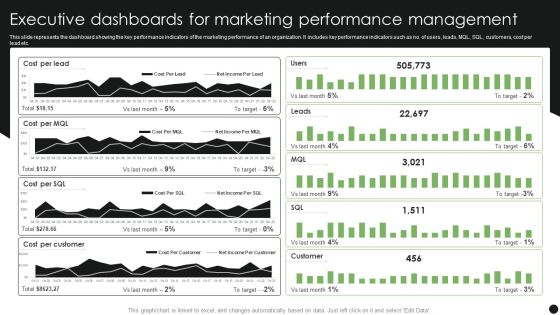
Executive Dashboards For Marketing Performance Management Slides PDF
This slide represents the dashboard showing the key performance indicators of the marketing performance of an organization. It includes key performance indicators such as no. of users, leads, MQL, SQL, customers, cost per lead etc. Pitch your topic with ease and precision using this Executive Dashboards For Marketing Performance Management Slides PDF. This layout presents information on Cost Per Lead, Cost Per Customer. It is also available for immediate download and adjustment. So, changes can be made in the color, design, graphics or any other component to create a unique layout.

Dashboard For Monitoring Construction Project Status And Risk Management Ideas PDF
This slide represents dashboard which is used to track construction project performance for effective risk management progress . It provides information regarding key risk indicators, project completion percentage, project stages, project workload etc. Pitch your topic with ease and precision using this Dashboard For Monitoring Construction Project Status And Risk Management Ideas PDF. This layout presents information on Project Completion Percentage, Key Risk Indicators, Project By Stage. It is also available for immediate download and adjustment. So, changes can be made in the color, design, graphics or any other component to create a unique layout.

Customer Decline Of Sales Analysis Dashboard Rules PDF
The following slide presents a key performance indicating dashboards that can be used by managers in order to analyse customer-lost sales. Major key performance indicators are lost deals rate, lost sales rate, customer data analytics, etc. Pitch your topic with ease and precision using this Customer Decline Of Sales Analysis Dashboard Rules PDF. This layout presents information on Customer Data Analytics. It is also available for immediate download and adjustment. So, changes can be made in the color, design, graphics or any other component to create a unique layout.

Inventory Stock Out And Decline Of Sales Analysis Dashboard Inspiration PDF
Following slide presents a key performance indicating dashboard that can be used by businesses to track Inventory stock out and lost sales. Major key performance indicators are percentage stockouts, amount of sales, lost sales accountability, etc. Pitch your topic with ease and precision using this Inventory Stock Out And Decline Of Sales Analysis Dashboard Inspiration PDF. This layout presents information on Lost Sales Summary, Stock Out Details It is also available for immediate download and adjustment. So, changes can be made in the color, design, graphics or any other component to create a unique layout.
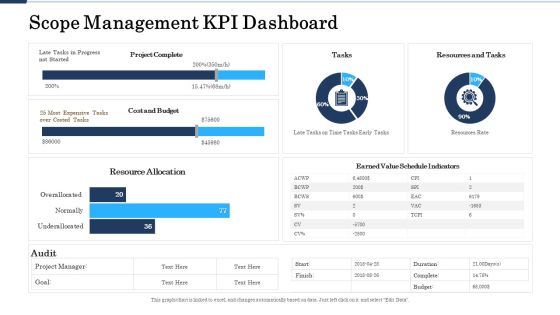
Project Deliverables Administration Outline Scope Management KPI Dashboard Ppt Inspiration Graphics Template PDF
Deliver an awe-inspiring pitch with this creative project deliverables administration outline scope management kpi dashboard ppt inspiration graphics template pdf bundle. Topics like project complete, tasks, resources and tasks, cost and budget, resource allocation, earned value schedule indicators can be discussed with this completely editable template. It is available for immediate download depending on the needs and requirements of the user.

Finance And Accounting Online Conversion Plan Sales And Profit Margin Analysis Dashboard Demonstration PDF
Deliver and pitch your topic in the best possible manner with this Finance And Accounting Online Conversion Plan Sales And Profit Margin Analysis Dashboard Demonstration PDF. Use them to share invaluable insights on Profitability Indicator, Goods Breakdown, Expenses Breakdown and impress your audience. This template can be altered and modified as per your expectations. So, grab it now.

Roadmap For Financial Accounting Transformation Sales And Profit Margin Analysis Dashboard Pictures PDF
Deliver an awe inspiring pitch with this creative roadmap for financial accounting transformation sales and profit margin analysis dashboard pictures pdf bundle. Topics like profitability indicator ratios, costs and expenses, expenses breakdown can be discussed with this completely editable template. It is available for immediate download depending on the needs and requirements of the user.
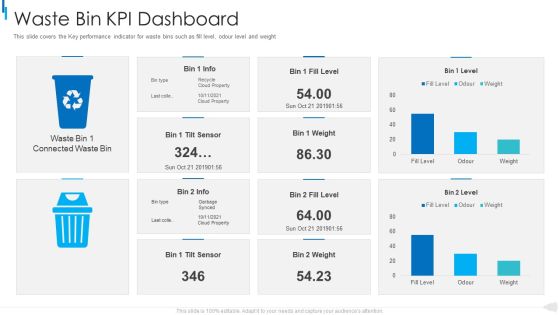
MSW Management Waste Bin Kpi Dashboard Clipart PDF
This slide covers the Key performance indicator for waste bins such as fill level, odour level and weight. Deliver an awe inspiring pitch with this creative MSW Management Waste Bin Kpi Dashboard Clipart Pdf bundle. Topics like waste bin kpi dashboard can be discussed with this completely editable template. It is available for immediate download depending on the needs and requirements of the user.

Sales And Profit Margin Analysis Dashboard Introduction PDF
Deliver an awe inspiring pitch with this creative Sales And Profit Margin Analysis Dashboard Introduction PDF bundle. Topics like Net Sales, Net Profit, Profitability Indicator Ratios can be discussed with this completely editable template. It is available for immediate download depending on the needs and requirements of the user.
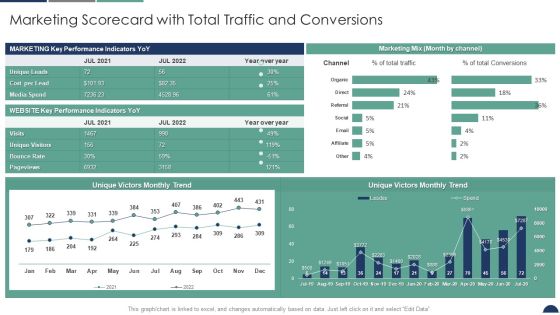
Marketing Scorecard With Total Traffic And Conversions Sales And Marketing Scorecard Topics PDF
Deliver and pitch your topic in the best possible manner with this Marketing Scorecard With Total Traffic And Conversions Sales And Marketing Scorecard Topics PDF. Use them to share invaluable insights on Key Performance Indicators, Marketing Mix, Bounce Rate and impress your audience. This template can be altered and modified as per your expectations. So, grab it now.

Project Capabilities Scope Management KPI Dashboard Ppt Slide Download PDF
Presenting this set of slides with name project capabilities scope management kpi dashboard ppt slide download pdf. The topics discussed in these slides are project complete, cost and budget, resource allocation, earned value schedule indicators, resources and tasks. This is a completely editable PowerPoint presentation and is available for immediate download. Download now and impress your audience.
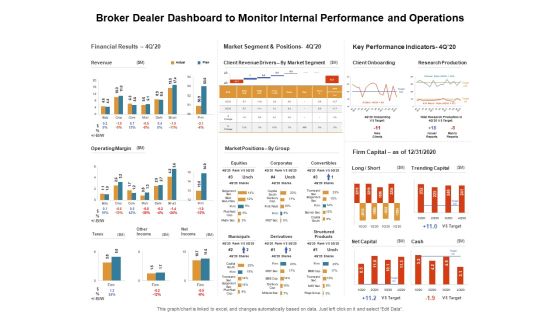
Venture Capitalist Control Board Broker Dealer Dashboard To Monitor Internal Performance And Operations Information PDF
Presenting this set of slides with name venture capitalist control board broker dealer dashboard to monitor internal performance and operations information pdf. The topics discussed in these slides are financial results, market segment and positions, key performance indicators. This is a completely editable PowerPoint presentation and is available for immediate download. Download now and impress your audience.

Venture Capitalist Control Board Different Branch Locations Performance Assessment Dashboard Graphics PDF
Presenting this set of slides with name venture capitalist control board different branch locations performance assessment dashboard graphics pdf. The topics discussed in these slides are room free revenue, ancillary revenue, key performance indicators, room gross margin, location description, vacancy rate. This is a completely editable PowerPoint presentation and is available for immediate download. Download now and impress your audience.

Agile Software Development Lifecycle IT Impact Of Quality Attributes On SDLC Phases Clipart PDF
Mentioned slide provides information on the impact of quality attributes namely availability, flexibility, testability and scalability on software development life cycle phases.Deliver an awe inspiring pitch with this creative agile software development lifecycle it impact of quality attributes on sdlc phases clipart pdf bundle. Topics like indicates that flexible, impact on requirement, software development can be discussed with this completely editable template. It is available for immediate download depending on the needs and requirements of the user.
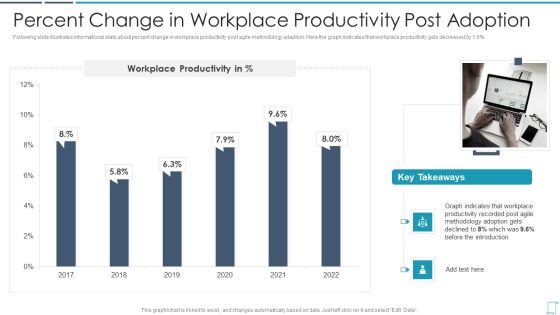
Professional Scrum Master Certification Training Program IT Percent Change In Workplace Template PDF
Following slide illustrates informational stats about percent change in workplace productivity post agile methodology adaption. Here the graph indicates that workplace productivity gets decreased by 1.6persent.Deliver and pitch your topic in the best possible manner with this professional scrum master certification training program it percent change in workplace template pdf Use them to share invaluable insights on productivity, methodology adoption, before the introduction and impress your audience. This template can be altered and modified as per your expectations. So, grab it now.
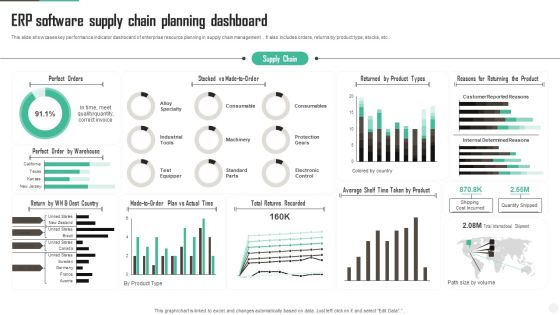
ERP Software Supply Chain Planning Dashboard Diagrams PDF
This slide showcases key performance indicator dashboard of enterprise resource planning in supply chain management . It also includes orders, returns by product type, stocks, etc. Showcasing this set of slides titled ERP Software Supply Chain Planning Dashboard Diagrams PDF Sample. The topics addressed in these templates are Perfect Orders, Dest Country, Actual Time. All the content presented in this PPT design is completely editable. Download it and make adjustments in color, background, font etc. as per your unique business setting.

 Home
Home