Gauge Chart
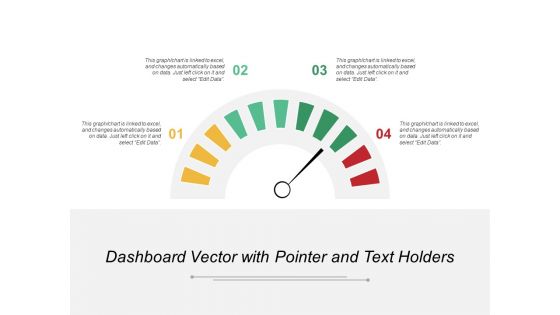
Dashboard Vector With Pointer And Text Holders Ppt PowerPoint Presentation Portfolio Format Ideas
This is a dashboard vector with pointer and text holders ppt powerpoint presentation portfolio format ideas. This is a four stage process. The stages in this process are performance dashboard, performance meter, performance kpi.
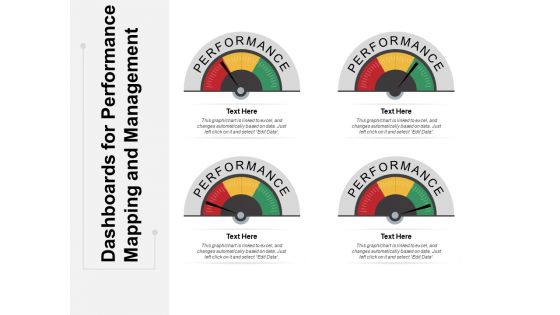
Dashboards For Performance Mapping And Management Ppt PowerPoint Presentation Ideas File Formats
This is a dashboards for performance mapping and management ppt powerpoint presentation ideas file formats. This is a four stage process. The stages in this process are performance dashboard, performance meter, performance kpi.

KPI Dashboards And Operational Metrics Ppt PowerPoint Presentation Portfolio Infographics
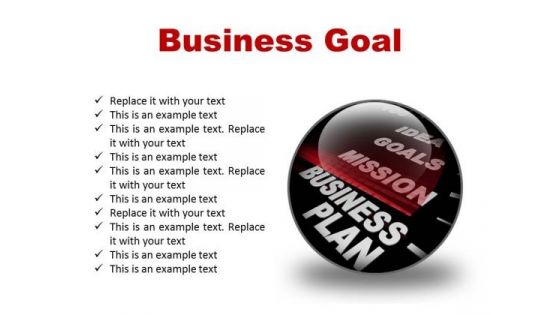
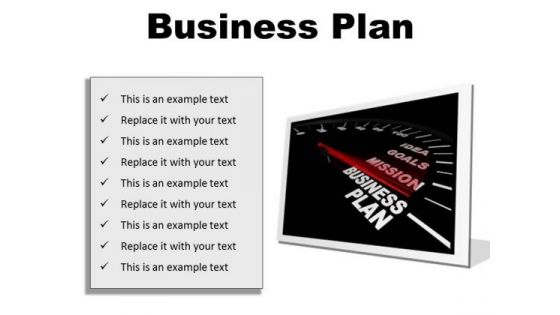
Business Plan Future PowerPoint Presentation Slides C
Microsoft Powerpoint Slides and Backgrounds with a speedometer needle speeds past the various stages of getting a job the resume the interview and success
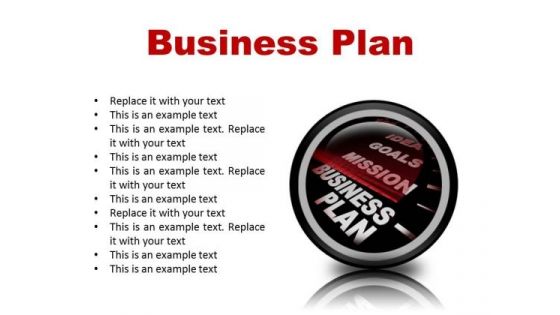
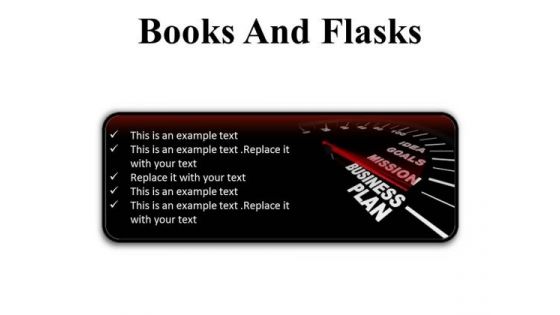
Business Plan Future PowerPoint Presentation Slides Cc
Microsoft Powerpoint Slides and Backgrounds with a speedometer needle speeds past the various stages of getting a job the resume the interview and success
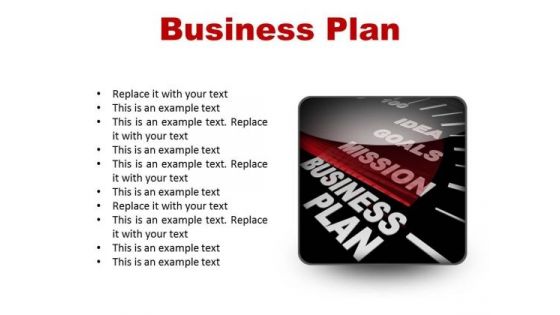
Business Plan Future PowerPoint Presentation Slides F
Microsoft Powerpoint Slides and Backgrounds with a speedometer needle speeds past the various stages of getting a job the resume the interview and success
Business Plan Future PowerPoint Presentation Slides R
Microsoft Powerpoint Slides and Backgrounds with a speedometer needle speeds past the various stages of getting a job the resume the interview and success
Business Plan Future PowerPoint Presentation Slides S
Microsoft Powerpoint Slides and Backgrounds with a speedometer needle speeds past the various stages of getting a job the resume the interview and success
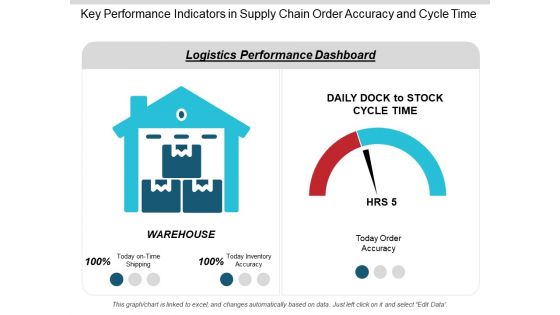
Key Performance Indicators In Supply Chain Order Accuracy And Cycle Time Ppt PowerPoint Presentation Infographics Slideshow
This is a key performance indicators in supply chain order accuracy and cycle time ppt powerpoint presentation infographics slideshow. This is a two stage process. The stages in this process are logistics performance, logistics dashboard, logistics kpis.
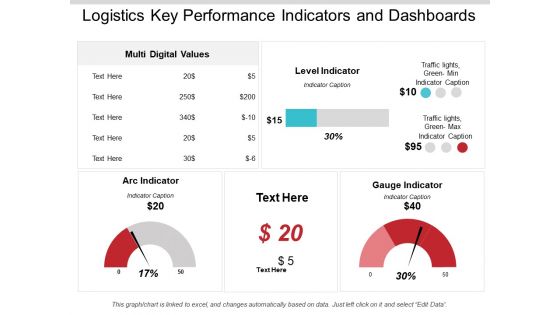
Logistics Key Performance Indicators And Dashboards Ppt PowerPoint Presentation Infographics Background Image
This is a logistics key performance indicators and dashboards ppt powerpoint presentation infographics background image. This is a three stage process. The stages in this process are logistics performance, logistics dashboard, logistics kpis.

Competitor Analysis Ppt PowerPoint Presentation Slides Visuals
This is a competitor analysis ppt powerpoint presentation slides visuals. This is a four stage process. The stages in this process are sales development, revenue, sales, performance, indicators.
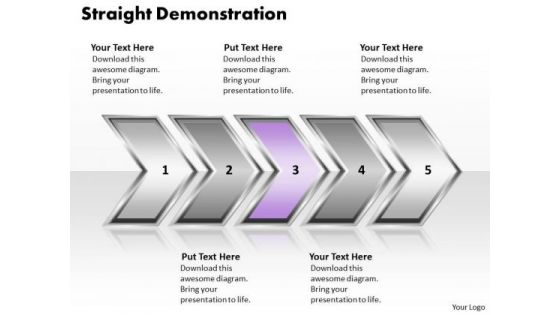
Ppt Straight Demonstration Of Process Using Circular Arrows PowerPoint 2010 Templates
PPT straight demonstration of process using circular arrows powerpoint 2010 Templates-Analyze the six success factors of your business with this linear business chart for Microsoft PowerPoint presentations. This diagram helps you to analyze all the connected ideas and also can be used to show six aspects of an issue. It is a useful captivating tool enables you to define your message in your Marketing PPT presentations. You can apply other 3D Styles and shapes to the slide to enhance your presentations.-PPT straight demonstration of process using circular arrows powerpoint 2010 Templates-Aim, Arrow, Arrowheads, Badge, Border, Click, Connection, Curve, Design, Direction, Download, Element, Fuchsia, Icon, Illustration, Indicator, Internet, Magenta, Mark, Object, Orientation, Pointer, Shadow, Shape, Sign
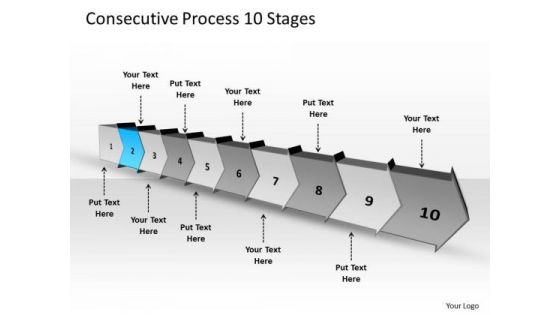
Consecutive Process 10 Stages Creating Flowchart PowerPoint Templates
We present our consecutive process 10 stages creating flowchart PowerPoint templates. Use our Arrows PowerPoint Templates because; you have the ideas to develop the teams vision of where they need to be in the future. Use our Business PowerPoint Templates because, you have played a stellar role and have a few ideas. Use our Shapes PowerPoint Templates because, prove how they mesh to motivate the company team and provide the steam to activate the composite machine. Use our Finance PowerPoint Templates because, our presentation designs are for those on the go. Use our Process and Flows PowerPoint Templates because, they are indicators of the path you have in mind. Use these PowerPoint slides for presentations relating to abstract arrow blank business chart circular circulation concept conceptual consecutive design diagram executive flow icon idea illustration management model numbers organization procedure process. The prominent colors used in the PowerPoint template are Blue, Gray, and Black

Market Assessment Ppt PowerPoint Presentation Model
This is a market assessment ppt powerpoint presentation model. This is a five stage process. The stages in this process are forecasting of sales volume, specification of new product development, target market, indication of product positioning.

Market Assessment Ppt PowerPoint Presentation Files
This is a market assessment ppt powerpoint presentation files. This is a five stage process. The stages in this process are target market, forecasting of sales volume, indication of product positioning, competitor reaction, specification of new product development.
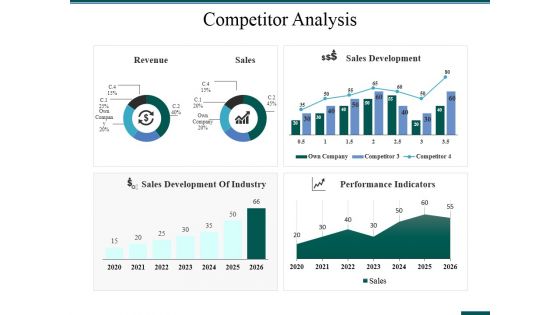
Competitor Analysis Ppt PowerPoint Presentation Model Visual Aids
This is a competitor analysis ppt powerpoint presentation model visual aids. This is a four stage process. The stages in this process are competitor analysis, revenue, sales, sales development, performance indicators.
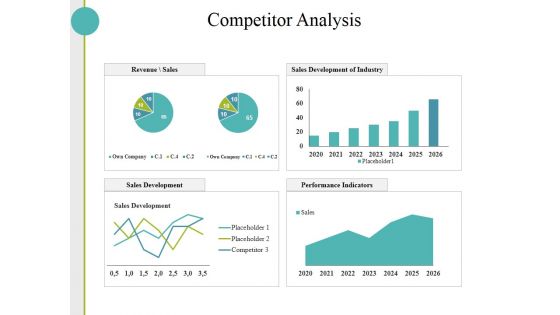
Competitor Analysis Ppt PowerPoint Presentation Layouts Slides
This is a competitor analysis ppt powerpoint presentation layouts slides. This is a four stage process. The stages in this process are sales development, performance indicators, sales development of industry, revenue sales.
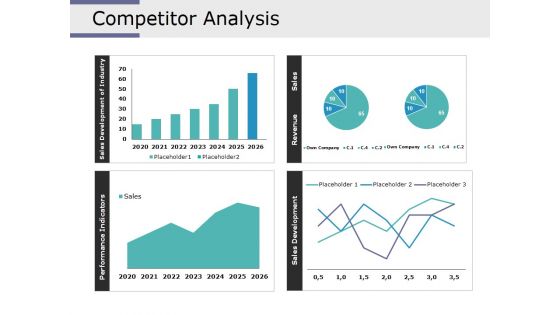
Competitor Analysis Ppt PowerPoint Presentation Model Show
This is a competitor analysis ppt powerpoint presentation model show. This is a four stage process. The stages in this process are performance indicators, sales development of industry, sales development, revenue, sales.

Competitor Analysis Ppt PowerPoint Presentation Samples
This is a competitor analysis ppt powerpoint presentation samples. This is a four stage process. The stages in this process are sales development of industry, performance indicators, sales development, sales.

Competitor Analysis Ppt PowerPoint Presentation Outline Ideas
This is a competitor analysis ppt powerpoint presentation outline ideas. This is a four stage process. The stages in this process are sales development of industry, revenue, sales, performance indicators.
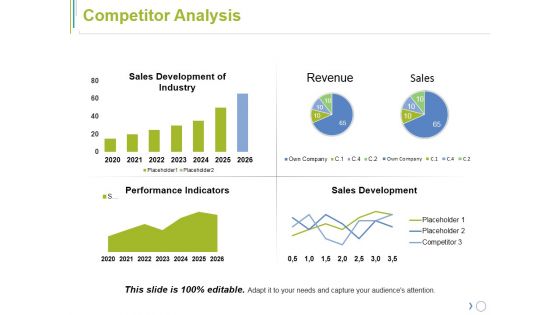
Competitor Analysis Ppt PowerPoint Presentation File Mockup
This is a competitor analysis ppt powerpoint presentation file mockup. This is a four stage process. The stages in this process are sales development of industry, revenue, performance indicators, sales development.

Competitor Analysis Ppt PowerPoint Presentation Layouts Slideshow
This is a competitor analysis ppt powerpoint presentation layouts slideshow. This is a four stage process. The stages in this process are sales development of industry, performance indicators, sales development, revenue, sales.
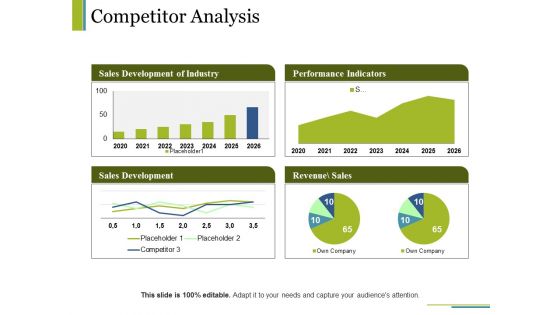
Competitor Analysis Ppt PowerPoint Presentation Visual Aids Model
This is a competitor analysis ppt powerpoint presentation visual aids model. This is a four stage process. The stages in this process are sales development of industry, performance indicators, sales development, revenue sales, business.
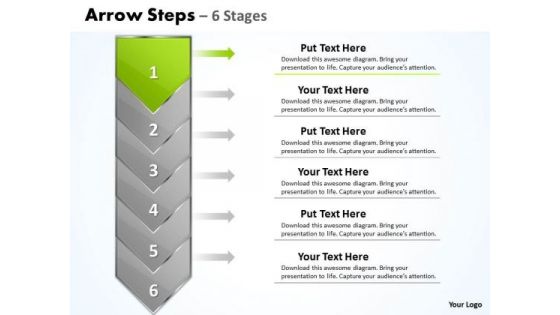
Process PowerPoint Template Arrow 6 Stages 1 Communication Skills Design
We present our process PowerPoint template arrow 6 stages 1 communication skills design. Use our Abstract PowerPoint Templates because; now imprint them on the minds of your audience via our slides. Use our Symbol PowerPoint Templates because, Its also been said that prevention is better than cure, either way you have a store of knowledge for sure. Use our Arrows PowerPoint Templates because, aesthetically designed to make a great first impression this template highlights. Use our Business PowerPoint Templates because, they are indicators of the path you have in mind. Use our Process and Flows PowerPoint Templates because, Brainstorming Light Bulbs: - The atmosphere in the workplace is electric. Use these PowerPoint slides for presentations relating to Arrow, Background, Business, Chart, Diagram, Financial, Graphic, Gray, Icon, Illustration, Management, Orange, Perspective, Planning, Process, Process, Stages, Steps, Text. The prominent colors used in the PowerPoint template are Green, Gray, and Black
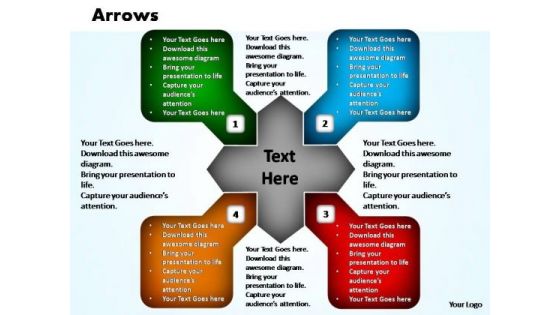
PowerPoint Templates Business Arrows Ppt Slides
PowerPoint Templates Business Arrows PPT Slides-The arrows indicate the progression of the process. Constant monitoring of the processes provides you with opportunities to concentrate on the core competencies in your business and improve the standards for more effective results.-PowerPoint Templates Business Arrows PPT Slides
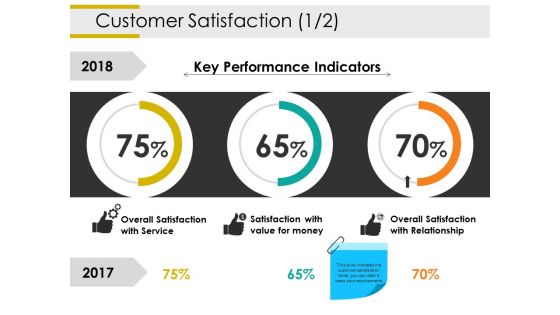
Customer Satisfaction Template 1 Ppt PowerPoint Presentation Portfolio Graphics Example
This is a customer satisfaction template 1 ppt powerpoint presentation portfolio graphics example. This is a three stage process. The stages in this process are overall satisfaction with service, satisfaction with value for money, overall satisfaction with relationship, key performance indicators, business, percentage.
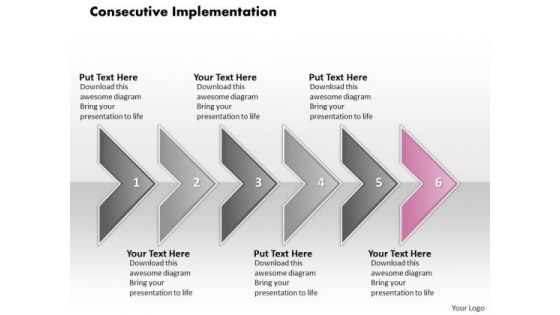
Ppt Consecutive Implementation Of 6 Concepts Through Arrows PowerPoint 2010 Templates
PPT consecutive implementation of 6 concepts through arrows powerpoint 2010 Templates-This arrow diagram is built for presenting different ways for a single process. This power point diagram consists of 6 arrows. Continuous and ongoing process can be shown using this PPT Template.-PPT consecutive implementation of 6 concepts through arrows powerpoint 2010 Templates-Aim, Arrow, Badge, Border, Color, Connection, Curve, Design, Direction, Download, Icon, Illustration, Indicator, Internet, Label, Link, Magenta, Mark, Next, Object, Orientation, Paper, Peeling, Pointer, Rounded, Set, Shadow, Shape, Sign
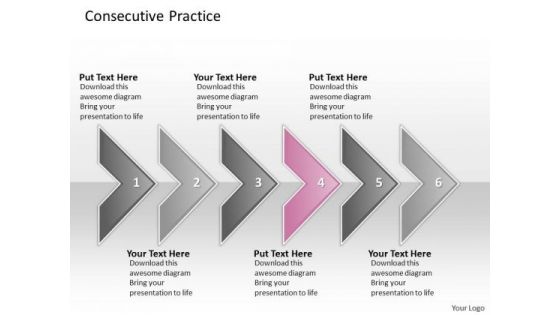
Ppt Consecutive Practice Of 6 Concepts Through Circular Arrows PowerPoint 2010 Templates
PPT consecutive practice of 6 concepts through circular arrows powerpoint 2010 Templates-This arrow diagram is built for presenting different ways for a single process. This power point diagram consists of 6 arrows. Continuous and ongoing process can be shown using this PPT Template.-PPT consecutive practice of 6 concepts through circular arrows powerpoint 2010 Templates-Aim, Arrow, Badge, Border, Color, Connection, Curve, Design, Direction, Download, Icon, Illustration, Indicator, Internet, Label, Link, Magenta, Mark, Next, Object, Orientation, Paper, Peeling, Pointer, Rounded, Set, Shadow, Shape, Sign

Ppt Consecutive Effect Of 6 Concepts Through Arrows PowerPoint Templates
PPT consecutive effect of 6 concepts through arrows powerpoint templates-This diagram organizes, represents and summarizes information so that patterns and relationships can be identified. It aims to inform, influence or convince an audience. Add charm and personality to your presentations with our attractive PPT design-PPT consecutive effect of 6 concepts through arrows powerpoint templates-Aim, Arrow, Badge, Border, Color, Connection, Curve, Design, Direction, Download, Icon, Illustration, Indicator, Internet, Label, Link, Magenta, Mark, Next, Object, Orientation, Paper, Peeling, Pointer, Rounded, Set, Shadow, Shape, Sign
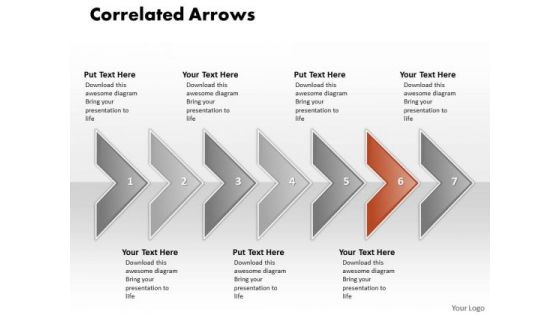
Ppt 7 Phase Diagram Correlated Arrows In Horizontal Line PowerPoint Templates
PPT 7 phase diagram correlated arrows in horizontal line PowerPoint Templates-The above template contains a graphic of seven arrows in straight line. This image signifies the concept of correlated activities. Adjust the above image in your PPT presentations to visually support your content in your PPT slideshows related to Market surveys, Statistics and Analysis. Create captivating presentations to deliver comparative facts and figures.-PPT 7 phase diagram correlated arrows in horizontal line PowerPoint Templates-Aim, Arrow, Badge, Border, Color, Connection, Curve, Design, Direction, Download, Icon, Illustration, Indicator, Internet, Label, Link, Magenta, Mark, Next, Object, Orientation, Paper, Peeling, Pointer, Rounded, Set, Shadow, Shape, Sign
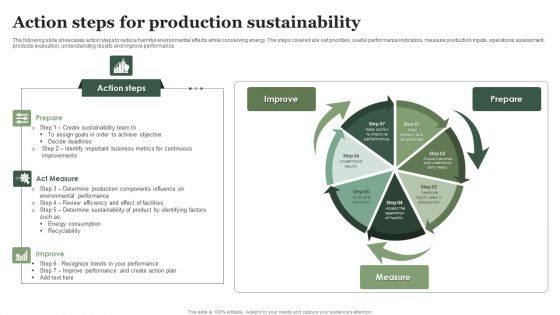
Action Steps For Production Sustainability Ppt Pictures Tips PDF
The following slide showcases action steps to reduce harmful environmental effects while conserving energy. The steps covered are set priorities, useful performance indicators, measure production inputs, operations assessment, products evaluation, understanding results and improve performance. Presenting Action Steps For Production Sustainability Ppt Pictures Tips PDF to dispense important information. This template comprises three stages. It also presents valuable insights into the topics including Action Steps, Act Measure, Improve. This is a completely customizable PowerPoint theme that can be put to use immediately. So, download it and address the topic impactfully.

Ppt Consecutive Execution Of 6 Concepts Through Curved Arrows PowerPoint 2010 Templates
PPT consecutive execution of 6 concepts through curved arrows powerpoint 2010 Templates-The above template displays a diagram of curved arrows. This Diagram is mainly used to depict the progress of sequential steps in the flow or process. It is a powerful tool conceived to enable you to define your message more clearly in your PPT presentations. -PPT consecutive execution of 6 concepts through curved arrows powerpoint 2010 Templates-Aim, Arrow, Badge, Border, Color, Connection, Curve, Design, Direction, Download, Icon, Illustration, Indicator, Internet, Label, Link, Magenta, Mark, Next, Object, Orientation, Paper, Peeling, Pointer, Rounded, Set, Shadow, Shape, Sign

Ppt Consecutive Explanation Of 5 Steps Through Arrows PowerPoint 2010 Templates
PPT consecutive explanation of 5 steps through arrows powerpoint 2010 Templates-This is a type of diagram that represents an algorithm or process, showing the steps as circles. Arrows Indicates the way to growth. Use this diagram for improved controls to drive your business towards the right direction.-PPT consecutive explanation of 5 steps through arrows powerpoint 2010 Templates-3d, Abstract, Arrow, Circle, Circular, Click, Computer, Data, Direction, Graphic, Icon, Illustration, Insignia, Intention, Internet, Isolated, Label, Mail, Mascot, Media, Menu, Motion, Page, Pushing, Search, Shiny, Sign, Simple, Symbol

Ppt Straight Explanation To Represent Seven Steps In Process PowerPoint Templates
PPT straight explanation to represent seven steps in process PowerPoint Templates-Develop competitive advantage with our above Diagram which contains a diagram of horizontal arrows. These arrows are indicators of the path you have in mind. Use them to help you organize the logic of your views-PPT straight explanation to represent seven steps in process PowerPoint Templates-above, aiming, arrow, arrowhead, balance, communicate, communication, connection, descriptive, design, designer, direct, direction, dynamic, element, graphic, high, icon, illustration, inform, internet, journey, multimedia, pointer, reflection, set, shape, sign, signal, straight, symbol, top, transportation, travel, vector
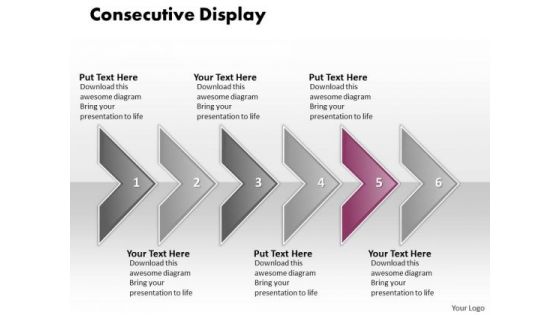
Ppt Consecutive Display Of 6 Concepts Through Curved Arrows PowerPoint 2010 Templates
PPT consecutive display of 6 concepts through curved arrows powerpoint 2010 Templates-This diagram is used to organize information so that it can be accessed more easily. It consists of consecutive arrows. You should understand your target audience and enhance presentations to create the wow effect to your visual delivery.-PPT consecutive display of 6 concepts through curved arrows powerpoint 2010 Templates-Aim, Arrow, Badge, Border, Color, Connection, Curve, Design, Direction, Download, Icon, Illustration, Indicator, Internet, Label, Link, Magenta, Mark, Next, Object, Orientation, Paper, Peeling, Pointer, Rounded, Set, Shadow, Shape, Sign
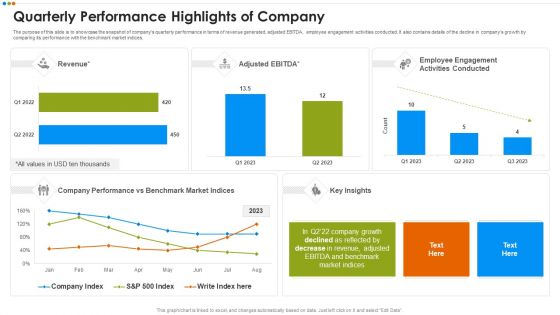
Quarterly Budget Analysis Of Business Organization Quarterly Performance Highlights Of Company Graphics PDF
The purpose of this slide is to showcase the snapshot of companys quarterly performance in terms of revenue generated, adjusted EBITDA, employee engagement activities conducted. It also contains details of the decline in companys growth by comparing its performance with the benchmark market indices.This is a Quarterly Budget Analysis Of Business Organization Quarterly Performance Highlights Of Company Graphics PDF template with various stages. Focus and dispense information on two stages using this creative set, that comes with editable features. It contains large content boxes to add your information on topics like Quarterly Performance Highlights Of Company You can also showcase facts, figures, and other relevant content using this PPT layout. Grab it now.

Industry 4 0 Readiness Assessment For Food Manufacturing Sector Portrait PDF
This slide indicates the industry 4.0 readiness assessment for food manufacturing sector. It also provides the information regarding the food value chain segments, key drivers along with industry 4.0 impact and ease of implementation. Coming up with a presentation necessitates that the majority of the effort goes into the content and the message you intend to convey. The visuals of a PowerPoint presentation can only be effective if it supplements and supports the story that is being told. Keeping this in mind our experts created Industry 4 0 Readiness Assessment For Food Manufacturing Sector Portrait PDF to reduce the time that goes into designing the presentation. This way, you can concentrate on the message while our designers take care of providing you with the right template for the situation.

Projected Key Financials Template Ppt PowerPoint Presentation Styles Graphics Design
This is a projected key financials template ppt powerpoint presentation styles graphics design. This is a four stage process. The stages in this process are sales, gross profit, net profit.

Series Of Actions To Achieve Result 6 Stages Business Plan Program PowerPoint Templates
We present our series of actions to achieve result 6 stages business plan program PowerPoint templates.Use our Process and Flows PowerPoint Templates because they enhance the essence of your viable ideas. Download and present our Arrows PowerPoint Templates because they will help you to organise the logic of your views. Use our Shapes PowerPoint Templates because the Gear train is a basic element of living and daily business. Present our Business PowerPoint Templates because project your ideas to you colleagues and complete the full picture. Download our Signs PowerPoint Templates because you have played a stellar role and have a few ideas.Use these PowerPoint slides for presentations relating to Arrows, cold, design, diagram, directional, drop, element, fahrenheit, flow, gauge, graph, graphic, green, heat, hot, icon, illustration, info graphic, orange, pointer, process, progress, red, segments, set, shadow, steps. The prominent colors used in the PowerPoint template are Blue, White, Gray. People tell us our series of actions to achieve result 6 stages business plan program PowerPoint templates will make the presenter successul in his career/life. You can be sure our drop PowerPoint templates and PPT Slides are Lush. People tell us our series of actions to achieve result 6 stages business plan program PowerPoint templates are Whimsical. PowerPoint presentation experts tell us our element PowerPoint templates and PPT Slides help you meet deadlines which are an element of today's workplace. Just browse and pick the slides that appeal to your intuitive senses. You can be sure our series of actions to achieve result 6 stages business plan program PowerPoint templates are Colorful. People tell us our drop PowerPoint templates and PPT Slides are Detailed.
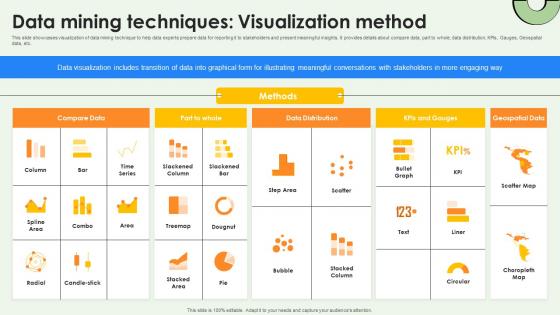
Data Warehousing And Data Mining Techniques Visualization Method AI SS V
This slide showcases visualization of data mining technique to help data experts prepare data for reporting it to stakeholders and present meaningful insights. It provides details about compare data, part to whole, data distribution, KPIs, Gauges, Geospatial data, etc. Find a pre-designed and impeccable Data Warehousing And Data Mining Techniques Visualization Method AI SS V. The templates can ace your presentation without additional effort. You can download these easy-to-edit presentation templates to make your presentation stand out from others. So, what are you waiting for Download the template from Slidegeeks today and give a unique touch to your presentation.
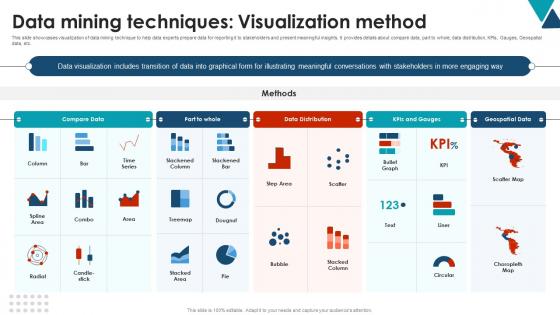
Data Mining Techniques Visualization Method Using Data Mining Tools To Optimize Processes AI SS V
This slide showcases visualization of data mining technique to help data experts prepare data for reporting it to stakeholders and present meaningful insights. It provides details about compare data, part to whole, data distribution, KPIs, Gauges, Geospatial data, etc. Here you can discover an assortment of the finest PowerPoint and Google Slides templates. With these templates, you can create presentations for a variety of purposes while simultaneously providing your audience with an eye-catching visual experience. Download Data Mining Techniques Visualization Method Using Data Mining Tools To Optimize Processes AI SS V to deliver an impeccable presentation. These templates will make your job of preparing presentations much quicker, yet still, maintain a high level of quality. Slidegeeks has experienced researchers who prepare these templates and write high-quality content for you. Later on, you can personalize the content by editing the Data Mining Techniques Visualization Method Using Data Mining Tools To Optimize Processes AI SS V.

Business Plan Speedometer Future PowerPoint Template 1110
A speedometer with needle pointing to the words Business Plan

Speedometer Diagram For Growth Analysis Powerpoint Template

Business Framework PowerPoint Speedometer PowerPoint Presentation
This image slide displays speedometer diagram with download and upload speed template. This innovative image slide has been designed to depict progress. This image slide is 100% editable. You may change color, size and orientation of any icon to your liking. This image slide may be used in school, business and social presentations. Create amazing presentations using this image slide.
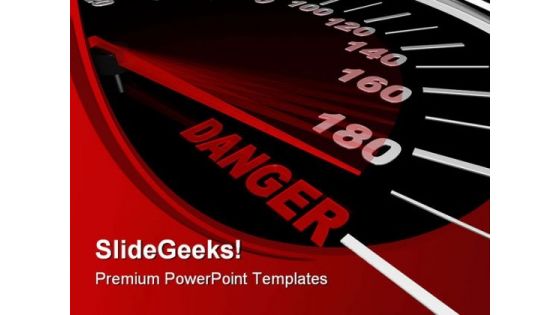
Speedometer Shows Danger Travel PowerPoint Themes And PowerPoint Slides 0411
Microsoft PowerPoint Theme and Slide with danger word on speedometer

Speedometer Shows Win Metaphor PowerPoint Themes And PowerPoint Slides 0811
Microsoft PowerPoint Theme and Slide with a speedometer with red needle speeding to the word win

Smart Meter Working To Analyse Consumption Internet Of Things Solutions To Enhance Energy IoT SS V
This slide includes smart meters that measure and transmit energy consumption data for efficient monitoring. It includes steps such as collection of data, transmission of data, consumption pattern analysis, and monitoring. Slidegeeks has constructed Smart Meter Working To Analyse Consumption Internet Of Things Solutions To Enhance Energy IoT SS V after conducting extensive research and examination. These presentation templates are constantly being generated and modified based on user preferences and critiques from editors. Here, you will find the most attractive templates for a range of purposes while taking into account ratings and remarks from users regarding the content. This is an excellent jumping-off point to explore our content and will give new users an insight into our top-notch PowerPoint Templates.

Revenue Performance Reporting Speedometer Ppt PowerPoint Presentation Visuals
This is a revenue performance reporting speedometer ppt powerpoint presentation visuals. This is a four stage process. The stages in this process are speedometer, measurement, business, marketing, finance.
Speedometer Vector Icon Ppt Powerpoint Presentation Gallery Objects
This is a speedometer vector icon ppt powerpoint presentation gallery objects. This is a four stage process. The stages in this process are accelerator, seed accelerators, startup accelerator.
Analytics Icon Dashboard Speedometer Ppt PowerPoint Presentation Complete Deck
Presenting this set of slides with name analytics icon dashboard speedometer ppt powerpoint presentation complete deck. The topics discussed in these slides are dashboard, speedometer, key performance, business, automobile. This is a completely editable PowerPoint presentation and is available for immediate download. Download now and impress your audience.
Speedometer Performance Indicator Vector Icon Ppt PowerPoint Presentation Show Deck PDF
Presenting this set of slides with name speedometer performance indicator vector icon ppt powerpoint presentation show deck pdf. This is a three stage process. The stages in this process are speedometer performance indicator vector icon. This is a completely editable PowerPoint presentation and is available for immediate download. Download now and impress your audience.

Electronic Indicator Device Speedometer Ppt PowerPoint Presentation Complete Deck With Slides
If designing a presentation takes a lot of your time and resources and you are looking for a better alternative, then this electronic indicator device speedometer ppt powerpoint presentation complete deck with slides is the right fit for you. This is a prefabricated set that can help you deliver a great presentation on the topic. All the twelve slides included in this sample template can be used to present a birds-eye view of the topic. These slides are also fully editable, giving you enough freedom to add specific details to make this layout more suited to your business setting. Apart from the content, all other elements like color, design, theme are also replaceable and editable. This helps in designing a variety of presentations with a single layout. Not only this, you can use this PPT design in formats like PDF, PNG, and JPG once downloaded. Therefore, without any further ado, download and utilize this sample presentation as per your liking.
Risk Meter Indicating Extreme Level Ppt PowerPoint Presentation Icon Template
This is a risk meter indicating extreme level ppt powerpoint presentation icon template. This is a five stage process. The stages in this process are risk meter, risk speedometer, hazard meter.
Business Plan03 PowerPoint Icon C
A speedometer with needle pointing to the words Business Plan
Business Plan03 PowerPoint Icon Cc
A speedometer with needle pointing to the words Business Plan
Business Plan03 PowerPoint Icon S
A speedometer with needle pointing to the words Business Plan

Speedometer Slow To Fast Travel PowerPoint Themes And PowerPoint Slides 0911
Microsoft PowerPoint Theme and Slide with a speedometer with needle racing to the words
Fast Word On Speedometer Travel PowerPoint Themes And PowerPoint Slides 0511
Microsoft PowerPoint Theme and Slide with The word fast on a speedometer with red needle pointing to it
Vehicle Dashboard With Speedometer Vector Icon Ppt PowerPoint Presentation Portfolio Graphics PDF
Presenting vehicle dashboard with speedometer vector icon ppt powerpoint presentation portfolio graphics pdf to dispense important information. This template comprises three stages. It also presents valuable insights into the topics including vehicle dashboard with speedometer vector icon. This is a completely customizable PowerPoint theme that can be put to use immediately. So, download it and address the topic impactfully.
Speedometer On Human Hand Vector Icon Ppt PowerPoint Presentation Outline Icons PDF
Presenting this set of slides with name speedometer on human hand vector icon ppt powerpoint presentation outline icons pdf. This is a three stage process. The stages in this process are speedometer on human hand vector icon. This is a completely editable PowerPoint presentation and is available for immediate download. Download now and impress your audience.
Speedometer Compass Round Shape Vector Icon Ppt PowerPoint Presentation Gallery Design Inspiration PDF
Presenting this set of slides with name speedometer compass round shape vector icon ppt powerpoint presentation gallery design inspiration pdf. This is a three stage process. The stages in this process are speedometer compass round shape vector icon. This is a completely editable PowerPoint presentation and is available for immediate download. Download now and impress your audience.
Speedometer Dashboard Vector Icon Ppt PowerPoint Presentation File Designs Download PDF
Presenting this set of slides with name speedometer dashboard vector icon ppt powerpoint presentation file designs download pdf. This is a four stage process. The stages in this process are speedometer dashboard vector icon. This is a completely editable PowerPoint presentation and is available for immediate download. Download now and impress your audience.
Vector Illustration Of Speedometer Vector Icon Ppt PowerPoint Presentation Ideas Slides PDF
Persuade your audience using this vector illustration of speedometer vector icon ppt powerpoint presentation ideas slides pdf. This PPT design covers three stages, thus making it a great tool to use. It also caters to a variety of topics including vector illustration of speedometer vector icon. Download this PPT design now to present a convincing pitch that not only emphasizes the topic but also showcases your presentation skills.
Speedometer Vehicle Dashboard Vector Icon Ppt PowerPoint Presentation Ideas Design Inspiration PDF
Persuade your audience using this speedometer vehicle dashboard vector icon ppt powerpoint presentation ideas design inspiration pdf. This PPT design covers three stages, thus making it a great tool to use. It also caters to a variety of topics including speedometer vehicle dashboard vector icon. Download this PPT design now to present a convincing pitch that not only emphasizes the topic but also showcases your presentation skills.
Vehicle Speedometer Dashboard Vector Icon Ppt PowerPoint Presentation Slides Show PDF
Persuade your audience using this vehicle speedometer dashboard vector icon ppt powerpoint presentation slides show pdf. This PPT design covers three stages, thus making it a great tool to use. It also caters to a variety of topics including vehicle speedometer dashboard vector icon. Download this PPT design now to present a convincing pitch that not only emphasizes the topic but also showcases your presentation skills.

Picture Showing Speedometer Of Bike Ppt PowerPoint Presentation File Shapes PDF
Presenting picture showing speedometer of bike ppt powerpoint presentation file shapes pdf to dispense important information. This template comprises three stages. It also presents valuable insights into the topics including picture showing speedometer of bike. This is a completely customizable PowerPoint theme that can be put to use immediately. So, download it and address the topic impactfully.

Electric Car Speedometer Travel PowerPoint Templates And PowerPoint Backgrounds 0211
Microsoft PowerPoint Template and Background with speedometer
Speedometer Shows Danger Travel PowerPoint Templates And PowerPoint Backgrounds 0411
Microsoft PowerPoint Template and Background with danger word on speedometer

Speedometer Yes I Can Business PowerPoint Template 1110
A speedometer with red needle pointing to Yes I Did It symbolizing self confidence

Speedometer Shows Win Metaphor PowerPoint Templates And PowerPoint Backgrounds 0811
Microsoft PowerPoint Template and Background with a speedometer with red needle speeding to the word win
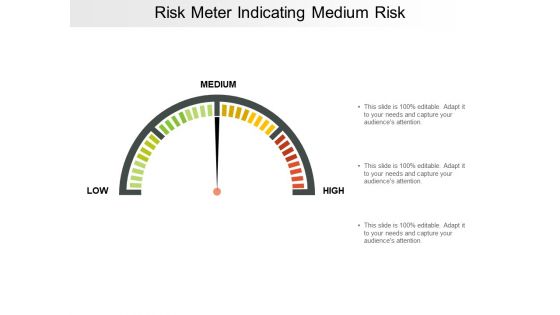
Risk Meter Indicating Medium Risk Ppt PowerPoint Presentation Ideas Graphics
This is a risk meter indicating medium risk ppt powerpoint presentation ideas graphics. This is a three stage process. The stages in this process are risk meter, risk speedometer, hazard meter.

Marketing Speedometer Dashboard Report Ppt PowerPoint Presentation Designs Download
This is a marketing speedometer dashboard report ppt powerpoint presentation designs download. This is a four stage process. The stages in this process are dashboard, measurement, percentage, business, finance.

Three Levels Risk Assessment Meter Ppt PowerPoint Presentation Infographics Themes
This is a three levels risk assessment meter ppt powerpoint presentation infographics themes. This is a three stage process. The stages in this process are risk meter, risk speedometer, hazard meter.

Business Diagram Three Meters For Speed Control Presentation Template
Graphic of three speedometers has been used to design this power point template. This diagram contains the concept of speed control. Amplify your thoughts via this appropriate business template.

Drunk Buzzed Business PowerPoint Themes And PowerPoint Slides 0811
Microsoft PowerPoint Theme and Slide with a speedometer measuring how drunk the driver is

Speeding Toward Victory Success PowerPoint Themes And PowerPoint Slides 0311
Microsoft PowerPoint Theme and Slide with a speedometer showing the needle pushing toward the word victory
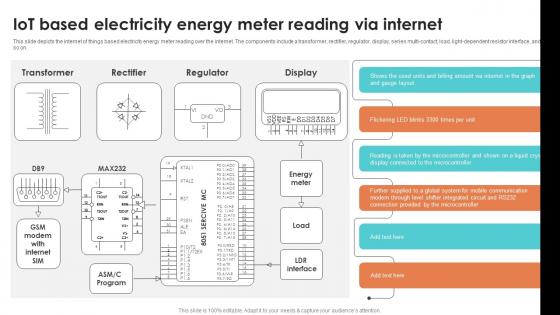
IoT Based Electricity Energy Meter Reading Via Internet Smart Grid Working
This slide depicts the internet of things based electricity energy meter reading over the internet. The components include a transformer, rectifier, regulator, display, series multi contact, load, light dependent resistor interface, and so on. Coming up with a presentation necessitates that the majority of the effort goes into the content and the message you intend to convey. The visuals of a PowerPoint presentation can only be effective if it supplements and supports the story that is being told. Keeping this in mind our experts created IoT Based Electricity Energy Meter Reading Via Internet Smart Grid Working to reduce the time that goes into designing the presentation. This way, you can concentrate on the message while our designers take care of providing you with the right template for the situation.
Speedometer Slow To Fast Travel PowerPoint Templates And PowerPoint Backgrounds 0911
Microsoft PowerPoint Template and Background with a speedometer with needle racing to the words
Fast Word On Speedometer Travel PowerPoint Templates And PowerPoint Backgrounds 0511
Microsoft PowerPoint Template and Background with The word fast on a speedometer with red needle pointing to it

Empowering The Future Introduction To Smart Meters Overview And Role IoT SS V
This slide exhibits information about smart meters that enable efficient data collection on energy utilisation. It covers benefits such as real-time monitoring, accurate billing, and remote management. Are you searching for a Empowering The Future Introduction To Smart Meters Overview And Role IoT SS V that is uncluttered, straightforward, and original Its easy to edit, and you can change the colors to suit your personal or business branding. For a presentation that expresses how much effort you have put in, this template is ideal With all of its features, including tables, diagrams, statistics, and lists, its perfect for a business plan presentation. Make your ideas more appealing with these professional slides. Download Empowering The Future Introduction To Smart Meters Overview And Role IoT SS V from Slidegeeks today.

Risk Meters Showing Risk Levels Ppt PowerPoint Presentation Summary Example
This is a risk meters showing risk levels ppt powerpoint presentation summary example. This is a three stage process. The stages in this process are risk meter, risk speedometer, hazard meter.
Getting The Job PowerPoint Icon C
A speedometer needle speeds past the various stages of getting a job-the resume the interview and success!
Getting The Job PowerPoint Icon S
A speedometer needle speeds past the various stages of getting a job-the resume the interview and success!

Key Applications Of IoT Based Smart Meters Internet Of Things Solutions To Enhance Energy IoT SS V
This slide exhibits use cases of smart meters, contributing to sustainable and robust energy infrastructure. It includes applications such as demand response programs, grid management and optimization, and energy consumption monitoring. The Key Applications Of IoT Based Smart Meters Internet Of Things Solutions To Enhance Energy IoT SS V is a compilation of the most recent design trends as a series of slides. It is suitable for any subject or industry presentation, containing attractive visuals and photo spots for businesses to clearly express their messages. This template contains a variety of slides for the user to input data, such as structures to contrast two elements, bullet points, and slides for written information. Slidegeeks is prepared to create an impression.
Good Better Best Rating Meter With Icons Ppt Powerpoint Presentation Outline Vector
This is a good better best rating meter with icons ppt powerpoint presentation outline vector. This is a three stage process. The stages in this process are good better best, good great superb, good great excellent.
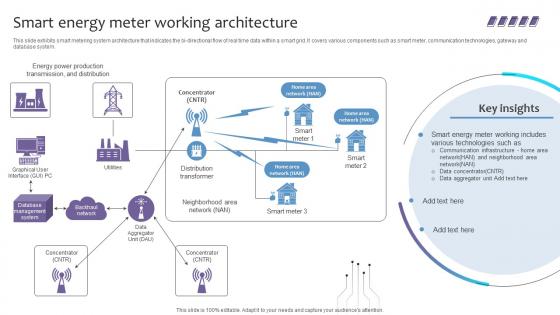
Empowering The Future Smart Energy Meter Working Architecture IoT SS V
This slide exhibits smart metering system architecture that indicates the bi-directional flow of real time data within a smart grid. It covers various components such as smart meter, communication technologies, gateway and database system. Make sure to capture your audiences attention in your business displays with our gratis customizable Empowering The Future Smart Energy Meter Working Architecture IoT SS V. These are great for business strategies, office conferences, capital raising or task suggestions. If you desire to acquire more customers for your tech business and ensure they stay satisfied, create your own sales presentation with these plain slides.

Hazard Meter Showing Three Danger Levels Ppt PowerPoint Presentation Infographic Template Examples
This is a hazard meter showing three danger levels ppt powerpoint presentation infographic template examples. This is a five stage process. The stages in this process are risk meter, risk speedometer, hazard meter.
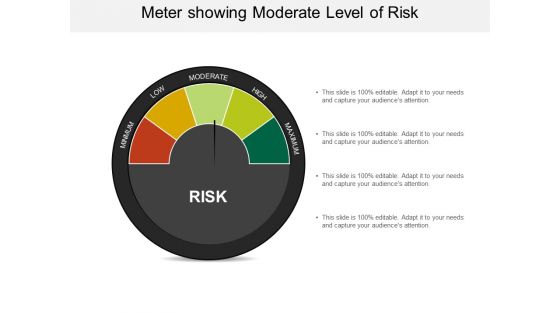
Meter Showing Moderate Level Of Risk Ppt PowerPoint Presentation Model Summary
This is a meter showing moderate level of risk ppt powerpoint presentation model summary. This is a four stage process. The stages in this process are risk meter, risk speedometer, hazard meter.

Risk Meter With Pointer In Center Showing Medium Level Ppt PowerPoint Presentation Portfolio Templates
This is a risk meter with pointer in center showing medium level ppt powerpoint presentation portfolio templates. This is a three stage process. The stages in this process are risk meter, risk speedometer, hazard meter.

Empowering The Future Smart Meter Role And Functionality In Smart Grid IoT SS V
This slide highlights the role of smart meters in smart grid management which helps to optimise energy usage. Some of the roles include power quality measurement, remote programming, remote controlling, demand-based tariff, etc. This Empowering The Future Smart Meter Role And Functionality In Smart Grid IoT SS V is perfect for any presentation, be it in front of clients or colleagues. It is a versatile and stylish solution for organizing your meetings. The Empowering The Future Smart Meter Role And Functionality In Smart Grid IoT SS V features a modern design for your presentation meetings. The adjustable and customizable slides provide unlimited possibilities for acing up your presentation. Slidegeeks has done all the homework before launching the product for you. So, do not wait, grab the presentation templates today
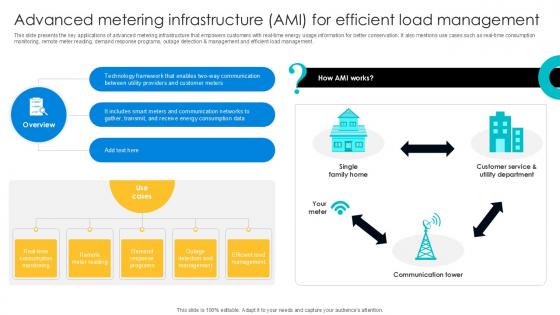
Advanced Metering Infrastructure Digital Transformation Journey PPT Slide DT SS V
This slide presents the key applications of advanced metering infrastructure that empowers customers with real-time energy usage information for better conservation. It also mentions use cases such as real-time consumption monitoring, remote meter reading, demand response programs, outage detection and management and efficient load management. Boost your pitch with our creative Advanced Metering Infrastructure Digital Transformation Journey PPT Slide DT SS V. Deliver an awe-inspiring pitch that will mesmerize everyone. Using these presentation templates you will surely catch everyones attention. You can browse the ppts collection on our website. We have researchers who are experts at creating the right content for the templates. So you do not have to invest time in any additional work. Just grab the template now and use them.
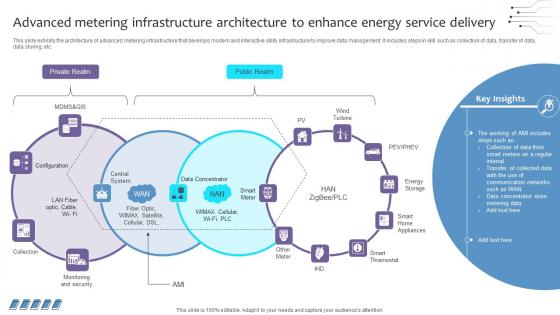
Empowering The Future Advanced Metering Infrastructure Architecture To Enhance IoT SS V
This slide exhibits the architecture of advanced metering infrastructure that develops modern and interactive utility infrastructure to improve data management. It includes steps in AMI such as collection of data, transfer of data, data storing, etc. There are so many reasons you need a Empowering The Future Advanced Metering Infrastructure Architecture To Enhance IoT SS V. The first reason is you can not spend time making everything from scratch, Thus, Slidegeeks has made presentation templates for you too. You can easily download these templates from our website easily.

Empowering The Future Key Components Of Advanced Metering Infrastructure IoT SS V
This slide exhibits components of advanced metering infrastructure that optimize utility operations and improve energy management. It covers there main components such as smart meter, communication network, and data management system. Do you have to make sure that everyone on your team knows about any specific topic I yes, then you should give Empowering The Future Key Components Of Advanced Metering Infrastructure IoT SS V a try. Our experts have put a lot of knowledge and effort into creating this impeccable Empowering The Future Key Components Of Advanced Metering Infrastructure IoT SS V. You can use this template for your upcoming presentations, as the slides are perfect to represent even the tiniest detail. You can download these templates from the Slidegeeks website and these are easy to edit. So grab these today

Smart Meters Overview And Role In Modern Internet Of Things Solutions To Enhance Energy IoT SS V
This slide exhibits information about smart meters that enable efficient data collection on energy utilisation. It covers benefits such as real-time monitoring, accurate billing, and remote management. Presenting this PowerPoint presentation, titled Smart Meters Overview And Role In Modern Internet Of Things Solutions To Enhance Energy IoT SS V, with topics curated by our researchers after extensive research. This editable presentation is available for immediate download and provides attractive features when used. Download now and captivate your audience. Presenting this Smart Meters Overview And Role In Modern Internet Of Things Solutions To Enhance Energy IoT SS V. Our researchers have carefully researched and created these slides with all aspects taken into consideration. This is a completely customizable Smart Meters Overview And Role In Modern Internet Of Things Solutions To Enhance Energy IoT SS V that is available for immediate downloading. Download now and make an impact on your audience. Highlight the attractive features available with our PPTs.

Speeding Towards Future PowerPoint Themes And PowerPoint Slides 0811
Microsoft PowerPoint Theme and Slide with the red needle on a speedometer points to the phrase speeding toward a bright future
Dashboards For Measuring Business Performance Ppt Icon
This is a dashboards for measuring business performance ppt icon. This is a three stage process. The stages in this process are dashboard, measuring, management, speedometer, icons, strategy.

HR Innovation Program Performance Indicators Ppt Powerpoint Presentation Complete Deck With Slides
Use this HR Innovation Program Performance Indicators Ppt Powerpoint Presentation Complete Deck With Slides to ensure the business world gets to know you as a presentation expert with tremendous recall value. With its focus on providing the worlds best designs to highlight business ideas that have the potential to change the world, this PPT Template is sure to win you clients. The complete deck in ninteen slides is a compendium of information, structured in a manner that provides the best framework for a presentation. Use this completely editable and customizable presentation to make an impact and improve your order book. Download now.
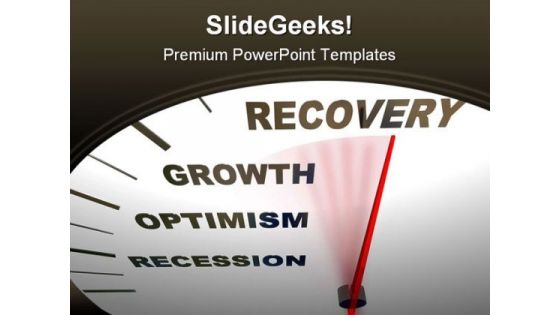
Recovery Future PowerPoint Template 0610
A speedometer with red needle pointing to Recovery rising up from Recession
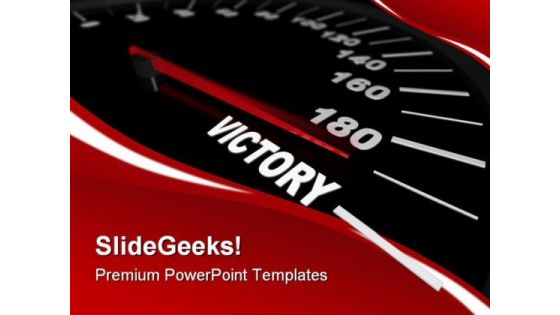
Speeding Toward Victory Success PowerPoint Templates And PowerPoint Backgrounds 0311
Microsoft PowerPoint Template and Background with a speedometer showing the needle pushing toward the word victory

Drunk Buzzed Business PowerPoint Templates And PowerPoint Backgrounds 0811
Microsoft PowerPoint Template and Background with a speedometer measuring how drunk the driver is
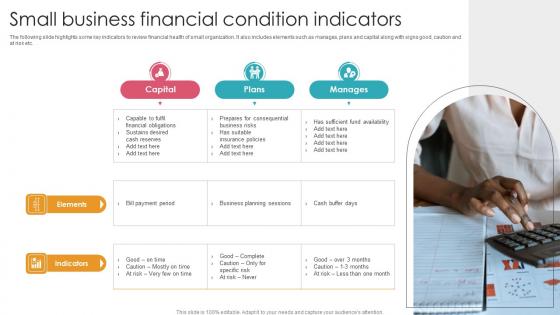
Small Business Financial Condition Indicators Themes Pdf
The following slide highlights some key indicators to review financial health of small organization. It also includes elements such as manages, plans and capital along with signs good, caution and at risk etc. Showcasing this set of slides titled Small Business Financial Condition Indicators Themes Pdf. The topics addressed in these templates are Elements, Indicators, Sustains Desired Cash Reserves. All the content presented in this PPT design is completely editable. Download it and make adjustments in color, background, font etc. as per your unique business setting.
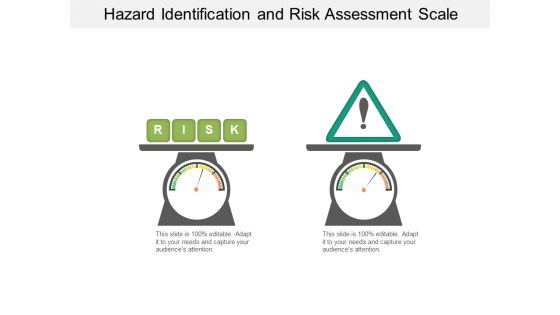
Hazard Identification And Risk Assessment Scale Ppt PowerPoint Presentation File Aids
This is a hazard identification and risk assessment scale ppt powerpoint presentation file aids. This is a two stage process. The stages in this process are risk meter, risk speedometer, hazard meter.
Client Self Service Key Performance Indicators Icons Pdf
The following slide highlights key performance indicators of customer self service to offer enterprises actual and desired cost of support, measure efficiency etc. It includes key performance indicators such as net promoter score, customer effort score, self-service re-contact rate, conversion ratio and case deflection rate. Pitch your topic with ease and precision using this Client Self Service Key Performance Indicators Icons Pdf. This layout presents information on Description, Target, Actual. It is also available for immediate download and adjustment. So, changes can be made in the color, design, graphics or any other component to create a unique layout.

Business Ppt Arrow Create PowerPoint Macro 4 Stages Management Graphic
We present our Business PPT arrow create PowerPoint macro 4 stages management Graphic. Use our Arrows PowerPoint Templates because, designed to help bullet-point your views and thoughts. Use our Process and Flows PowerPoint Templates because, it is in your DNA to analyses possible causes to the minutest detail. Use our Business PowerPoint Templates because, they are indicators of the path you have in mind. Use our Marketing PowerPoint Templates because; in any endeavor people matter most. Use our Shapes PowerPoint Templates because; Blaze a brilliant trail from point to point. Use these PowerPoint slides for presentations relating to Algorithm, Arrow, Chart, Block, Diagram, Business, Chart, Connection, Design, Development, Diagram, Direction, Element, Flow, Chart, Flow, Diagram, Flowchart, Graph, Kind, Of, Diagram, Linear, Diagram, Management, Model, Module, Motion, Organization, Plan, Process, Arrows, Process, Chart, Process, Diagram, Process, Flow, Program, Section, Segment, Set, Sign, Solution, Strategy, Symbol, Technology. The prominent colors used in the PowerPoint template are Blue, Gray, and Black

Pericardiocentesis Indications In Powerpoint And Google Slides Cpb
Presenting our innovatively designed set of slides titled Pericardiocentesis Indications In Powerpoint And Google Slides Cpb This completely editable PowerPoint graphic exhibits Pericardiocentesis Indications that will help you convey the message impactfully. It can be accessed with Google Slides and is available in both standard screen and widescreen aspect ratios. Apart from this, you can download this well structured PowerPoint template design in different formats like PDF, JPG, and PNG. So, click the download button now to gain full access to this PPT design.
Icon Indicating Business Sustainability For Future Ppt Template SS
The following slide exhibits strategic account plan to retain customers. It involves information about customer, their issues, vision, long term short term objectives etc. Coming up with a presentation necessitates that the majority of the effort goes into the content and the message you intend to convey. The visuals of a PowerPoint presentation can only be effective if it supplements and supports the story that is being told. Keeping this in mind our experts created Icon Indicating Business Sustainability For Future Ppt Template SS to reduce the time that goes into designing the presentation. This way, you can concentrate on the message while our designers take care of providing you with the right template for the situation.
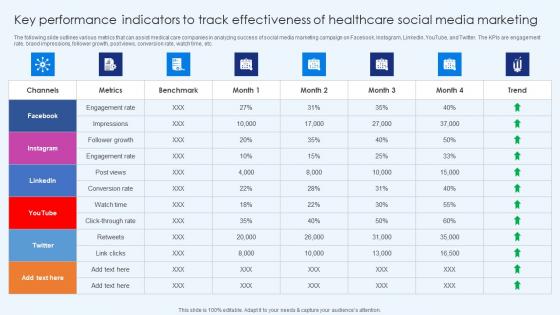
Key Performance Indicators To Tracks Effectiveness Healthcare Promotion Diagrams Pdf
The following slide outlines various metrics that can assist medical care companies in analyzing success of social media marketing campaign on Facebook, Instagram, LinkedIn, YouTube, and Twitter. The KPIs are engagement rate, brand impressions, follower growth, post views, conversion rate, watch time, etc. Slidegeeks has constructed Key Performance Indicators To Tracks Effectiveness Healthcare Promotion Diagrams Pdf after conducting extensive research and examination. These presentation templates are constantly being generated and modified based on user preferences and critiques from editors. Here, you will find the most attractive templates for a range of purposes while taking into account ratings and remarks from users regarding the content. This is an excellent jumping-off point to explore our content and will give new users an insight into our top-notch PowerPoint Templates.

Framework Indicating Corporate Sustainability Innovation Ppt Slide SS
The following slide showcases strategic account action plan on quarter basis for breaking annual planning in small parts and achieve goals effectively. It involves account objectives and strategies to review the outcomes of last quarter and improve it. Crafting an eye-catching presentation has never been more straightforward. Let your presentation shine with this tasteful yet straightforward Framework Indicating Corporate Sustainability Innovation Ppt Slide SS template. It offers a minimalistic and classy look that is great for making a statement. The colors have been employed intelligently to add a bit of playfulness while still remaining professional. Construct the ideal Framework Indicating Corporate Sustainability Innovation Ppt Slide SS that effortlessly grabs the attention of your audience Begin now and be certain to wow your customers

Flowchart Indicating Activities Of Blockchain Logistics Blockchain Transportation Summary Pdf
This slide represents blockchain oriented logistics flowchart which can help manufacturers increase efficiency and profitability of managing supply chain. It provides details about financial flow, insurance company, smart contract service, cyber physical system, etc. Find highly impressive Flowchart Indicating Activities Of Blockchain Logistics Blockchain Transportation Summary Pdf on Slidegeeks to deliver a meaningful presentation. You can save an ample amount of time using these presentation templates. No need to worry to prepare everything from scratch because Slidegeeks experts have already done a huge research and work for you. You need to download Flowchart Indicating Activities Of Blockchain Logistics Blockchain Transportation Summary Pdf for your upcoming presentation. All the presentation templates are 100 percent editable and you can change the color and personalize the content accordingly. Download now
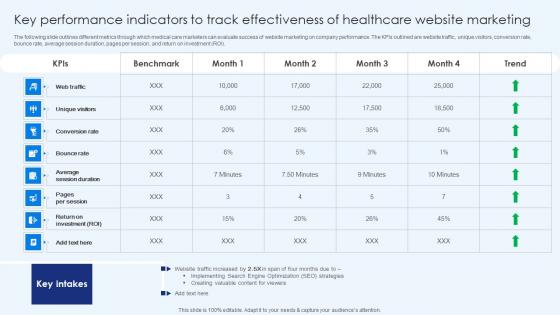
Key Performance Indicators To Track Effectiveness Healthcare Promotion Portrait Pdf
The following slide outlines different metrics through which medical care marketers can evaluate success of website marketing on company performance. The KPIs outlined are website traffic, unique visitors, conversion rate, bounce rate, average session duration, pages per session, and return on investment ROI. Are you searching for a Key Performance Indicators To Track Effectiveness Healthcare Promotion Portrait Pdf that is uncluttered, straightforward, and original Its easy to edit, and you can change the colors to suit your personal or business branding. For a presentation that expresses how much effort you have put in, this template is ideal With all of its features, including tables, diagrams, statistics, and lists, its perfect for a business plan presentation. Make your ideas more appealing with these professional slides. Download Key Performance Indicators To Track Effectiveness Healthcare Promotion Portrait Pdffrom Slidegeeks today.
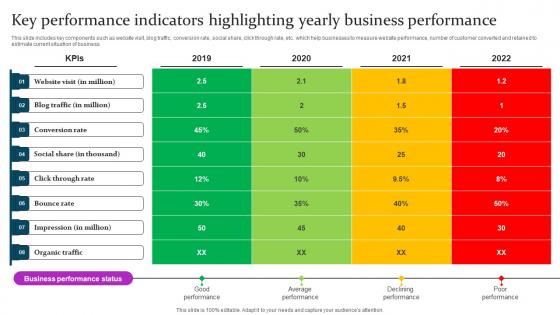
Key Performance Indicators Marketing Mix Communication Guide Client Elements Pdf
This slide includes key components such as website visit, blog traffic, conversion rate, social share, click through rate, etc. which help businesses to measure website performance, number of customer converted and retained to estimate current situation of business. Whether you have daily or monthly meetings, a brilliant presentation is necessary. Key Performance Indicators Marketing Mix Communication Guide Client Elements Pdf can be your best option for delivering a presentation. Represent everything in detail using Key Performance Indicators Marketing Mix Communication Guide Client Elements Pdf and make yourself stand out in meetings. The template is versatile and follows a structure that will cater to your requirements. All the templates prepared by Slidegeeks are easy to download and edit. Our research experts have taken care of the corporate themes as well. So, give it a try and see the results.
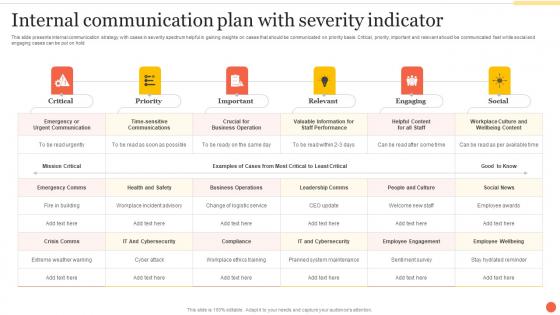
Internal Communication Plan With Severity Indicator Ppt Infographics Infographic Template Pdf
This slide presents internal communication strategy with cases in severity spectrum helpful in gaining insights on cases that should be communicated on priority basis. Critical, priority, important and relevant should be communicated fast while social and engaging cases can be put on hold. Pitch your topic with ease and precision using this Internal Communication Plan With Severity Indicator Ppt Infographics Infographic Template Pdf. This layout presents information on Critical, Priority, Important, Relevant. It is also available for immediate download and adjustment. So, changes can be made in the color, design, graphics or any other component to create a unique layout.
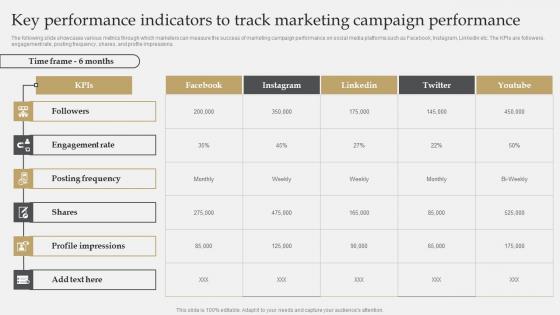
IT Industry Market Research Key Performance Indicators To Track Marketing Campaign Rules Pdf
The following slide showcases various metrics through which marketers can measure the success of marketing campaign performance on social media platforms such as Facebook, Instagram, LinkedIn etc. The KPIs are followers, engagement rate, posting frequency, shares, and profile impressions. Whether you have daily or monthly meetings, a brilliant presentation is necessary. IT Industry Market Research Key Performance Indicators To Track Marketing Campaign Rules Pdf can be your best option for delivering a presentation. Represent everything in detail using IT Industry Market Research Key Performance Indicators To Track Marketing Campaign Rules Pdf and make yourself stand out in meetings. The template is versatile and follows a structure that will cater to your requirements. All the templates prepared by Slidegeeks are easy to download and edit. Our research experts have taken care of the corporate themes as well. So, give it a try and see the results.
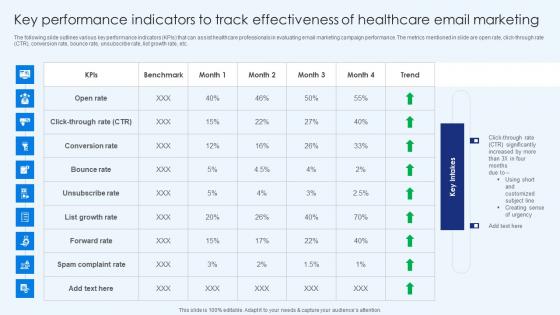
Key Performance Indicators To Track Effectiveness Of Healthcare Promotion Download Pdf
The following slide outlines various key performance indicators KPIs that can assist healthcare professionals in evaluating email marketing campaign performance. The metrics mentioned in slide are open rate, click-through rate CTR, conversion rate, bounce rate, unsubscribe rate, list growth rate, etc. Retrieve professionally designed Key Performance Indicators To Track Effectiveness Of Healthcare Promotion Download Pdf to effectively convey your message and captivate your listeners. Save time by selecting pre-made slideshows that are appropriate for various topics, from business to educational purposes. These themes come in many different styles, from creative to corporate, and all of them are easily adjustable and can be edited quickly. Access them as PowerPoint templates or as Google Slides themes. You do not have to go on a hunt for the perfect presentation because Slidegeeks got you covered from everywhere.

Key Performance Indicators Of Digital Marketing Pyramid Ppt Presentation SS
The following slide showcases green business management with triple bottom line method. It provides information about people, planet, profits, ambitions, commitments, enablers, etc Welcome to our selection of the Key Performance Indicators Of Digital Marketing Pyramid Ppt Presentation SS These are designed to help you showcase your creativity and bring your sphere to life. Planning and Innovation are essential for any business that is just starting out. This collection contains the designs that you need for your everyday presentations. All of our PowerPoints are 100Percent editable, so you can customize them to suit your needs. This multi-purpose template can be used in various situations. Grab these presentation templates today.

Key Economic Indicators To Forecast Inflation Comprehensive Guide On Inflation Control CM SS V
This slide shows information regarding various inflation indicators which can be used by anyone to forecast inflation. It includes indicators such as consumer price index, producer price index, employment cost index, etc. Retrieve professionally designed Key Economic Indicators To Forecast Inflation Comprehensive Guide On Inflation Control CM SS V to effectively convey your message and captivate your listeners. Save time by selecting pre-made slideshows that are appropriate for various topics, from business to educational purposes. These themes come in many different styles, from creative to corporate, and all of them are easily adjustable and can be edited quickly. Access them as PowerPoint templates or as Google Slides themes. You do not have to go on a hunt for the perfect presentation because Slidegeeks got you covered from everywhere.
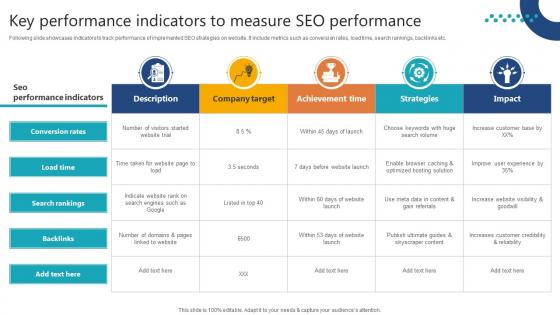
Complete Guide To Launch Key Performance Indicators To Measure SEO Performance
Following slide showcases indicators to track performance of implemented SEO strategies on website. It include metrics such as conversion rates, load time, search rankings, backlinks etc. Welcome to our selection of the Complete Guide To Launch Key Performance Indicators To Measure SEO Performance. These are designed to help you showcase your creativity and bring your sphere to life. Planning and Innovation are essential for any business that is just starting out. This collection contains the designs that you need for your everyday presentations. All of our PowerPoints are 100Percent editable, so you can customize them to suit your needs. This multi-purpose template can be used in various situations. Grab these presentation templates today.

Ecstatic Happy Business PowerPoint Backgrounds And Templates 1210
Microsoft PowerPoint Template and Background with ecstatic happiness depicted on a speedometer with red needle speeding past each word
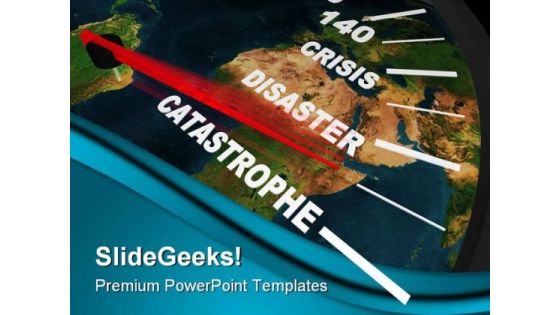
Speeding Global Catastrophe Travel PowerPoint Templates And PowerPoint Backgrounds 0211
Microsoft PowerPoint Template and Background with a speedometer on the earth shows humanity speeding toward global catastrophe

Evolve Business PowerPoint Templates And PowerPoint Backgrounds 0711
Microsoft PowerPoint Template and Background with a speedometer tracks the progress of change with needle racing from extinct to evolve

Speeding Towards Future PowerPoint Templates And PowerPoint Backgrounds 0811
Microsoft PowerPoint Template and Background with red needle on a speedometer points to the phrase speeding toward a bright future

Recession Recovery Growth Business PowerPoint Templates And PowerPoint Backgrounds 0811
Microsoft PowerPoint Template and Background with a speedometer with red needle pointing to recovery rising up from recession
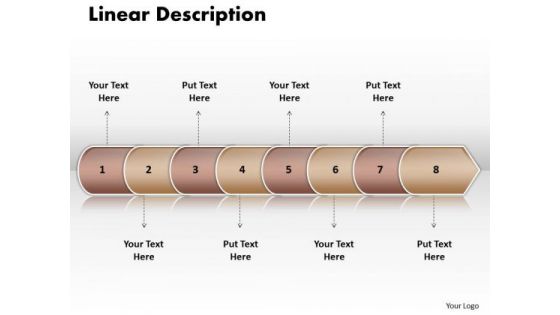
Ppt Linear Arrow 8 Stages PowerPoint Templates
PPT linear arrow 8 stages PowerPoint Templates-In this Linear Arrow process flow chart, arrows show the flow, or movement, of the process from one step to the next. -PPT linear arrow 8 stages PowerPoint Templates-Arrow, Background, Collection, Completed, Concept, Confirmation, Design, Flow, Graph, Graphic, Illustration, Indication, Indicator, Information, Instruction, Interface, Internet, Layout, Measurement, Order, Phase, Pointer, Process, Progress, Reflection, Scale, Shape, Sign

Key Performance Indicators Of IBN Outsourcing Company PPT Presentation SS
The slide shows the key Performance Indicator KPIs which will help the company to track the success rate of implemented strategies. Some of the KPIs are Customer Attrition Rate, Product, Service Adoption Rate, Average Customer Queue Time , Customer Satisfaction Rate etc. Are you in need of a template that can accommodate all of your creative concepts This one is crafted professionally and can be altered to fit any style. Use it with Google Slides or PowerPoint. Include striking photographs, symbols, depictions, and other visuals. Fill, move around, or remove text boxes as desired. Test out color palettes and font mixtures. Edit and save your work, or work with colleagues. Download Key Performance Indicators Of IBN Outsourcing Company PPT Presentation SS and observe how to make your presentation outstanding. Give an impeccable presentation to your group and make your presentation unforgettable.

Internet Security Key Performance Indicators To Track Microsoft Pdf
This slide showcase cyber security KPI to track threating malware in system that are constantly evolving and changing. It includes mean time to detect, mean time to resolve, mean time to contain, average vendor security rating and intrusion attempts.Showcasing this set of slides titled Internet Security Key Performance Indicators To Track Microsoft Pdf The topics addressed in these templates are Firewall System, Security Standards, Identify Attack All the content presented in this PPT design is completely editable. Download it and make adjustments in color, background, font etc. as per your unique business setting.
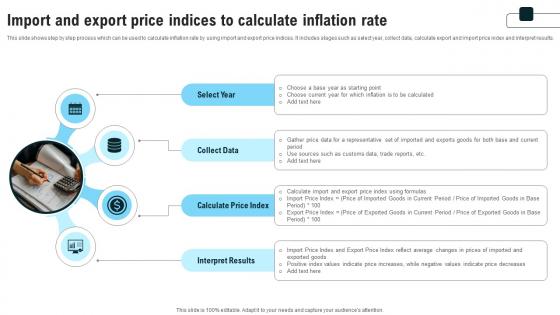
Import And Export Price Indices To Calculate Strategies For Inflation A Tactical Guide Fin SS V
This slide shows step by step process which can be used to calculate inflation rate by using import and export price indices. It includes stages such as select year, collect data, calculate export and import price index and interpret results. This Import And Export Price Indices To Calculate Strategies For Inflation A Tactical Guide Fin SS V is perfect for any presentation, be it in front of clients or colleagues. It is a versatile and stylish solution for organizing your meetings. The Import And Export Price Indices To Calculate Strategies For Inflation A Tactical Guide Fin SS V features a modern design for your presentation meetings. The adjustable and customizable slides provide unlimited possibilities for acing up your presentation. Slidegeeks has done all the homework before launching the product for you. So, do not wait, grab the presentation templates today
Key Indicator Dashboard Of Vertical Channel Marketing Software Ppt Icon Templates Pdf
This slide showcases the key indicators for vertical channel marketing software. This further includes reach, engagement and conversion data along with geography and industry. Showcasing this set of slides titled Key Indicator Dashboard Of Vertical Channel Marketing Software Ppt Icon Templates Pdf. The topics addressed in these templates are Reach, Engagement, Conversion. All the content presented in this PPT design is completely editable. Download it and make adjustments in color, background, font etc. as per your unique business setting.
Synchronized Cardioversion Indications In Powerpoint And Google Slides Cpb
Introducing our well designed Synchronized Cardioversion Indications In Powerpoint And Google Slides Cpb. This PowerPoint design presents information on topics like Synchronized Cardioversion Indications. As it is predesigned it helps boost your confidence level. It also makes you a better presenter because of its high-quality content and graphics. This PPT layout can be downloaded and used in different formats like PDF, PNG, and JPG. Not only this, it is available in both Standard Screen and Widescreen aspect ratios for your convenience. Therefore, click on the download button now to persuade and impress your audience.
Ppt Linear Steps Business Process Management Diagram PowerPoint Free Templates
PPT linear steps business process management diagram powerpoint free Templates-Grab the attention of your team with this eye catching template presenting indicators of the path you have in mind. Use this diagram to enthuse your colleagues-PPT linear steps business process management diagram powerpoint free Templates-3d, Arrow, Background, Banner, Business, Chart, Colorful, Diagram, Direction, Element, Financial, Flow, Gradient, Illustration, Isolated, Mirrored, Placeholder, Presentation, Process, Steps
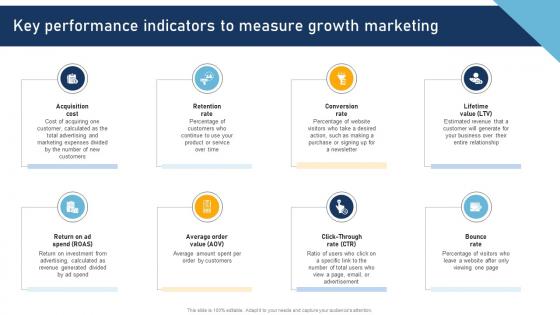
A Comprehensive Approach To Key Performance Indicators To Measure Growth MKT SS V
Whether you have daily or monthly meetings, a brilliant presentation is necessary. A Comprehensive Approach To Key Performance Indicators To Measure Growth MKT SS V can be your best option for delivering a presentation. Represent everything in detail using A Comprehensive Approach To Key Performance Indicators To Measure Growth MKT SS V and make yourself stand out in meetings. The template is versatile and follows a structure that will cater to your requirements. All the templates prepared by Slidegeeks are easy to download and edit. Our research experts have taken care of the corporate themes as well. So, give it a try and see the results.

Import And Export Price Indices To Calculate Comprehensive Guide On Inflation Control CM SS V
This slide shows step by step process which can be used to calculate inflation rate by using import and export price indices. It includes stages such as select year, collect data, calculate export and import price index and interpret results. This Import And Export Price Indices To Calculate Comprehensive Guide On Inflation Control CM SS V is perfect for any presentation, be it in front of clients or colleagues. It is a versatile and stylish solution for organizing your meetings. The Import And Export Price Indices To Calculate Comprehensive Guide On Inflation Control CM SS V features a modern design for your presentation meetings. The adjustable and customizable slides provide unlimited possibilities for acing up your presentation. Slidegeeks has done all the homework before launching the product for you. So, do not wait, grab the presentation templates today

Performance Indicators For Successful Client Onboarding Themes PDF
This slide showcases KPIs that showcases success of user onboarding. Major KPIs included are customer engagement, retention and count, average response time, completion and free trial conversion rate. If you are looking for a format to display your unique thoughts, then the professionally designed Performance Indicators For Successful Client Onboarding Themes PDF is the one for you. You can use it as a Google Slides template or a PowerPoint template. Incorporate impressive visuals, symbols, images, and other charts. Modify or reorganize the text boxes as you desire. Experiment with shade schemes and font pairings. Alter, share or cooperate with other people on your work. Download Performance Indicators For Successful Client Onboarding Themes PDF and find out how to give a successful presentation. Present a perfect display to your team and make your presentation unforgettable.
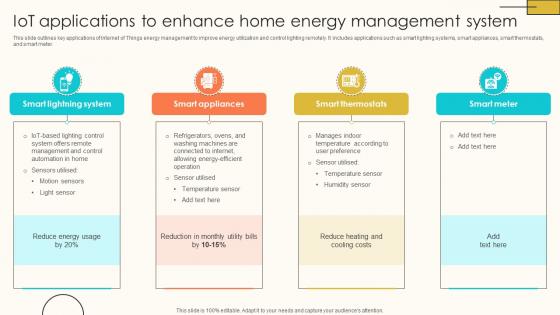
IoT Applications To Enhance Home Energy Internet Of Things Solutions To Enhance Energy IoT SS V
This slide outlines key applications of Internet of Things energy management to improve energy utilization and control lighting remotely. It includes applications such as smart lighting systems, smart appliances, smart thermostats, and smart meter. If you are looking for a format to display your unique thoughts, then the professionally designed IoT Applications To Enhance Home Energy Internet Of Things Solutions To Enhance Energy IoT SS V is the one for you. You can use it as a Google Slides template or a PowerPoint template. Incorporate impressive visuals, symbols, images, and other charts. Modify or reorganize the text boxes as you desire. Experiment with shade schemes and font pairings. Alter, share or cooperate with other people on your work. Download IoT Applications To Enhance Home Energy Internet Of Things Solutions To Enhance Energy IoT SS V and find out how to give a successful presentation. Present a perfect display to your team and make your presentation unforgettable.

Getting The Job People PowerPoint Background And Template 1210
Microsoft PowerPoint Template and Background with A speedometer needle speeds past the various stages of getting a job - the resume the interview and success!

Get The Job Metaphor PowerPoint Templates And PowerPoint Backgrounds 0611
Microsoft PowerPoint Template and Background with a speedometer needle speeds past the various stages of getting a job the resume the interview and success
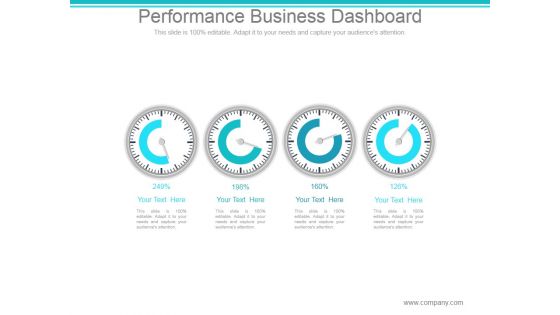
Performance Business Dashboard Ppt PowerPoint Presentation Visuals
This is a performance business dashboard ppt powerpoint presentation visuals. This is a four stage process. The stages in this process are dashboard, speedometer, report, business, marketing.

Salesforce Dashboard Ppt PowerPoint Presentation Summary
This is a salesforce dashboard ppt powerpoint presentation summary. This is a two stage process. The stages in this process are business, marketing, dashboard, graph, speedometer.
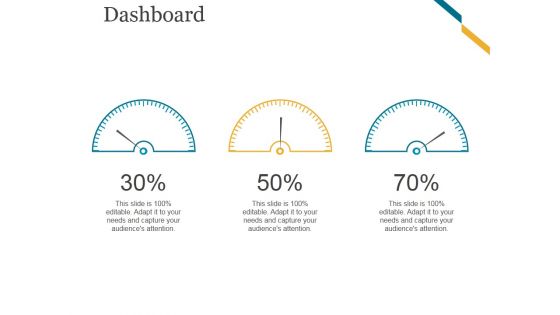
Dashboard Ppt PowerPoint Presentation Infographic Template Tips
This is a dashboard ppt powerpoint presentation infographic template tips. This is a three stage process. The stages in this process are speedometer, dashboard, business, marketing, equipment.

Step 1 Create Registration Page For Customers Guidelines PDF
This slide provides an overview of signup process in customer onboarding. The steps included are providing user account alternatives, using meter, adding confirmed password, making all fields required, showing progress and confirming registration. If you are looking for a format to display your unique thoughts, then the professionally designed Step 1 Create Registration Page For Customers Guidelines PDF is the one for you. You can use it as a Google Slides template or a PowerPoint template. Incorporate impressive visuals, symbols, images, and other charts. Modify or reorganize the text boxes as you desire. Experiment with shade schemes and font pairings. Alter, share or cooperate with other people on your work. Download Step 1 Create Registration Page For Customers Guidelines PDF and find out how to give a successful presentation. Present a perfect display to your team and make your presentation unforgettable.
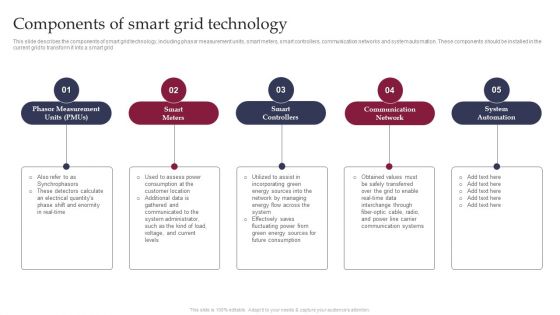
Smart Grid Technology Components Of Smart Grid Technology Rules PDF
Cybersecurity Key Performance Indicator And Padlock Icon Clipart Pdf
Showcasing this set of slides titled Cybersecurity Key Performance Indicator And Padlock Icon Clipart Pdf The topics addressed in these templates are Cybersecurity Key, Performance Indicator, Padlock Icon All the content presented in this PPT design is completely editable. Download it and make adjustments in color, background, font etc. as per your unique business setting.
Human Resource Analytics Key Performance Indicator Icon Elements Pdf
Showcasing this set of slides titled Human Resource Analytics Key Performance Indicator Icon Elements Pdf The topics addressed in these templates are Human Resource, Analytics Key Performance, Indicator Icon All the content presented in this PPT design is completely editable. Download it and make adjustments in color, background, font etc. as per your unique business setting.

Addressing Indicators Associated To Insider Cyber Threats Monitoring Digital Assets Themes Pdf
This slide provides details regarding indicators associated to insider threats in terms of traits, demeanor and goals, etc. Presenting this PowerPoint presentation, titled Addressing Indicators Associated To Insider Cyber Threats Monitoring Digital Assets Themes Pdf with topics curated by our researchers after extensive research. This editable presentation is available for immediate download and provides attractive features when used. Download now and captivate your audience. Presenting this Addressing Indicators Associated To Insider Cyber Threats Monitoring Digital Assets Themes Pdf Our researchers have carefully researched and created these slides with all aspects taken into consideration. This is a completely customizable Addressing Indicators Associated To Insider Cyber Threats Monitoring Digital Assets Themes Pdf that is available for immediate downloading. Download now and make an impact on your audience. Highlight the attractive features available with our PPTs.
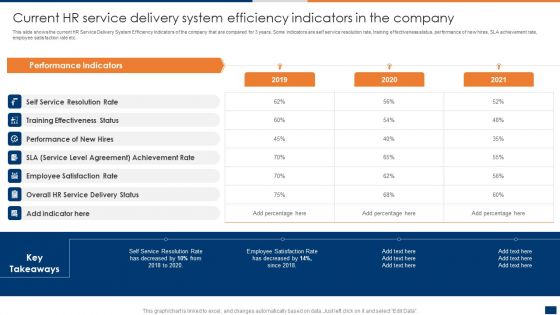
Current HR Service Delivery System Efficiency Indicators In The Company Ppt PowerPoint Presentation File Deck PDF
This slide shows the current HR Service Delivery System Efficiency Indicators of the company that are compared for 3 years. Some indicators are self service resolution rate, training effectiveness status, performance of new hires, SLA achievement rate, employee satisfaction rate etc. If you are looking for a format to display your unique thoughts, then the professionally designed Current HR Service Delivery System Efficiency Indicators In The Company Ppt PowerPoint Presentation File Deck PDF is the one for you. You can use it as a Google Slides template or a PowerPoint template. Incorporate impressive visuals, symbols, images, and other charts. Modify or reorganize the text boxes as you desire. Experiment with shade schemes and font pairings. Alter, share or cooperate with other people on your work. Download Current HR Service Delivery System Efficiency Indicators In The Company Ppt PowerPoint Presentation File Deck PDF and find out how to give a successful presentation. Present a perfect display to your team and make your presentation unforgettable.
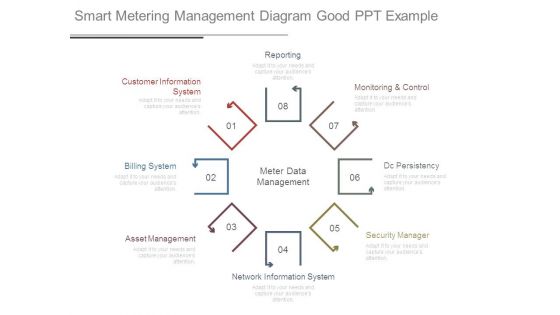
Smart Metering Management Diagram Good Ppt Example
This is a smart metering management diagram good ppt example. This is a eight stage process. The stages in this process are reporting, customer information system, billing system, asset management, network information system, security manager, dc persistency, monitoring and control, meter data management.

Evaluation For Stakeholder Success Indicators Impact Shareholder Decisions With Stakeholder Administration Clipart PDF
This slide covers the stakeholders engagement success measurement key performance indicators including stakeholders type , evaluation areas, methods, sources of information and long term or short term success. If you are looking for a format to display your unique thoughts, then the professionally designed Evaluation For Stakeholder Success Indicators Impact Shareholder Decisions With Stakeholder Administration Clipart PDF is the one for you. You can use it as a Google Slides template or a PowerPoint template. Incorporate impressive visuals, symbols, images, and other charts. Modify or reorganize the text boxes as you desire. Experiment with shade schemes and font pairings. Alter, share or cooperate with other people on your work. Download Evaluation For Stakeholder Success Indicators Impact Shareholder Decisions With Stakeholder Administration Clipart PDF and find out how to give a successful presentation. Present a perfect display to your team and make your presentation unforgettable.
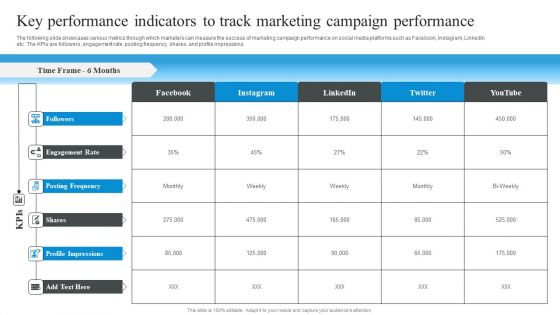
Market Evaluation Of IT Industry Key Performance Indicators To Track Marketing Campaign Performance Slides PDF
The following slide showcases various metrics through which marketers can measure the success of marketing campaign performance on social media platforms such as Facebook, Instagram, LinkedIn etc. The KPIs are followers, engagement rate, posting frequency, shares, and profile impressions. If you are looking for a format to display your unique thoughts, then the professionally designed Market Evaluation Of IT Industry Key Performance Indicators To Track Marketing Campaign Performance Slides PDF is the one for you. You can use it as a Google Slides template or a PowerPoint template. Incorporate impressive visuals, symbols, images, and other charts. Modify or reorganize the text boxes as you desire. Experiment with shade schemes and font pairings. Alter, share or cooperate with other people on your work. Download Market Evaluation Of IT Industry Key Performance Indicators To Track Marketing Campaign Performance Slides PDF and find out how to give a successful presentation. Present a perfect display to your team and make your presentation unforgettable.
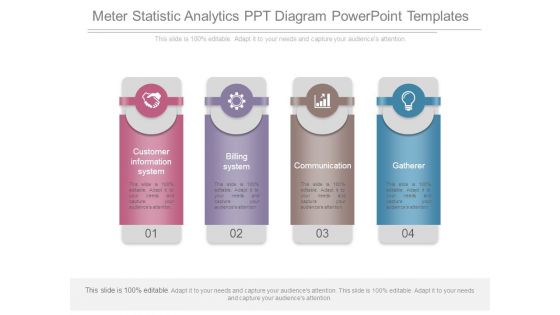
Meter Statistic Analytics Ppt Diagram Powerpoint Templates
This is a meter statistic analytics ppt diagram powerpoint templates. This is a four stage process. The stages in this process are customer information system, billing system, communication, gatherer.
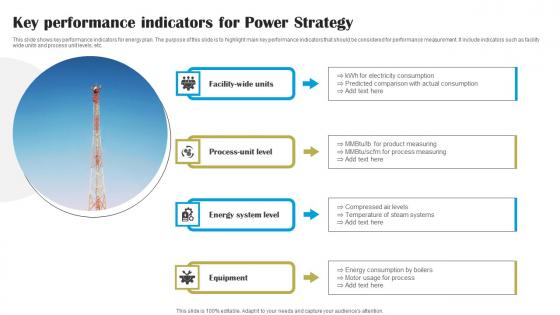
Key Performance Indicators For Power Strategy Template Pdf
This slide shows key performance indicators for energy plan. The purpose of this slide is to highlight main key performance indicators that should be considered for performance measurement. It include indicators such as facility wide units and process unit levels, etc.Pitch your topic with ease and precision using this Key Performance Indicators For Power Strategy Template Pdf This layout presents information on Electricity Consumption, Process Measuring, Temperature Steam Systems It is also available for immediate download and adjustment. So, changes can be made in the color, design, graphics or any other component to create a unique layout.

Alarm Clock With Speed Meter Powerpoint Templates
Our above PPT slide contains graphics of alarm clock with speed meter. This PowerPoint template helps to display concept of deadlines and performance. Use this diagram to create more sound impact on viewers.
Ppt Series To Present Concept Download Steps Four PowerPoint Templates
PPT series to present concept download steps four PowerPoint Templates-This series of steps diagram is indicator of the path you have in mind. This image has been conceived to enable you to emphatically communicate your ideas in your Business presentation-PPT series to present concept download steps four PowerPoint Templates-achieve, achievement, axis, background, banking, business, chart, company, concept, corporate, director, economic, flow, goal, graph, human, increase, law, line, management, maths, money, national, personel, plan, profit, resources, retail, revenue, shop, statistic, straight, success, target

Meter For Competitive Advantage Presentation Template
This pre-designed diagram of meter signifies the concept of competitive advantage. This template is carefully designed to look interesting and informative. Use this theme to give unified look to your presentations.
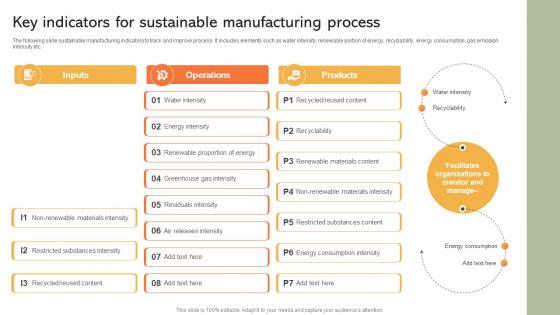
Key Indicators For Sustainable Manufacturing Implementing Manufacturing Strategy SS V
The following slide sustainable manufacturing indicators to track and improve process. It includes elements such as water intensity, renewable portion of energy, recyclability, energy consumption, gas emission intensity etc. Presenting this PowerPoint presentation, titled Key Indicators For Sustainable Manufacturing Implementing Manufacturing Strategy SS V, with topics curated by our researchers after extensive research. This editable presentation is available for immediate download and provides attractive features when used. Download now and captivate your audience. Presenting this Key Indicators For Sustainable Manufacturing Implementing Manufacturing Strategy SS V. Our researchers have carefully researched and created these slides with all aspects taken into consideration. This is a completely customizable Key Indicators For Sustainable Manufacturing Implementing Manufacturing Strategy SS V that is available for immediate downloading. Download now and make an impact on your audience. Highlight the attractive features available with our PPTs.

Key Indicators For Sustainable Manufacturing Strategy Driving Industry 4 0
The following slide sustainable manufacturing indicators to track and improve process. It includes elements such as water intensity, renewable portion of energy, recyclability, energy consumption, gas emission intensity etc. Presenting this PowerPoint presentation, titled Key Indicators For Sustainable Manufacturing Strategy Driving Industry 4 0, with topics curated by our researchers after extensive research. This editable presentation is available for immediate download and provides attractive features when used. Download now and captivate your audience. Presenting this Key Indicators For Sustainable Manufacturing Strategy Driving Industry 4 0. Our researchers have carefully researched and created these slides with all aspects taken into consideration. This is a completely customizable Key Indicators For Sustainable Manufacturing Strategy Driving Industry 4 0 that is available for immediate downloading. Download now and make an impact on your audience. Highlight the attractive features available with our PPTs.
Ppt 2 State Diagram Linear Procurement Process PowerPoint Presentation Templates
PPT 2 state diagram linear procurement process powerpoint presentation Templates-Our Template designs are State of the Art. This one depicts the popular linear chart. The structure of our template allows you to effectively highlight the key issues concerning the growth of your business.-PPT 2 state diagram linear procurement process powerpoint presentation Templates-Aim, Arrow, Arrowheads, Badge, Border, Click, Connection, Curve, Design, Direction, Download, Element, Fuchsia, Icon, Illustration, Indicator, Internet, Magenta, Mark, Object, Orientation, Pointer, Shadow, Shape, Sign

Ppt Linear Illustration Of Process Using 4 State Diagram PowerPoint Templates
PPT linear illustration of process using 4 state diagram PowerPoint Templates-This PowerPoint template depicts the popular linear chart. Determine your targets and sequence them as per your priorities. Unravel the desired and essential elements of your overall strategy.-PPT linear illustration of process using 4 state diagram PowerPoint Templates-Aim, Arrow, Arrowheads, Badge, Border, Click, Connection, Curve, Design, Direction, Download, Element, Fuchsia, Icon, Illustration, Indicator, Internet, Magenta, Mark, Object, Orientation, Pointer, Shadow, Shape, Sign
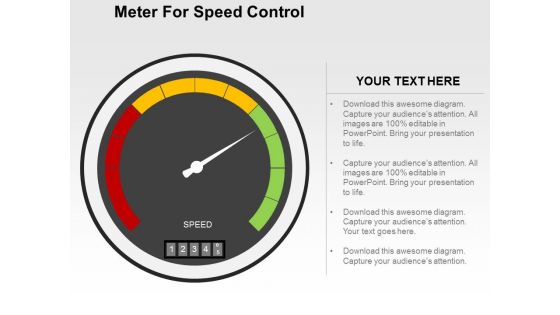
Meter For Speed Control Powerpoint Templates
Our professionally designed business diagram is as an effective tool for communicating business ideas and strategies for corporate planning. It contains graphics of speed control meter. Above slide is suitable to display business options with technology.
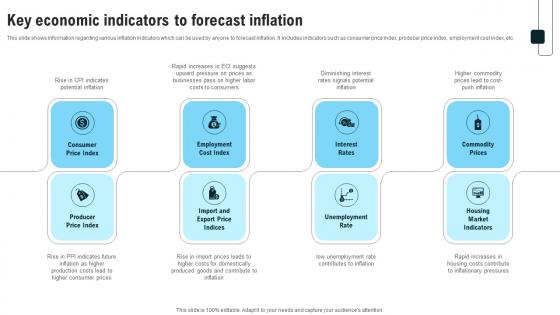
Key Economic Indicators To Forecast Inflation Strategies For Inflation A Tactical Guide Fin SS V
This slide shows information regarding various inflation indicators which can be used by anyone to forecast inflation. It includes indicators such as consumer price index, producer price index, employment cost index, etc. Retrieve professionally designed Key Economic Indicators To Forecast Inflation Strategies For Inflation A Tactical Guide Fin SS V to effectively convey your message and captivate your listeners. Save time by selecting pre-made slideshows that are appropriate for various topics, from business to educational purposes. These themes come in many different styles, from creative to corporate, and all of them are easily adjustable and can be edited quickly. Access them as PowerPoint templates or as Google Slides themes. You do not have to go on a hunt for the perfect presentation because Slidegeeks got you covered from everywhere.
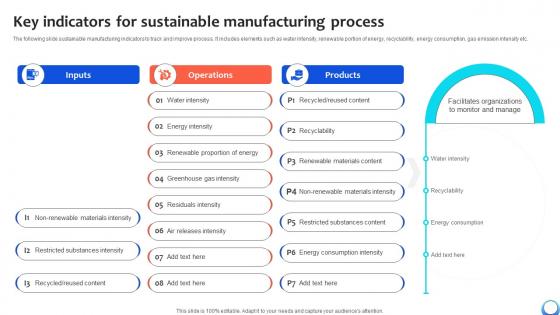
Key Indicators For Sustainable Manufacturing Automating Production Process Strategy SS V
The following slide sustainable manufacturing indicators to track and improve process. It includes elements such as water intensity, renewable portion of energy, recyclability, energy consumption, gas emission intensity etc. Presenting this PowerPoint presentation, titled Key Indicators For Sustainable Manufacturing Automating Production Process Strategy SS V, with topics curated by our researchers after extensive research. This editable presentation is available for immediate download and provides attractive features when used. Download now and captivate your audience. Presenting this Key Indicators For Sustainable Manufacturing Automating Production Process Strategy SS V. Our researchers have carefully researched and created these slides with all aspects taken into consideration. This is a completely customizable Key Indicators For Sustainable Manufacturing Automating Production Process Strategy SS V that is available for immediate downloading. Download now and make an impact on your audience. Highlight the attractive features available with our PPTs.

Indications Liver Transplant In Powerpoint And Google Slides Cpb
Introducing our well designed Indications Liver Transplant In Powerpoint And Google Slides Cpb. This PowerPoint design presents information on topics like Indications Liver Transplant. As it is predesigned it helps boost your confidence level. It also makes you a better presenter because of its high quality content and graphics. This PPT layout can be downloaded and used in different formats like PDF, PNG, and JPG. Not only this, it is available in both Standard Screen and Widescreen aspect ratios for your convenience. Therefore, click on the download button now to persuade and impress your audience.

Analyzing Brands Key Financial Indicators Improving Customer Interaction Through Microsoft Pdf
This slide showcases assessing key indicators for measuring financial performance of brand. It provides details about turnover, marketing costs, sales, administrative expenses, profit, percentage turnover, trade debtor days, headcount, etc.Find highly impressive Analyzing Brands Key Financial Indicators Improving Customer Interaction Through Microsoft Pdf on Slidegeeks to deliver a meaningful presentation. You can save an ample amount of time using these presentation templates. No need to worry to prepare everything from scratch because Slidegeeks experts have already done a huge research and work for you. You need to download Analyzing Brands Key Financial Indicators Improving Customer Interaction Through Microsoft Pdf for your upcoming presentation. All the presentation templates are 100Precent editable and you can change the color and personalize the content accordingly. Download now.

Key Findings Ppt PowerPoint Presentation Complete Deck With Slides
This is a key findings ppt powerpoint presentation complete deck with slides. This is a one stage process. The stages in this process are key findings, management, planning, business, analysis.

Current Status Of Product Ppt PowerPoint Presentation Designs Download
This is a current status of product ppt powerpoint presentation designs download. This is a three stage process. The stages in this process are speedometer, dashboard, business, marketing, finance.

Sales Team Performance Meter Ppt PowerPoint Presentation Diagrams
This is a sales team performance meter ppt powerpoint presentation diagrams. This is a five stage process. The stages in this process are business, meter, speed, time, sales.

Consulting Slides Circular Meter Agenda Diagram Business Presentation
This circular process layout helps to describe the ordered set of steps required to complete a task. You can download this diagram to make awesome presentations in PowerPoint.
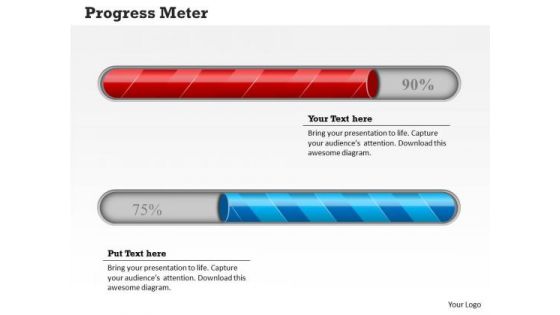
Strategy Diagram Meter Design For Business Progress Sales Diagram
Our Strategy Diagram Meter Design For Business Progress Sales Diagram Powerpoint Templates Abhor Doodling. They Never Let The Interest Flag.

Consulting Diagram Business Dashboard Progress Meter Business Diagram
Be The Doer With Our Consulting Diagram Business Dashboard Progress Meter Business Diagram Powerpoint Templates. Put Your Thoughts Into Practice.

Business Diagram Meter Pointing On Poor Word Presentation Template
Graphic of meter has been used to design this power point template. This diagram contains the graphic of meter to display performance levels. Use this business diagram to make attractive presentations.
Employee Work Performance Monitoring Meter Icon Background PDF
Showcasing this set of slides titled Employee Work Performance Monitoring Meter Icon Background PDF. The topics addressed in these templates are Monitoring Meter Icon, Employee Work Performance. All the content presented in this PPT design is completely editable. Download it and make adjustments in color, background, font etc. as per your unique business setting.

Sales Diagram Dashboard Meter For Business Information Business Diagram
Our Sales Diagram Dashboard Meter For Business Information Business Diagram Powerpoint Templates Deliver At Your Doorstep. Let Them In For A Wonderful Experience.
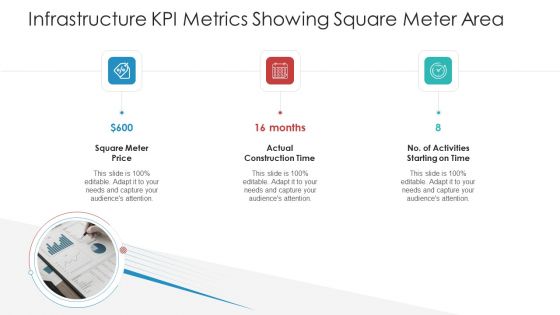
Infrastructure KPI Metrics Showing Square Meter Area Introduction PDF
This is a infrastructure kpi metrics showing square meter area introduction pdf template with various stages. Focus and dispense information on three stages using this creative set, that comes with editable features. It contains large content boxes to add your information on topics like square meter price actual, construction time, no of activities starting on time. You can also showcase facts, figures, and other relevant content using this PPT layout. Grab it now.

Ppt Curved Arrows PowerPoint Templates Pointing Inwards Step 4
PPT curved arrows powerpoint templates Pointing inwards step 4-This PowerPoint Diagram shows the highlighted blue arrow signifying the completion of process. It portrays the concept of bolt, cursor, dart, indicator, missile, pointer, projectile, shaft etc.-Can be used for presentations on around, arrow, business, button, chart, circle, collection, color, computer, curve, cycle, direction, down, ecology, element, environment, flowing, green, group, guidance, icon, isolated, leadership, leading, moving, pollution, processing, push, rotate, set, shape, shiny, sign, stick, symbol, triangle, turning, up, variation, waste-PPT curved arrows powerpoint templates Pointing inwards step 4
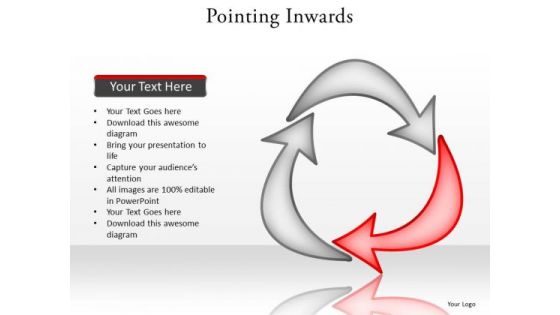
Ppt Curved PowerPoint Graphics Arrows Stage 2 Forming Triangle Templates
PPT curved powerpoint graphics arrows stage 2 forming triangle Templates-This PowerPoint Diagram shows the highlighted red arrow signifying the process is going on. It portrays the concept of bolt, cursor, dart, indicator, missile, pointer, projectile, shaft, achievement, attainment, close, conclusion, consummation, culmination, curtains, dispatch etc.-Can be used for presentations on around, arrow, business, button, chart, circle, collection, color, computer, curve, cycle, direction, down, ecology, element, environment, flowing, green, group, guidance, icon, isolated, leadership, leading, moving, pollution, processing, push, rotate, set, shape, shiny, sign, stick, symbol, triangle, turning, up, variation, waste-PPT curved powerpoint graphics arrows stage 2 forming triangle Templates

Ppt Curved Shapes Arrows PowerPoint Pointing Inwards Step 2 Templates
PPT curved shapes arrows powerpoint Pointing inwards step 2 Templates-This PowerPoint Diagram shows the highlighted blue arrow signifying the process is about to complete. It portrays the concept of bolt, cursor, dart, indicator, missile, pointer, projectile, shaft etc.-Can be used for presentations on around, arrow, business, button, chart, circle, collection, color, computer, curve, cycle, direction, down, ecology, element, environment, flowing, green, group, guidance, icon, isolated, leadership, leading, moving, pollution, processing, push, rotate, set, shape, shiny, sign, stick, symbol, triangle, turning, up, variation, waste-PPT curved shapes arrows powerpoint Pointing inwards step 2 Templates
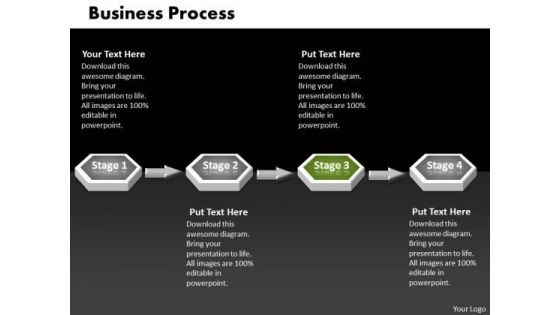
Ppt Green PowerPoint Slide Stage 3d Sequential Linear Process Templates
PPT green powerpoint slide stage 3d sequential linear process Templates-This Business PowerPoint Diagram shows 3d linear abstraction to represent Business related issues. It uses four stages. It indicates employment, field, function, game, line, and livelihood. It is helpful to organize information. -PPT green powerpoint slide stage 3d sequential linear process Templates-arrow, art, basic, blank, business, capital, chart, chevron, clip, clipart, colorful, conglomerates, consumer, copy, cyclical, energy, financial, flow, goods, graph, graphic, healthcare, illustration, infographic, information, investment, isolated, market, materials, non, round, sectors, services, slide, space, stock, technology, text,
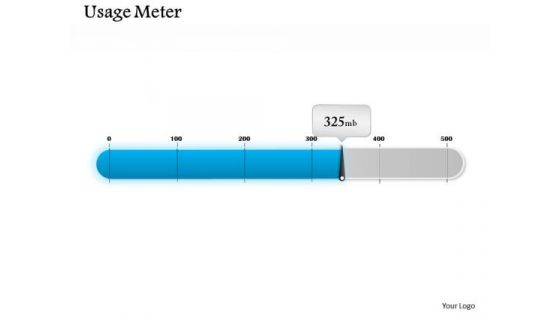
Mba Models And Frameworks Usage Meter Dashboard Design Consulting Diagram
Doll Up Your Thoughts With Our MBA Models And Frameworks Usage Meter Dashboard Design Consulting Diagram Powerpoint Templates. They Will Make A Pretty Picture.

Strategic Management Progress Meter Dashboard Design Marketing Diagram
Be A Donor Of Great Ideas. Display Your Charity On Our Strategic Management Progress Meter Dashboard Design Marketing Diagram Powerpoint Templates.
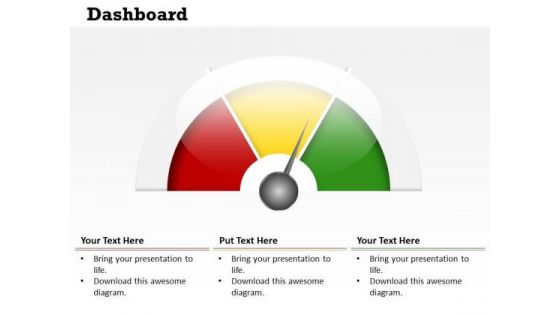
Business Framework Model Dashboard Business Meter Design Sales Diagram
Our Business Framework Model Dashboard Business Meter Design Sales Diagram Powerpoint Templates Team Are A Dogged Lot. They Keep At It Till They Get It Right.

Business Diagram Meters For Business Progress Presentation Template
This business slide contains graphics of meter. You may use this slide to depict business progress. Download our above diagram to express information in a visual way.
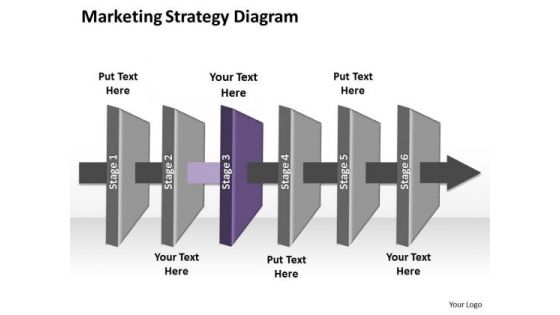
Ppt Linear Flow Of Marketing Startegy Swim Lane Diagram PowerPoint Template Templates
PPT linear flow of marketing startegy swim lane diagram powerpoint template Templates-In above diagram steps in a process are shown with symbolic shapes, and the flow of the process is indicated with arrow connecting the symbols. Create dynamic Microsoft office PPT Presentations with our professional template -PPT linear flow of marketing startegy swim lane diagram powerpoint template Templates-3d, Air, Arrow, Art, Business, Chart, Clip, Clipart, Cooling, Diagram, Drip, Drop, Dry, Energy, Eps10, Evaporate, Evaporating, Evaporation, Graphic, Heat, Icon, Illustration, Isolated, Isometric, Layers, Material, Moisture, Process

 Home
Home