Gauge Chart
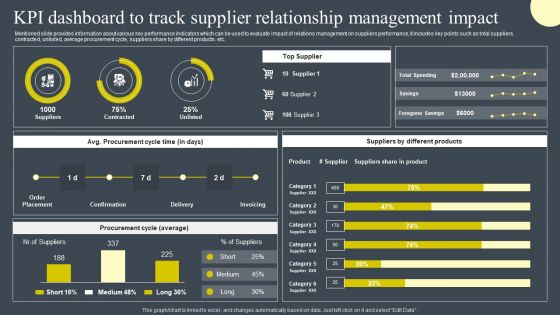
KPI Dashboard To Track Supplier Relationship Management Impact Inspiration PDF
Mentioned slide provides information about various key performance indicators which can be used to evaluate impact of relations management on suppliers performance, it includes key points such as total suppliers, contracted, unlisted, average procurement cycle, suppliers share by different products. etc. Slidegeeks has constructed KPI Dashboard To Track Supplier Relationship Management Impact Inspiration PDF after conducting extensive research and examination. These presentation templates are constantly being generated and modified based on user preferences and critiques from editors. Here, you will find the most attractive templates for a range of purposes while taking into account ratings and remarks from users regarding the content. This is an excellent jumping-off point to explore our content and will give new users an insight into our top-notch PowerPoint Templates.
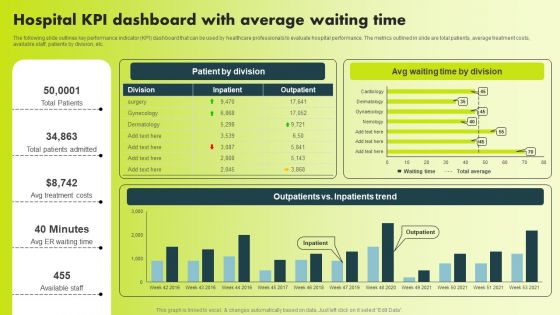
Hospital KPI Dashboard With Average Waiting Time Background PDF
The following slide outlines key performance indicator KPI dashboard that can be used by healthcare professionals to evaluate hospital performance. The metrics outlined in slide are total patients, average treatment costs, available staff, patients by division, etc. Slidegeeks is one of the best resources for PowerPoint templates. You can download easily and regulate Hospital KPI Dashboard With Average Waiting Time Background PDF for your personal presentations from our wonderful collection. A few clicks is all it takes to discover and get the most relevant and appropriate templates. Use our Templates to add a unique zing and appeal to your presentation and meetings. All the slides are easy to edit and you can use them even for advertisement purposes.
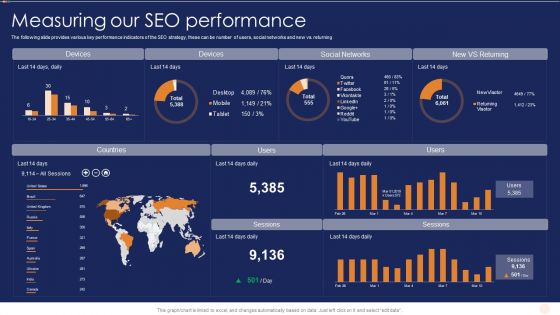
SEO Marketing Strategy For B2B And B2C Measuring Our SEO Performance Download PDF
The following slide provides various key performance indicators of the SEO strategy, these can be number of users, social networks and new vs. returning. Do you have to make sure that everyone on your team knows about any specific topic I yes, then you should give SEO Marketing Strategy For B2B And B2C Measuring Our SEO Performance Download PDF a try. Our experts have put a lot of knowledge and effort into creating this impeccable SEO Marketing Strategy For B2B And B2C Measuring Our SEO Performance Download PDF. You can use this template for your upcoming presentations, as the slides are perfect to represent even the tiniest detail. You can download these templates from the Slidegeeks website and these are easy to edit. So grab these today.
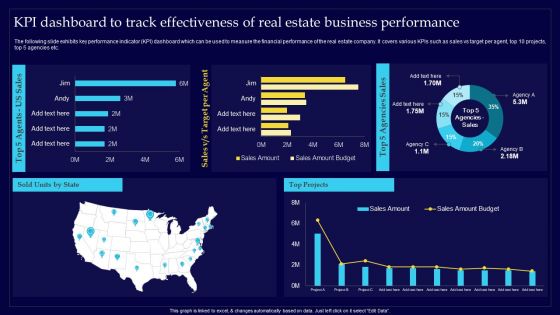
Executing Risk Mitigation KPI Dashboard To Track Effectiveness Of Real Estate Rules PDF
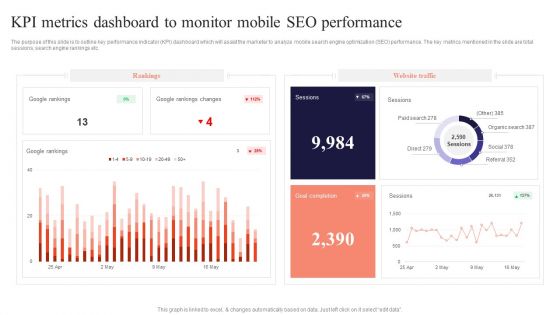
KPI Metrics Dashboard To Monitor Mobile Performing Mobile SEO Audit To Analyze Web Traffic Graphics PDF
The purpose of this slide is to outline key performance indicator KPI dashboard which will assist the marketer to analyze mobile search engine optimization SEO performance. The key metrics mentioned in the slide are total sessions, search engine rankings etc.Find highly impressive KPI Metrics Dashboard To Monitor Mobile Performing Mobile SEO Audit To Analyze Web Traffic Graphics PDF on Slidegeeks to deliver a meaningful presentation. You can save an ample amount of time using these presentation templates. No need to worry to prepare everything from scratch because Slidegeeks experts have already done a huge research and work for you. You need to download KPI Metrics Dashboard To Monitor Mobile Performing Mobile SEO Audit To Analyze Web Traffic Graphics PDF for your upcoming presentation. All the presentation templates are 100 precent editable and you can change the color and personalize the content accordingly. Download now.
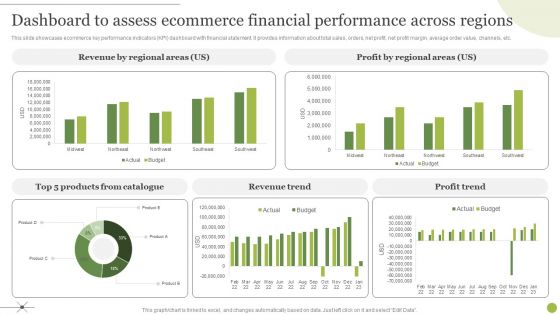
Managing E Commerce Business Accounting Dashboard To Assess Ecommerce Financial Performance Across Regions Graphics PDF
This slide showcases ecommerce key performance indicators KPI dashboard with financial statement. It provides information about total sales, orders, net profit, net profit margin, average order value, channels, etc. Do you have to make sure that everyone on your team knows about any specific topic I yes, then you should give Managing E Commerce Business Accounting Dashboard To Assess Ecommerce Financial Performance Across Regions Graphics PDF a try. Our experts have put a lot of knowledge and effort into creating this impeccable Managing E Commerce Business Accounting Dashboard To Assess Ecommerce Financial Performance Across Regions Graphics PDF. You can use this template for your upcoming presentations, as the slides are perfect to represent even the tiniest detail. You can download these templates from the Slidegeeks website and these are easy to edit. So grab these today.
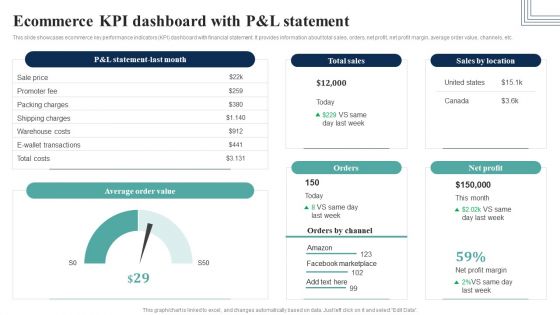
How Electronic Commerce Financial Procedure Can Be Enhanced Ecommerce Kpi Dashboard Slides PDF
This slide showcases ecommerce key performance indicators KPI dashboard with financial statement. It provides information about total sales, orders, net profit, net profit margin, average order value, channels, etc.Create an editable How Electronic Commerce Financial Procedure Can Be Enhanced Ecommerce Kpi Dashboard Slides PDF that communicates your idea and engages your audience. Whether you are presenting a business or an educational presentation, pre-designed presentation templates help save time. How Electronic Commerce Financial Procedure Can Be Enhanced Ecommerce Kpi Dashboard Slides PDF is highly customizable and very easy to edit, covering many different styles from creative to business presentations. Slidegeeks has creative team members who have crafted amazing templates. So, go and get them without any delay.

Comprehensive Market Research Guide Analyzing Customer Demographics Through Demonstration PDF
The following slide outlines key performance indicator KPI dashboard outlining customer demographics. Information covered in this slide is related to metrics such as gender, education level, technology adoption life cycle, and brand innovation consent. Create an editable Comprehensive Market Research Guide Analyzing Customer Demographics Through Demonstration PDF that communicates your idea and engages your audience. Whether youre presenting a business or an educational presentation, pre-designed presentation templates help save time. Comprehensive Market Research Guide Analyzing Customer Demographics Through Demonstration PDF is highly customizable and very easy to edit, covering many different styles from creative to business presentations. Slidegeeks has creative team members who have crafted amazing templates. So, go and get them without any delay.
B2b Sales Performance Tracking Dashboard Comprehensive Guide For Developing Topics PDF
This slide represents metric dashboard to track sales performance on e-commerce website. It cover performance indicators such as sales breakdown, order breakdown, recurring sales etc.Do you have to make sure that everyone on your team knows about any specific topic I yes, then you should give B2b Sales Performance Tracking Dashboard Comprehensive Guide For Developing Topics PDF a try. Our experts have put a lot of knowledge and effort into creating this impeccable B2b Sales Performance Tracking Dashboard Comprehensive Guide For Developing Topics PDF. You can use this template for your upcoming presentations, as the slides are perfect to represent even the tiniest detail. You can download these templates from the Slidegeeks website and these are easy to edit. So grab these today.
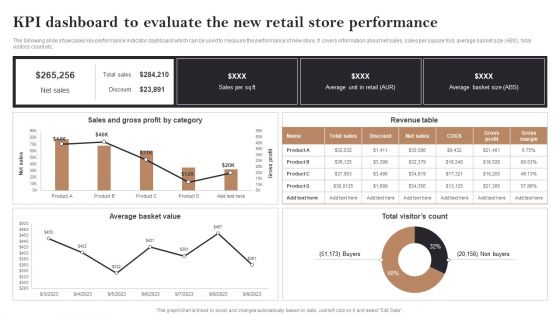
Kpi Dashboard To Evaluate The New Retail Store Performance Opening Retail Store In Untapped Download PDF
The following slide showcases key performance indicator dashboard which can be used to measure the performance of new store. It covers information about net sales, sales per square foot, average basket size ABS, total visitors count etc.Create an editable Kpi Dashboard To Evaluate The New Retail Store Performance Opening Retail Store In Untapped Download PDF that communicates your idea and engages your audience. Whether you are presenting a business or an educational presentation, pre-designed presentation templates help save time. Kpi Dashboard To Evaluate The New Retail Store Performance Opening Retail Store In Untapped Download PDF is highly customizable and very easy to edit, covering many different styles from creative to business presentations. Slidegeeks has creative team members who have crafted amazing templates. So, go and get them without any delay.

Introduction To Artificial Intelligence In Operation Management Industry Aiops Dashboard To Monitor IT Operations Clipart PDF
The following slide highlights the various key performance indicators of the AIOp, these can be problem quick review, cloud and infrastructure and applications health. Create an editable Introduction To Artificial Intelligence In Operation Management Industry Aiops Dashboard To Monitor IT Operations Clipart PDF that communicates your idea and engages your audience. Whether you are presenting a business or an educational presentation, pre-designed presentation templates help save time. Introduction To Artificial Intelligence In Operation Management Industry Aiops Dashboard To Monitor IT Operations Clipart PDF is highly customizable and very easy to edit, covering many different styles from creative to business presentations. Slidegeeks has creative team members who have crafted amazing templates. So, go and get them without any delay.
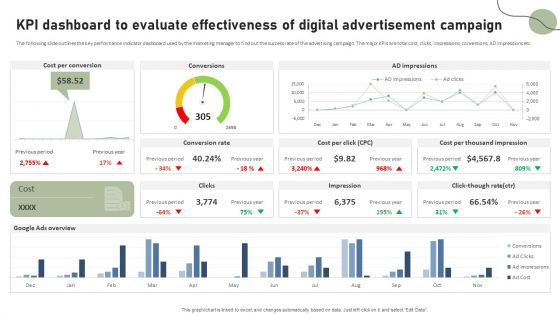
KPI Dashboard To Evaluate Effectiveness Of Digital Advertisement Campaign Pictures PDF
The following slide outlines the key performance indicator dashboard used by the marketing manager to find out the success rate of the advertising campaign. The major KPIs are total cost, clicks, impressions, conversions, AD impressions etc. Do you have to make sure that everyone on your team knows about any specific topic I yes, then you should give KPI Dashboard To Evaluate Effectiveness Of Digital Advertisement Campaign Pictures PDF a try. Our experts have put a lot of knowledge and effort into creating this impeccable KPI Dashboard To Evaluate Effectiveness Of Digital Advertisement Campaign Pictures PDF. You can use this template for your upcoming presentations, as the slides are perfect to represent even the tiniest detail. You can download these templates from the Slidegeeks website and these are easy to edit. So grab these today.
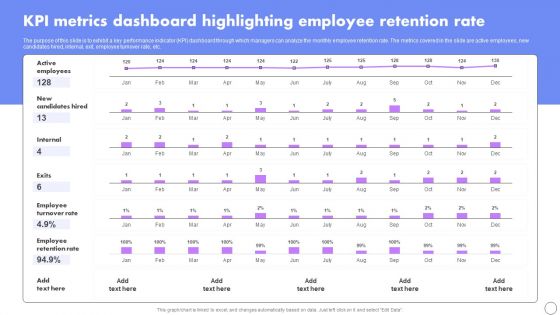
KPI Metrics Dashboard Highlighting Employee Retention Rate Developing Employee Retention Techniques Sample PDF
The purpose of this slide is to exhibit a key performance indicator KPI dashboard through which managers can analyze the monthly employee retention rate. The metrics covered in the slide are active employees, new candidates hired, internal, exit, employee turnover rate, etc.Do you have to make sure that everyone on your team knows about any specific topic I yes, then you should give KPI Metrics Dashboard Highlighting Employee Retention Rate Developing Employee Retention Techniques Sample PDF a try. Our experts have put a lot of knowledge and effort into creating this impeccable KPI Metrics Dashboard Highlighting Employee Retention Rate Developing Employee Retention Techniques Sample PDF. You can use this template for your upcoming presentations, as the slides are perfect to represent even the tiniest detail. You can download these templates from the Slidegeeks website and these are easy to edit. So grab these today.

Conflict Resolution Method KPI Metrics Dashboard Post Resolving Workplace Download PDF
The purpose of this slide is to outline key performance indicator KPI dashboard showcasing the results post resolving organizational conflicts. The metrics covered in this slide are conflicts by departments, conflicts logged by gender etc. Do you have to make sure that everyone on your team knows about any specific topic I yes, then you should give Conflict Resolution Method KPI Metrics Dashboard Post Resolving Workplace Download PDF a try. Our experts have put a lot of knowledge and effort into creating this impeccable Conflict Resolution Method KPI Metrics Dashboard Post Resolving Workplace Download PDF. You can use this template for your upcoming presentations, as the slides are perfect to represent even the tiniest detail. You can download these templates from the Slidegeeks website and these are easy to edit. So grab these today.
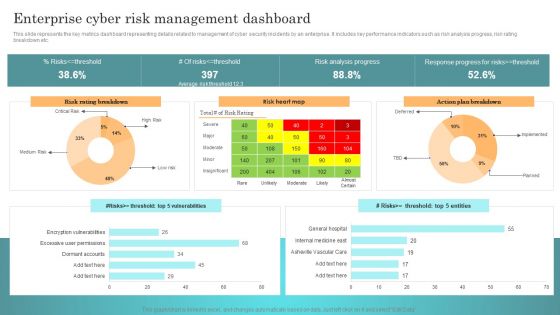
Incident Response Techniques Deployement Enterprise Cyber Risk Management Dashboard Rules PDF
This slide represents the key metrics dashboard representing details related to management of cyber security incidents by an enterprise. It includes key performance indicators such as risk analysis progress, risk rating breakdown etc. Find highly impressive Incident Response Techniques Deployement Enterprise Cyber Risk Management Dashboard Rules PDF on Slidegeeks to deliver a meaningful presentation. You can save an ample amount of time using these presentation templates. No need to worry to prepare everything from scratch because Slidegeeks experts have already done a huge research and work for you. You need to download Incident Response Techniques Deployement Enterprise Cyber Risk Management Dashboard Rules PDF for your upcoming presentation. All the presentation templates are 100 percent editable and you can change the color and personalize the content accordingly. Download now.

Flexible Working Policies And Guidelines Dashboard To Analyze Flexible Working Strategies Information PDF
The following slide delineates a key performance indicator KPI dashboard through which managers can evaluate the success of a flexible working policy on workforce performance. The major KPIs are absenteeism rate, overall labor effectiveness etc. Create an editable Flexible Working Policies And Guidelines Dashboard To Analyze Flexible Working Strategies Information PDF that communicates your idea and engages your audience. Whether youre presenting a business or an educational presentation, pre designed presentation templates help save time. Flexible Working Policies And Guidelines Dashboard To Analyze Flexible Working Strategies Information PDF is highly customizable and very easy to edit, covering many different styles from creative to business presentations. Slidegeeks has creative team members who have crafted amazing templates. So, go and get them without any delay.
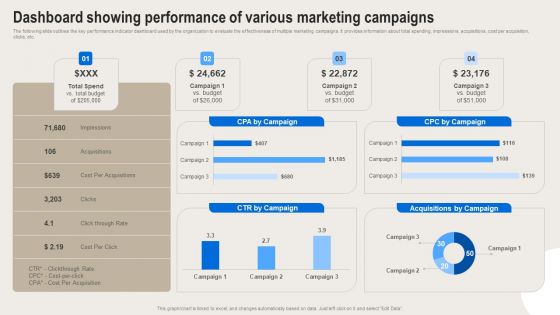
Formulating Branding Strategy To Enhance Revenue And Sales Dashboard Showing Performance Of Various Graphics PDF
The following slide outlines the key performance indicator dashboard used by the organization to evaluate the effectiveness of multiple marketing campaigns. It provides information about total spending, impressions, acquisitions, cost per acquisition, clicks, etc. Create an editable Formulating Branding Strategy To Enhance Revenue And Sales Dashboard Showing Performance Of Various Graphics PDF that communicates your idea and engages your audience. Whether youre presenting a business or an educational presentation, pre designed presentation templates help save time. Formulating Branding Strategy To Enhance Revenue And Sales Dashboard Showing Performance Of Various Graphics PDF is highly customizable and very easy to edit, covering many different styles from creative to business presentations. Slidegeeks has creative team members who have crafted amazing templates. So, go and get them without any delay.
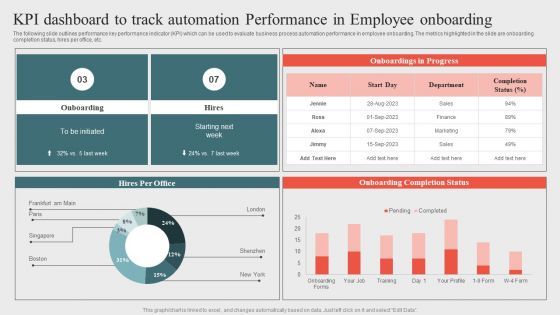
Kpi Dashboard To Track Automation Performanceoptimizing Business Processes Through Automation Summary PDF
The following slide outlines performance key performance indicator KPI which can be used to evaluate business process automation performance in employee onboarding. The metrics highlighted in the slide are onboarding completion status, hires per office, etc. Do you have to make sure that everyone on your team knows about any specific topic I yes, then you should give Kpi Dashboard To Track Automation Performanceoptimizing Business Processes Through Automation Summary PDF a try. Our experts have put a lot of knowledge and effort into creating this impeccable Kpi Dashboard To Track Automation Performanceoptimizing Business Processes Through Automation Summary PDF. You can use this template for your upcoming presentations, as the slides are perfect to represent even the tiniest detail. You can download these templates from the Slidegeeks website and these are easy to edit. So grab these today.
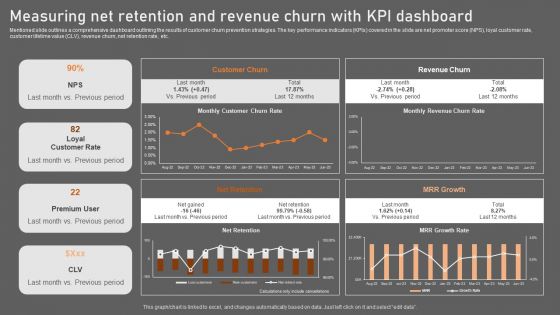
Measuring Net Retention And Revenue Churn With KPI Dashboard Introduction PDF
Mentioned slide outlines a comprehensive dashboard outlining the results of customer churn prevention strategies. The key performance indicators KPIs covered in the slide are net promoter score NPS, loyal customer rate, customer lifetime value CLV, revenue churn, net retention rate, etc. Do you have to make sure that everyone on your team knows about any specific topic I yes, then you should give Measuring Net Retention And Revenue Churn With KPI Dashboard Introduction PDF a try. Our experts have put a lot of knowledge and effort into creating this impeccable Measuring Net Retention And Revenue Churn With KPI Dashboard Introduction PDF. You can use this template for your upcoming presentations, as the slides are perfect to represent even the tiniest detail. You can download these templates from the Slidegeeks website and these are easy to edit. So grab these today.

KPI Metrics Dashboard Highlighting Employee Retention Rate Structure PDF
The purpose of this slide is to exhibit a key performance indicator KPI dashboard through which managers can analyze the monthly employee retention rate. The metrics covered in the slide are active employees, new candidates hired, internal, exit, employee turnover rate, etc. Do you have to make sure that everyone on your team knows about any specific topic I yes, then you should give KPI Metrics Dashboard Highlighting Employee Retention Rate Structure PDF a try. Our experts have put a lot of knowledge and effort into creating this impeccable KPI Metrics Dashboard Highlighting Employee Retention Rate Structure PDF. You can use this template for your upcoming presentations, as the slides are perfect to represent even the tiniest detail. You can download these templates from the Slidegeeks website and these are easy to edit. So grab these today.

Tiktok Digital Marketing Campaign Vet Potential Tiktok Influencers Key Metrics Download PDF
This slide represents the analysis of key performance indicators of the selected potential TikTok influencer by the marketers for their influencer marketing campaign. It includes details related to key metrics such as engagement rate, followers count etc. Do you have to make sure that everyone on your team knows about any specific topic I yes, then you should give Tiktok Digital Marketing Campaign Vet Potential Tiktok Influencers Key Metrics Download PDF a try. Our experts have put a lot of knowledge and effort into creating this impeccable Tiktok Digital Marketing Campaign Vet Potential Tiktok Influencers Key Metrics Download PDF. You can use this template for your upcoming presentations, as the slides are perfect to represent even the tiniest detail. You can download these templates from the Slidegeeks website and these are easy to edit. So grab these today

Relationship Management Solutions Impact On Customers Slides PDF
Following slide outlines various KPIs metrics which can be used by businesses to determine the impact of relationship management strategies on employees. It includes key performance indicators such as average employee performance rate, employee motivation level, employee turnover, number of complaints received, etc. Do you have to make sure that everyone on your team knows about any specific topic I yes, then you should give Relationship Management Solutions Impact On Customers Slides PDF a try. Our experts have put a lot of knowledge and effort into creating this impeccable Relationship Management Solutions Impact On Customers Slides PDF. You can use this template for your upcoming presentations, as the slides are perfect to represent even the tiniest detail. You can download these templates from the Slidegeeks website and these are easy to edit. So grab these today

Retail Outlet Opening To Enhance Product Sale Kpi Metrics Dashboard For New Retail Store Mockup PDF
The following slide showcases key performance indicator KPI dashboard for retail store. The dashboard covers major KPIs such as return resources, perfect order rate, total orders and top seller by orders. Do you have to make sure that everyone on your team knows about any specific topic I yes, then you should give Retail Outlet Opening To Enhance Product Sale Kpi Metrics Dashboard For New Retail Store Mockup PDF a try. Our experts have put a lot of knowledge and effort into creating this impeccable Retail Outlet Opening To Enhance Product Sale Kpi Metrics Dashboard For New Retail Store Mockup PDF. You can use this template for your upcoming presentations, as the slides are perfect to represent even the tiniest detail. You can download these templates from the Slidegeeks website and these are easy to edit. So grab these today.
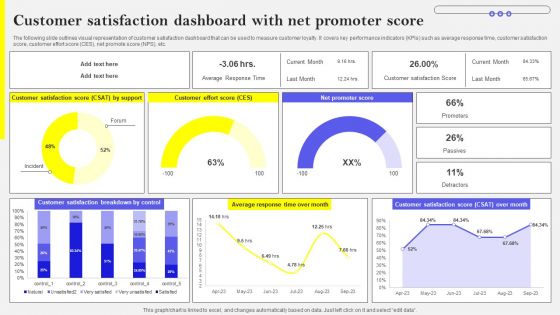
Customer Satisfaction Dashboard With Net Promoter Score Introduction PDF
The following slide outlines visual representation of customer satisfaction dashboard that can be used to measure customer loyalty. It covers key performance indicators KPIs such as average response time, customer satisfaction score, customer effort score CES, net promote score NPS, etc. Do you have to make sure that everyone on your team knows about any specific topic I yes, then you should give Customer Satisfaction Dashboard With Net Promoter Score Introduction PDF a try. Our experts have put a lot of knowledge and effort into creating this impeccable Customer Satisfaction Dashboard With Net Promoter Score Introduction PDF. You can use this template for your upcoming presentations, as the slides are perfect to represent even the tiniest detail. You can download these templates from the Slidegeeks website and these are easy to edit. So grab these today
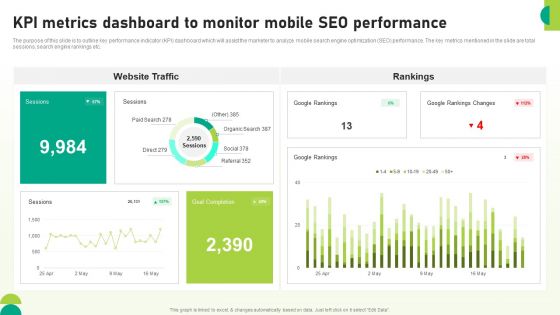
Utilizing SEO To Boost Customer KPI Metrics Dashboard To Monitor Mobile Seo Performance Download PDF
The purpose of this slide is to outline key performance indicator KPI dashboard which will assist the marketer to analyze mobile search engine optimization SEO performance. The key metrics mentioned in the slide are total sessions, search engine rankings etc. Coming up with a presentation necessitates that the majority of the effort goes into the content and the message you intend to convey. The visuals of a PowerPoint presentation can only be effective if it supplements and supports the story that is being told. Keeping this in mind our experts created Utilizing SEO To Boost Customer KPI Metrics Dashboard To Monitor Mobile Seo Performance Download PDF to reduce the time that goes into designing the presentation. This way, you can concentrate on the message while our designers take care of providing you with the right template for the situation.

Kpi Metrics Dashboard Post Resolving Workplace Conflict Managing Organizational Conflicts To Boost Pictures PDF
The purpose of this slide is to outline key performance indicator KPI dashboard showcasing the results post resolving organizational conflicts. The metrics covered in this slide are conflicts by departments, conflicts logged by gender etc. Are you in need of a template that can accommodate all of your creative concepts This one is crafted professionally and can be altered to fit any style. Use it with Google Slides or PowerPoint. Include striking photographs, symbols, depictions, and other visuals. Fill, move around, or remove text boxes as desired. Test out color palettes and font mixtures. Edit and save your work, or work with colleagues. Download Kpi Metrics Dashboard Post Resolving Workplace Conflict Managing Organizational Conflicts To Boost Pictures PDF and observe how to make your presentation outstanding. Give an impeccable presentation to your group and make your presentation unforgettable.
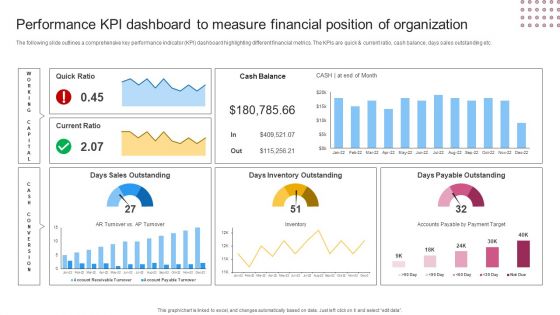
Performance KPI Dashboard To Measure Financial Position Of Organization Pictures PDF
The following slide outlines a comprehensive key performance indicator KPI dashboard highlighting different financial metrics. The KPIs are quick and current ratio, cash balance, days sales outstanding etc. Slidegeeks is here to make your presentations a breeze with Performance KPI Dashboard To Measure Financial Position Of Organization Pictures PDF With our easy to use and customizable templates, you can focus on delivering your ideas rather than worrying about formatting. With a variety of designs to choose from, you are sure to find one that suits your needs. And with animations and unique photos, illustrations, and fonts, you can make your presentation pop. So whether you are giving a sales pitch or presenting to the board, make sure to check out Slidegeeks first.
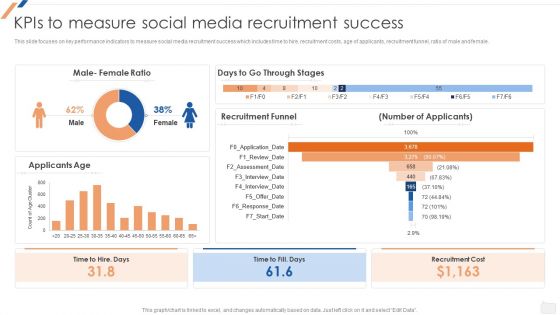
Kpis To Measure Social Media Recruitment Success Enhancing Social Media Recruitment Process Mockup PDF
This slide focuses on key performance indicators to measure social media recruitment success which includes time to hire, recruitment costs, age of applicants, recruitment funnel, ratio of male and female.Crafting an eye-catching presentation has never been more straightforward. Let your presentation shine with this tasteful yet straightforward Kpis To Measure Social Media Recruitment Success Enhancing Social Media Recruitment Process Mockup PDF template. It offers a minimalistic and classy look that is great for making a statement. The colors have been employed intelligently to add a bit of playfulness while still remaining professional. Construct the ideal Kpis To Measure Social Media Recruitment Success Enhancing Social Media Recruitment Process Mockup PDF that effortlessly grabs the attention of your audience Begin now and be certain to wow your customers.
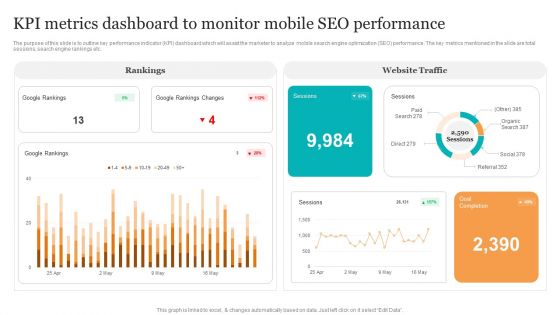
KPI Metrics Dashboard To Monitor Mobile Seo Performance Search Engine Optimization Services To Minimize Graphics PDF
The purpose of this slide is to outline key performance indicator KPI dashboard which will assist the marketer to analyze mobile search engine optimization SEO performance. The key metrics mentioned in the slide are total sessions, search engine rankings etc. Present like a pro with KPI Metrics Dashboard To Monitor Mobile Seo Performance Search Engine Optimization Services To Minimize Graphics PDF Create beautiful presentations together with your team, using our easy-to-use presentation slides. Share your ideas in real-time and make changes on the fly by downloading our templates. So whether you are in the office, on the go, or in a remote location, you can stay in sync with your team and present your ideas with confidence. With Slidegeeks presentation got a whole lot easier. Grab these presentations today.
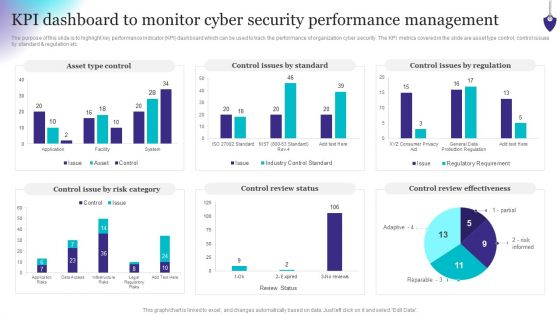
Organizing Security Awareness KPI Dashboard To Monitor Cyber Security Performance Ideas PDF
The purpose of this slide is to highlight key performance indicator KPI dashboard which can be used to track the performance of organization cyber security. The KPI metrics covered in the slide are asset type control, control issues by standard and regulation etc. This modern and well-arranged Organizing Security Awareness KPI Dashboard To Monitor Cyber Security Performance Ideas PDF provides lots of creative possibilities. It is very simple to customize and edit with the Powerpoint Software. Just drag and drop your pictures into the shapes. All facets of this template can be edited with Powerpoint, no extra software is necessary. Add your own material, put your images in the places assigned for them, adjust the colors, and then you can show your slides to the world, with an animated slide included.

Dashboard To Assess Ecommerce Financial Performance Across Regions Financial Management Strategies Clipart PDF
This slide showcases ecommerce key performance indicators KPI dashboard with financial statement. It provides information about total sales, orders, net profit, net profit margin, average order value, channels, etc.Present like a pro with Dashboard To Assess Ecommerce Financial Performance Across Regions Financial Management Strategies Clipart PDF Create beautiful presentations together with your team, using our easy-to-use presentation slides. Share your ideas in real-time and make changes on the fly by downloading our templates. So whether you are in the office, on the go, or in a remote location, you can stay in sync with your team and present your ideas with confidence. With Slidegeeks presentation got a whole lot easier. Grab these presentations today.

Kpi Dashboard To Analyze In Store Merchandising Strategy Performance Retail Merchandising Techniques Structure PDF
The following slide outlines a performance key performance indicator KPI dashboard used to evaluate the effectiveness of in-store merchandising strategy. The KPIs covered in the slide are total sales, average inventory, active stores, distinct products sold, etc.The Kpi Dashboard To Analyze In Store Merchandising Strategy Performance Retail Merchandising Techniques Structure PDF is a compilation of the most recent design trends as a series of slides. It is suitable for any subject or industry presentation, containing attractive visuals and photo spots for businesses to clearly express their messages. This template contains a variety of slides for the user to input data, such as structures to contrast two elements, bullet points, and slides for written information. Slidegeeks is prepared to create an impression.
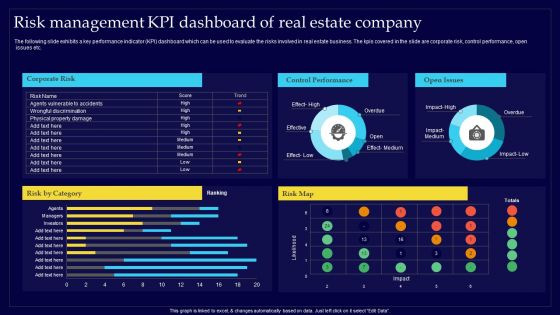
Executing Risk Mitigation Risk Management KPI Dashboard Of Real Estate Company Portrait PDF
The following slide exhibits a key performance indicator KPI dashboard which can be used to evaluate the risks involved in real estate business. The kpis covered in the slide are corporate risk, control performance, open issues etc. This modern and well-arranged Executing Risk Mitigation Risk Management KPI Dashboard Of Real Estate Company Portrait PDF provides lots of creative possibilities. It is very simple to customize and edit with the Powerpoint Software. Just drag and drop your pictures into the shapes. All facets of this template can be edited with Powerpoint, no extra software is necessary. Add your own material, put your images in the places assigned for them, adjust the colors, and then you can show your slides to the world, with an animated slide included.
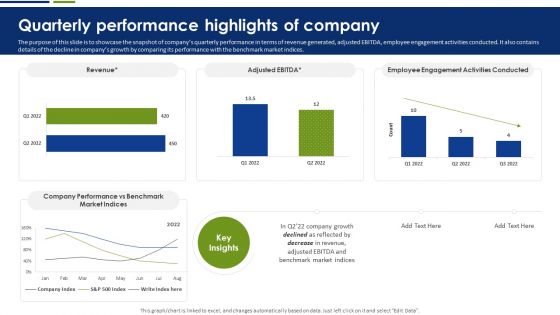
Quarterly Performance Highlights Of Company Brochure PDF
The purpose of this slide is to showcase the snapshot of companys quarterly performance in terms of revenue generated, adjusted EBITDA, employee engagement activities conducted. It also contains details of the decline in companys growth by comparing its performance with the benchmark market indices. This Quarterly Performance Highlights Of Company Brochure PDF is perfect for any presentation, be it in front of clients or colleagues. It is a versatile and stylish solution for organizing your meetings. The Quarterly Performance Highlights Of Company Brochure PDF features a modern design for your presentation meetings. The adjustable and customizable slides provide unlimited possibilities for acing up your presentation. Slidegeeks has done all the homework before launching the product for you. So, do not wait, grab the presentation templates today.
Shipping And Logistics Tracking Dashboard With Shipments And Fleet Status Ideas PDF
This slide covers Key performance indicators to track the automation system of the company. This dashboard includes Logistics Efficiency Status, delivery time accuracy etc. Get a simple yet stunning designed Shipping And Logistics Tracking Dashboard With Shipments And Fleet Status Ideas PDF. It is the best one to establish the tone in your meetings. It is an excellent way to make your presentations highly effective. So, download this PPT today from Slidegeeks and see the positive impacts. Our easy to edit Shipping And Logistics Tracking Dashboard With Shipments And Fleet Status Ideas PDF can be your go to option for all upcoming conferences and meetings. So, what are you waiting for Grab this template today.
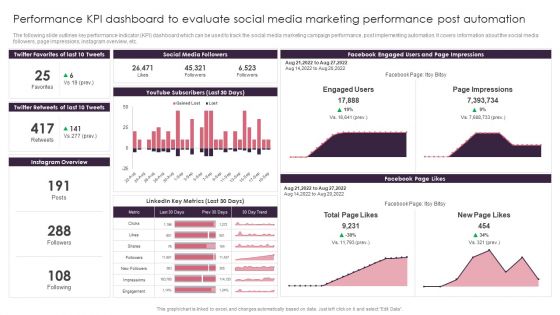
Performance KPI Dashboard To Evaluate Social Media Marketing Performance Post Automation Formats PDF
The following slide outlines key performance indicator KPI dashboard which can be used to track the social media marketing campaign performance, post implementing automation. It covers information about the social media followers, page impressions, instagram overview, etc. Slidegeeks is here to make your presentations a breeze with Performance KPI Dashboard To Evaluate Social Media Marketing Performance Post Automation Formats PDF With our easy to use and customizable templates, you can focus on delivering your ideas rather than worrying about formatting. With a variety of designs to choose from, you are sure to find one that suits your needs. And with animations and unique photos, illustrations, and fonts, you can make your presentation pop. So whether you are giving a sales pitch or presenting to the board, make sure to check out Slidegeeks first.

Executing Video Promotional KPI Dashboard To Measure Effectiveness Of Youtube Marketing Professional PDF
The following slide outlines key performance indicator KPI dashboard which will assist the marketer to track YouTube marketing campaign performance. The key metrics covered in the slide are subscribers gained and lost, likes, dislikes, comments, shares etc. Formulating a presentation can take up a lot of effort and time, so the content and message should always be the primary focus. The visuals of the PowerPoint can enhance the presenters message, so our Executing Video Promotional KPI Dashboard To Measure Effectiveness Of Youtube Marketing Professional PDF was created to help save time. Instead of worrying about the design, the presenter can concentrate on the message while our designers work on creating the ideal templates for whatever situation is needed. Slidegeeks has experts for everything from amazing designs to valuable content, we have put everything into Executing Video Promotional KPI Dashboard To Measure Effectiveness Of Youtube Marketing Professional PDF
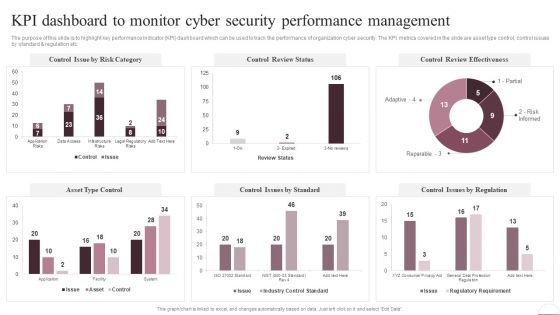
Prevention Of Information KPI Dashboard To Monitor Cyber Security Performance Information PDF
The purpose of this slide is to highlight key performance indicator KPI dashboard which can be used to track the performance of organization cyber security. The KPI metrics covered in the slide are asset type control, control issues by standard AND regulation etc. This Prevention Of Information KPI Dashboard To Monitor Cyber Security Performance Information PDF is perfect for any presentation, be it in front of clients or colleagues. It is a versatile and stylish solution for organizing your meetings. The Prevention Of Information KPI Dashboard To Monitor Cyber Security Performance Information PDF features a modern design for your presentation meetings. The adjustable and customizable slides provide unlimited possibilities for acing up your presentation. Slidegeeks has done all the homework before launching the product for you. So, dont wait, grab the presentation templates today
Using Social Media Platforms To Enhance Dashboard For Tracking Social Media Kpis Formats PDF
This slide shows dashboard for tracking social media key performance indicators KPIs. It provides details about average social engagement, reactions, comments, shares, clicks, thumbnail, platform, post message, etc. Are you in need of a template that can accommodate all of your creative concepts This one is crafted professionally and can be altered to fit any style. Use it with Google Slides or PowerPoint. Include striking photographs, symbols, depictions, and other visuals. Fill, move around, or remove text boxes as desired. Test out color palettes and font mixtures. Edit and save your work, or work with colleagues. Download Using Social Media Platforms To Enhance Dashboard For Tracking Social Media Kpis Formats PDF and observe how to make your presentation outstanding. Give an impeccable presentation to your group and make your presentation unforgettable.

Estimating Business Overall Activity Ratios To Determine Organization Efficiency In Utilizing Topics PDF
The following slide outlines efficiency ratios which can be used to indicate the company efficiency in utilizing the assets. Information covered in this slide is related to inventory and total assets turnover ratio. Are you in need of a template that can accommodate all of your creative concepts This one is crafted professionally and can be altered to fit any style. Use it with Google Slides or PowerPoint. Include striking photographs, symbols, depictions, and other visuals. Fill, move around, or remove text boxes as desired. Test out color palettes and font mixtures. Edit and save your work, or work with colleagues. Download Estimating Business Overall Activity Ratios To Determine Organization Efficiency In Utilizing Topics PDF and observe how to make your presentation outstanding. Give an impeccable presentation to your group and make your presentation unforgettable.

Estimating Business Overall Kpi Metrics Dashboard Highlighting Organization Revenue Clipart PDF
The following slide outlines key performance indicator KPI dashboard showcasing various financial metrics of the organization. The key metrics are gross revenue, product revenue, service revenue, gross profit, net profit etc. Formulating a presentation can take up a lot of effort and time, so the content and message should always be the primary focus. The visuals of the PowerPoint can enhance the presenters message, so our Estimating Business Overall Kpi Metrics Dashboard Highlighting Organization Revenue Clipart PDF was created to help save time. Instead of worrying about the design, the presenter can concentrate on the message while our designers work on creating the ideal templates for whatever situation is needed. Slidegeeks has experts for everything from amazing designs to valuable content, we have put everything into Estimating Business Overall Kpi Metrics Dashboard Highlighting Organization Revenue Clipart PDF.

Company Budget Analysis Quarterly Performance Highlights Of Company Ideas PDF
The purpose of this slide is to showcase the snapshot of companys quarterly performance in terms of revenue generated, adjusted EBITDA, employee engagement activities conducted. It also contains details of the decline in companys growth by comparing its performance with the benchmark market indices. Formulating a presentation can take up a lot of effort and time, so the content and message should always be the primary focus. The visuals of the PowerPoint can enhance the presenters message, so our Company Budget Analysis Quarterly Performance Highlights Of Company Ideas PDF was created to help save time. Instead of worrying about the design, the presenter can concentrate on the message while our designers work on creating the ideal templates for whatever situation is needed. Slidegeeks has experts for everything from amazing designs to valuable content, we have put everything into Company Budget Analysis Quarterly Performance Highlights Of Company Ideas PDF.
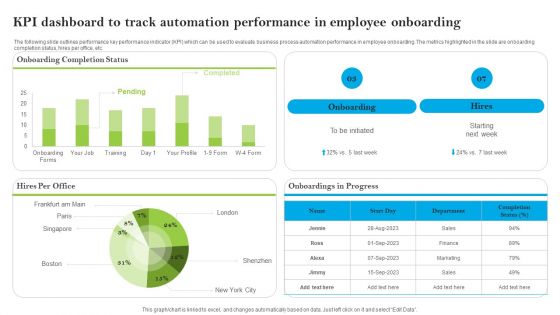
Introducing AI Tools KPI Dashboard To Track Automation Performance In Employee Formats PDF
The following slide outlines performance key performance indicator KPI which can be used to evaluate business process automation performance in employee onboarding. The metrics highlighted in the slide are onboarding completion status, hires per office, etc. This modern and well-arranged Introducing AI Tools KPI Dashboard To Track Automation Performance In Employee Formats PDF provides lots of creative possibilities. It is very simple to customize and edit with the Powerpoint Software. Just drag and drop your pictures into the shapes. All facets of this template can be edited with Powerpoint, no extra software is necessary. Add your own material, put your images in the places assigned for them, adjust the colors, and then you can show your slides to the world, with an animated slide included.
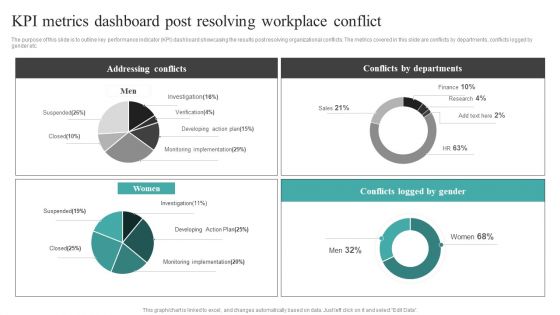
Common Conflict Situations Kpi Metrics Dashboard Post Resolving Workplace Information PDF
The purpose of this slide is to outline key performance indicator KPI dashboard showcasing the results post resolving organizational conflicts. The metrics covered in this slide are conflicts by departments, conflicts logged by gender etc. The Common Conflict Situations Kpi Metrics Dashboard Post Resolving Workplace Information PDF is a compilation of the most recent design trends as a series of slides. It is suitable for any subject or industry presentation, containing attractive visuals and photo spots for businesses to clearly express their messages. This template contains a variety of slides for the user to input data, such as structures to contrast two elements, bullet points, and slides for written information. Slidegeeks is prepared to create an impression.

Optimizing Online Stores Key Metrics To Measure Current Performance Download PDF
This slide represents the key performance indicators to track and monitor the performance of ecommerce website to draw effective strategies to tackle the problems. It includes key metrics for ecommerce website performance measurement such as average order value and shopping cart abandonment rate. The Optimizing Online Stores Key Metrics To Measure Current Performance Download PDF is a compilation of the most recent design trends as a series of slides. It is suitable for any subject or industry presentation, containing attractive visuals and photo spots for businesses to clearly express their messages. This template contains a variety of slides for the user to input data, such as structures to contrast two elements, bullet points, and slides for written information. Slidegeeks is prepared to create an impression.
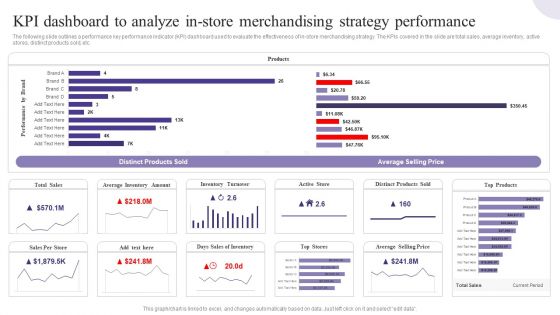
KPI Dashboard To Analyze In Store Merchandising Strategy Performance Introduction PDF
The following slide outlines a performance key performance indicator KPI dashboard used to evaluate the effectiveness of in-store merchandising strategy. The KPIs covered in the slide are total sales, average inventory, active stores, distinct products sold, etc. Formulating a presentation can take up a lot of effort and time, so the content and message should always be the primary focus. The visuals of the PowerPoint can enhance the presenters message, so our KPI Dashboard To Analyze In Store Merchandising Strategy Performance Introduction PDF was created to help save time. Instead of worrying about the design, the presenter can concentrate on the message while our designers work on creating the ideal templates for whatever situation is needed. Slidegeeks has experts for everything from amazing designs to valuable content, we have put everything into KPI Dashboard To Analyze In Store Merchandising Strategy Performance Introduction PDF.

KPI Dashboard To Analyze In Store Merchandising Strategy Performance Pictures PDF
The following slide outlines a performance key performance indicator KPI dashboard used to evaluate the effectiveness of in-store merchandising strategy. The KPIs covered in the slide are total sales, average inventory, active stores, distinct products sold, etc. Formulating a presentation can take up a lot of effort and time, so the content and message should always be the primary focus. The visuals of the PowerPoint can enhance the presenters message, so our KPI Dashboard To Analyze In Store Merchandising Strategy Performance Pictures PDF was created to help save time. Instead of worrying about the design, the presenter can concentrate on the message while our designers work on creating the ideal templates for whatever situation is needed. Slidegeeks has experts for everything from amazing designs to valuable content, we have put everything into KPI Dashboard To Analyze In Store Merchandising Strategy Performance Pictures PDF.
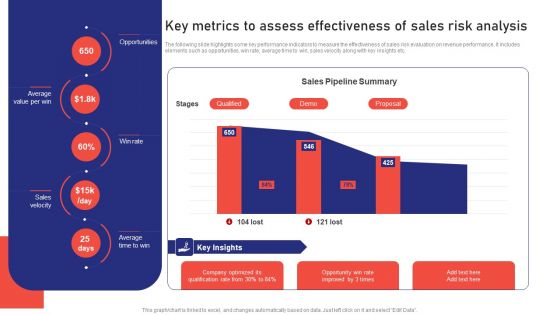
Sales Risk Assessment For Profit Maximization Key Metrics To Assess Effectiveness Of Sales Risk Analysis Ideas PDF
The following slide highlights some key performance indicators to measure the effectiveness of sales risk evaluation on revenue performance. It includes elements such as opportunities, win rate, average time to win, sales velocity along with key insights etc. Get a simple yet stunning designed Sales Risk Assessment For Profit Maximization Key Metrics To Assess Effectiveness Of Sales Risk Analysis Ideas PDF. It is the best one to establish the tone in your meetings. It is an excellent way to make your presentations highly effective. So, download this PPT today from Slidegeeks and see the positive impacts. Our easy to edit Sales Risk Assessment For Profit Maximization Key Metrics To Assess Effectiveness Of Sales Risk Analysis Ideas PDF can be your go to option for all upcoming conferences and meetings. So, what are you waiting for Grab this template today.
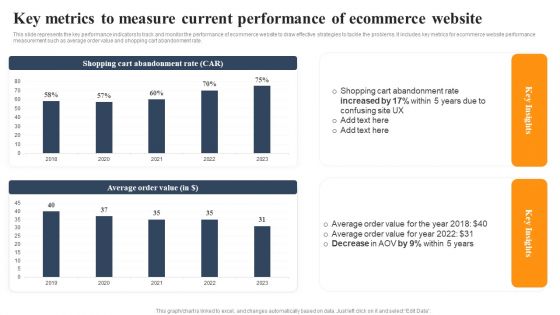
Implementing An Effective Ecommerce Management Framework Key Metrics Current Performance Of Ecommerce Website Slides PDF
This slide represents the key performance indicators to track and monitor the performance of ecommerce website to draw effective strategies to tackle the problems. It includes key metrics for ecommerce website performance measurement such as average order value and shopping cart abandonment rate. The Implementing An Effective Ecommerce Management Framework Key Metrics Current Performance Of Ecommerce Website Slides PDF is a compilation of the most recent design trends as a series of slides. It is suitable for any subject or industry presentation, containing attractive visuals and photo spots for businesses to clearly express their messages. This template contains a variety of slides for the user to input data, such as structures to contrast two elements, bullet points, and slides for written information. Slidegeeks is prepared to create an impression.
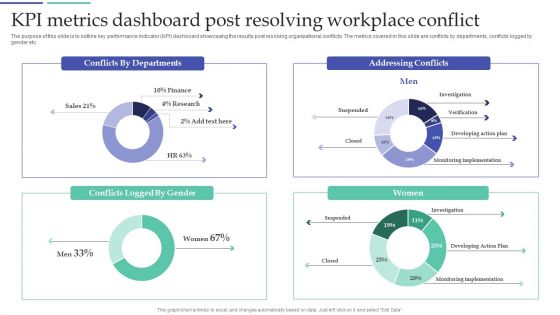
Resolving Team Disputes In Organization KPI Metrics Dashboard Post Resolving Workplace Conflict Pictures PDF
The purpose of this slide is to outline key performance indicator KPI dashboard showcasing the results post resolving organizational conflicts. The metrics covered in this slide are conflicts by departments, conflicts logged by gender etc. Get a simple yet stunning designed Resolving Team Disputes In Organization KPI Metrics Dashboard Post Resolving Workplace Conflict Pictures PDF. It is the best one to establish the tone in your meetings. It is an excellent way to make your presentations highly effective. So, download this PPT today from Slidegeeks and see the positive impacts. Our easy to edit Resolving Team Disputes In Organization KPI Metrics Dashboard Post Resolving Workplace Conflict Pictures PDF can be your go-to option for all upcoming conferences and meetings. So, what are you waiting for Grab this template today.
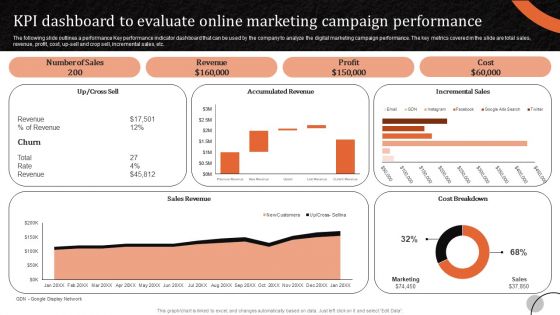
Marketing Tactics To Increase KPI Dashboard To Evaluate Online Marketing Campaign Infographics PDF
The following slide outlines a performance Key performance indicator dashboard that can be used by the company to analyze the digital marketing campaign performance. The key metrics covered in the slide are total sales, revenue, profit, cost, up-sell and crop sell, incremental sales, etc. Want to ace your presentation in front of a live audience Our Marketing Tactics To Increase KPI Dashboard To Evaluate Online Marketing Campaign Infographics PDF can help you do that by engaging all the users towards you. Slidegeeks experts have put their efforts and expertise into creating these impeccable powerpoint presentations so that you can communicate your ideas clearly. Moreover, all the templates are customizable, and easy-to-edit and downloadable. Use these for both personal and commercial use.
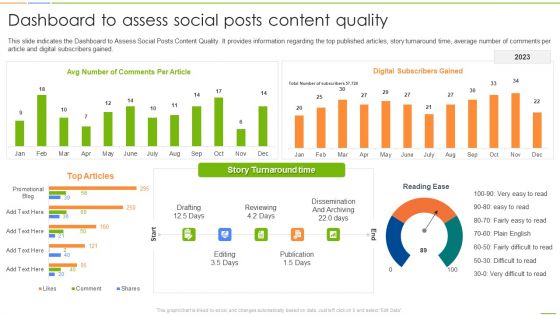
Social Media Channels Auditing Dashboard To Assess Social Posts Content Quality Sample PDF
This slide indicates the Dashboard to Assess Social Posts Content Quality. It provides information regarding the top published articles, story turnaround time, average number of comments per article and digital subscribers gained. Get a simple yet stunning designed Social Media Channels Auditing Dashboard To Assess Social Posts Content Quality Sample PDF. It is the best one to establish the tone in your meetings. It is an excellent way to make your presentations highly effective. So, download this PPT today from Slidegeeks and see the positive impacts. Our easy-to-edit Social Media Channels Auditing Dashboard To Assess Social Posts Content Quality Sample PDF can be your go-to option for all upcoming conferences and meetings. So, what are you waiting for Grab this template today.
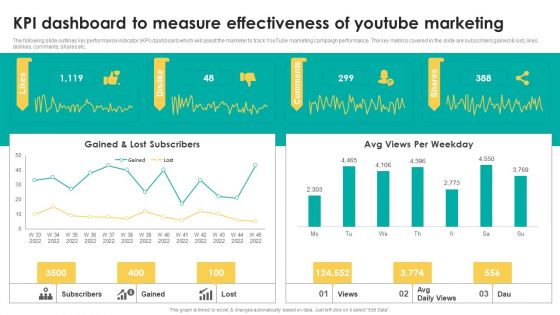
KPI Dashboard To Measure Effectiveness Of Youtube Marketing Pictures PDF
The following slide outlines key performance indicator KPI dashboard which will assist the marketer to track YouTube marketing campaign performance. The key metrics covered in the slide are subscribers gained and lost, likes, dislikes, comments, shares etc. Present like a pro with KPI Dashboard To Measure Effectiveness Of Youtube Marketing Pictures PDF Create beautiful presentations together with your team, using our easy to use presentation slides. Share your ideas in real time and make changes on the fly by downloading our templates. So whether you are in the office, on the go, or in a remote location, you can stay in sync with your team and present your ideas with confidence. With Slidegeeks presentation got a whole lot easier. Grab these presentations today.
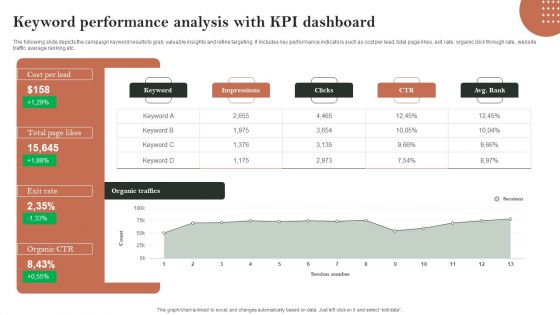
Search Engine Marketing Keyword Performance Analysis With Kpi Dashboard Brochure PDF
The following slide depicts the campaign keyword results to grab valuable insights and refine targeting. It includes key performance indicators such as cost per lead, total page likes, exit rate, organic click through rate, website traffic average ranking etc. Get a simple yet stunning designed Search Engine Marketing Keyword Performance Analysis With Kpi Dashboard Brochure PDF. It is the best one to establish the tone in your meetings. It is an excellent way to make your presentations highly effective. So, download this PPT today from Slidegeeks and see the positive impacts. Our easy-to-edit Search Engine Marketing Keyword Performance Analysis With Kpi Dashboard Brochure PDF can be your go-to option for all upcoming conferences and meetings. So, what are you waiting for Grab this template today.
Guidebook For Executing Business Market Intelligence Online Tracking To Optimize Website Information PDF
The following slide provides overview of performance indicators for online tracking to manage and optimize user behavior on website. It highlights metrics such as web conversions, users, top landing pages, bounce rate, conversion rate, page, sessions and goals value. Want to ace your presentation in front of a live audience Our Guidebook For Executing Business Market Intelligence Online Tracking To Optimize Website Information PDF can help you do that by engaging all the users towards you. Slidegeeks experts have put their efforts and expertise into creating these impeccable powerpoint presentations so that you can communicate your ideas clearly. Moreover, all the templates are customizable, and easy to edit and downloadable. Use these for both personal and commercial use.

Measuring Net Retention And Revenue Churn With Kpi Dashboard Ideas PDF
Mentioned slide outlines a comprehensive dashboard outlining the results of customer churn prevention strategies. The key performance indicators KPIs covered in the slide are net promoter score NPS, loyal customer rate, customer lifetime value CLV, revenue churn, net retention rate, etc. The Measuring Net Retention And Revenue Churn With Kpi Dashboard Ideas PDF is a compilation of the most recent design trends as a series of slides. It is suitable for any subject or industry presentation, containing attractive visuals and photo spots for businesses to clearly express their messages. This template contains a variety of slides for the user to input data, such as structures to contrast two elements, bullet points, and slides for written information. Slidegeeks is prepared to create an impression.

KPI Dashboard To Measure Effectiveness Of Real Estate Marketing Strategies Inspiration PDF
The following slide outlines performance key performance indicator KPI dashboard that can assist marketers to evaluate online and offline real estate promotional techniques performance. The metrics covered are quarterly sales, deals won, expired contracts, revenue, conversion rates, etc. Coming up with a presentation necessitates that the majority of the effort goes into the content and the message you intend to convey. The visuals of a PowerPoint presentation can only be effective if it supplements and supports the story that is being told. Keeping this in mind our experts created KPI Dashboard To Measure Effectiveness Of Real Estate Marketing Strategies Inspiration PDF to reduce the time that goes into designing the presentation. This way, you can concentrate on the message while our designers take care of providing you with the right template for the situation.
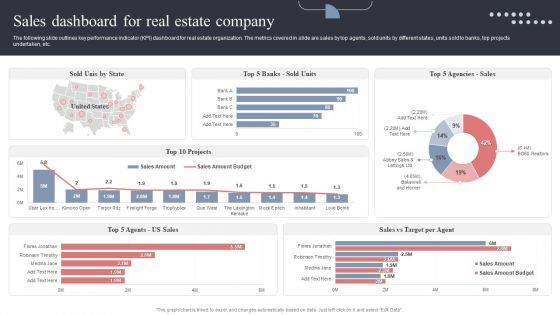
Sales Dashboard For Real Estate Company Topics PDF
The following slide outlines key performance indicator KPI dashboard for real estate organization. The metrics covered in slide are sales by top agents, sold units by different states, units sold to banks, top projects undertaken, etc. This Sales Dashboard For Real Estate Company Topics PDF is perfect for any presentation, be it in front of clients or colleagues. It is a versatile and stylish solution for organizing your meetings. The Sales Dashboard For Real Estate Company Topics PDF features a modern design for your presentation meetings. The adjustable and customizable slides provide unlimited possibilities for acing up your presentation. Slidegeeks has done all the homework before launching the product for you. So, do not wait, grab the presentation templates today

Footfall Analysis To Evaluate Shopping Center Ppt PowerPoint Presentation File Files PDF
This slide represents footfall analysis for evaluate the performance of shopping mall. It include indicators such as average footfall, most visited zone, new and returning users etc. QComing up with a presentation necessitates that the majority of the effort goes into the content and the message you intend to convey. The visuals of a PowerPoint presentation can only be effective if it supplements and supports the story that is being told. Keeping this in mind our experts created Footfall Analysis To Evaluate Shopping Center Ppt PowerPoint Presentation File Files PDF to reduce the time that goes into designing the presentation. This way, you can concentrate on the message while our designers take care of providing you with the right template for the situation.

Digital Health Interventions Digital Therapeutics Trends Over The Past Decade Rules PDF
This slide describes the digital therapeutics trial trends over the last ten years, from 2010 to 2019, and covers the percentage of trials undertaken on psychiatric indications, cardiovascular, endocrine, addiction, neurology, and respiratory. Formulating a presentation can take up a lot of effort and time, so the content and message should always be the primary focus. The visuals of the PowerPoint can enhance the presenters message, so our Digital Health Interventions Digital Therapeutics Trends Over The Past Decade Rules PDF was created to help save time. Instead of worrying about the design, the presenter can concentrate on the message while our designers work on creating the ideal templates for whatever situation is needed. Slidegeeks has experts for everything from amazing designs to valuable content, we have put everything into Digital Health Interventions Digital Therapeutics Trends Over The Past Decade Rules PDF
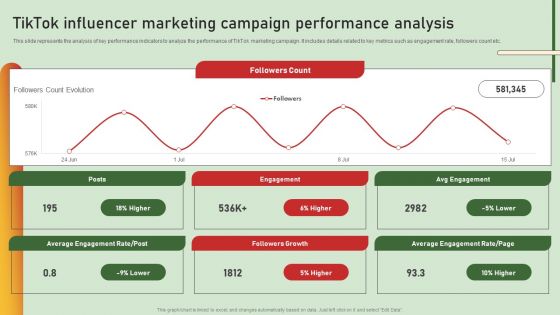
Comprehensive Influencer Promotional Guide To Improve Brand Reputation Tiktok Influencer Marketing Campaign Brochure PDF
This slide represents the analysis of key performance indicators to analyze the performance of TikTok marketing campaign. It includes details related to key metrics such as engagement rate, followers count etc. Present like a pro with Comprehensive Influencer Promotional Guide To Improve Brand Reputation Tiktok Influencer Marketing Campaign Brochure PDF Create beautiful presentations together with your team, using our easy to use presentation slides. Share your ideas in real time and make changes on the fly by downloading our templates. So whether you are in the office, on the go, or in a remote location, you can stay in sync with your team and present your ideas with confidence. With Slidegeeks presentation got a whole lot easier. Grab these presentations today.
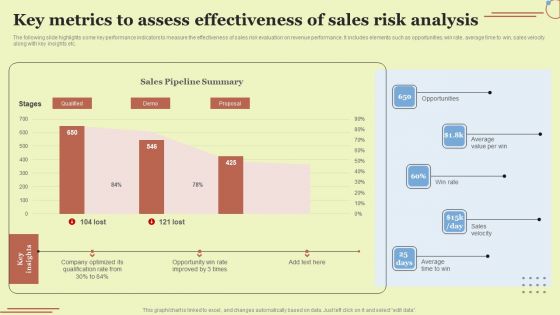
Key Metrics To Assess Effectiveness Of Sales Risk Analysis Download PDF
The following slide highlights some key performance indicators to measure the effectiveness of sales risk evaluation on revenue performance. It includes elements such as opportunities, win rate, average time to win, sales velocity along with key insights etc. Get a simple yet stunning designed Key Metrics To Assess Effectiveness Of Sales Risk Analysis Download PDF. It is the best one to establish the tone in your meetings. It is an excellent way to make your presentations highly effective. So, download this PPT today from Slidegeeks and see the positive impacts. Our easy to edit Key Metrics To Assess Effectiveness Of Sales Risk Analysis Download PDF can be your go to option for all upcoming conferences and meetings. So, what are you waiting for Grab this template today.
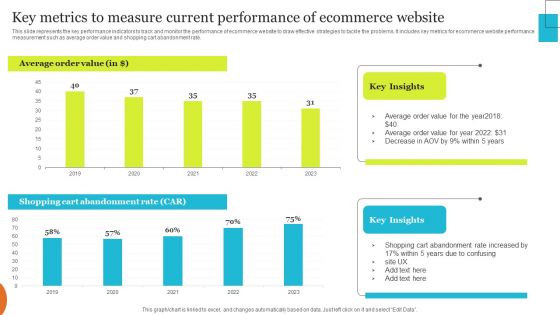
Implementing Effective Ecommerce Managemnet Platform Key Metrics To Measure Current Performance Clipart PDF
This slide represents the key performance indicators to track and monitor the performance of ecommerce website to draw effective strategies to tackle the problems. It includes key metrics for ecommerce website performance measurement such as average order value and shopping cart abandonment rate. Want to ace your presentation in front of a live audience Our Implementing Effective Ecommerce Managemnet Platform Key Metrics To Measure Current Performance Clipart PDF can help you do that by engaging all the users towards you. Slidegeeks experts have put their efforts and expertise into creating these impeccable powerpoint presentations so that you can communicate your ideas clearly. Moreover, all the templates are customizable, and easy to edit and downloadable. Use these for both personal and commercial use.
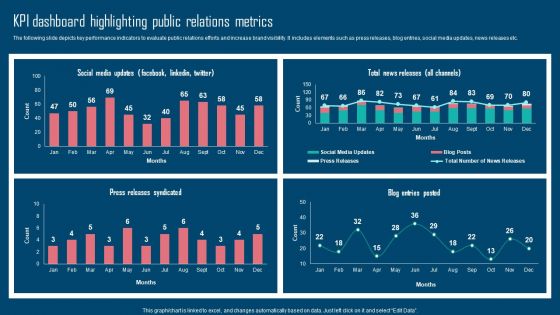
Adopting IMC Technique To Boost Brand Recognition Kpi Dashboard Highlighting Public Relations Metrics Brochure PDF
The following slide depicts key performance indicators to evaluate public relations efforts and increase brand visibility. It includes elements such as press releases, blog entries, social media updates, news releases etc. Formulating a presentation can take up a lot of effort and time, so the content and message should always be the primary focus. The visuals of the PowerPoint can enhance the presenters message, so our Adopting IMC Technique To Boost Brand Recognition Kpi Dashboard Highlighting Public Relations Metrics Brochure PDF was created to help save time. Instead of worrying about the design, the presenter can concentrate on the message while our designers work on creating the ideal templates for whatever situation is needed. Slidegeeks has experts for everything from amazing designs to valuable content, we have put everything into Adopting IMC Technique To Boost Brand Recognition Kpi Dashboard Highlighting Public Relations Metrics Brochure PDF
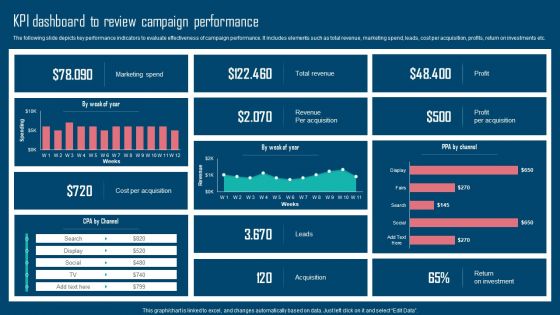
Adopting IMC Technique To Boost Brand Recognition Kpi Dashboard To Review Campaign Performance Pictures PDF
The following slide depicts key performance indicators to evaluate effectiveness of campaign performance. It includes elements such as total revenue, marketing spend, leads, cost per acquisition, profits, return on investments etc. This modern and well arranged Adopting IMC Technique To Boost Brand Recognition Kpi Dashboard To Review Campaign Performance Pictures PDF provides lots of creative possibilities. It is very simple to customize and edit with the Powerpoint Software. Just drag and drop your pictures into the shapes. All facets of this template can be edited with Powerpoint no extra software is necessary. Add your own material, put your images in the places assigned for them, adjust the colors, and then you can show your slides to the world, with an animated slide included.
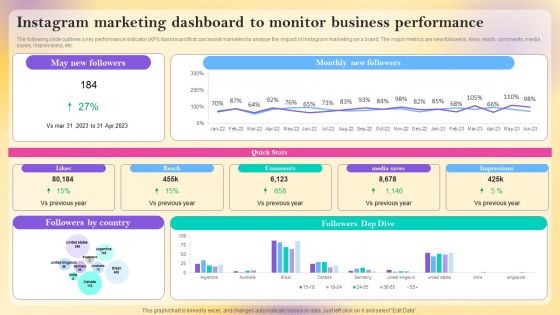
Instagram Marketing Dashboard To Monitor Business Performance Information PDF
The following slide outlines a key performance indicator KPI dashboard that can assist marketers to analyze the impact of Instagram marketing on a brand. The major metrics are new followers, likes, reach, comments, media saves, impressions, etc. This Instagram Marketing Dashboard To Monitor Business Performance Information PDF is perfect for any presentation, be it in front of clients or colleagues. It is a versatile and stylish solution for organizing your meetings. The product features a modern design for your presentation meetings. The adjustable and customizable slides provide unlimited possibilities for acing up your presentation. Slidegeeks has done all the homework before launching the product for you. So, do not wait, grab the presentation templates today

Video Promotion Service Investor Funding Elevator Pitch Deck Financial Performance Professional PDF
The slide mentions the revenue, run rate and margin percentage of the company indicating the growth in organizations financial performance Slidegeeks is here to make your presentations a breeze with Video Promotion Service Investor Funding Elevator Pitch Deck Financial Performance Professional PDF With our easy to use and customizable templates, you can focus on delivering your ideas rather than worrying about formatting. With a variety of designs to choose from, you are sure to find one that suits your needs. And with animations and unique photos, illustrations, and fonts, you can make your presentation pop. So whether you are giving a sales pitch or presenting to the board, make sure to check out Slidegeeks first.
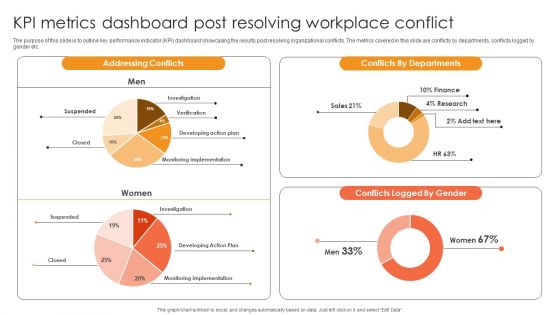
Kpi Metrics Dashboard Post Resolving Workplace Conflict Ppt Inspiration Graphics Download PDF
The purpose of this slide is to outline key performance indicator KPI dashboard showcasing the results post resolving organizational conflicts. The metrics covered in this slide are conflicts by departments, conflicts logged by gender etc. This Kpi Metrics Dashboard Post Resolving Workplace Conflict Ppt Inspiration Graphics Download PDF is perfect for any presentation, be it in front of clients or colleagues. It is a versatile and stylish solution for organizing your meetings. The Kpi Metrics Dashboard Post Resolving Workplace Conflict Ppt Inspiration Graphics Download PDF features a modern design for your presentation meetings. The adjustable and customizable slides provide unlimited possibilities for acing up your presentation. Slidegeeks has done all the homework before launching the product for you. So, do not wait, grab the presentation templates today
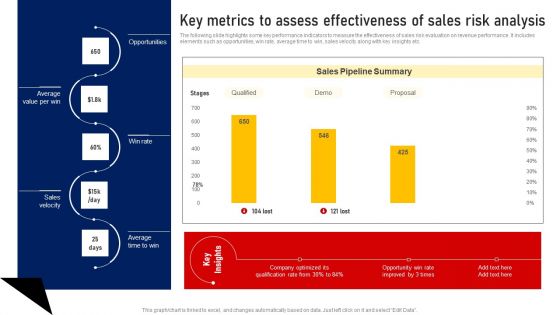
Performing Sales Risk Analysis Procedure Key Metrics To Assess Effectiveness Of Sales Risk Analysis Brochure PDF
The following slide highlights some key performance indicators to measure the effectiveness of sales risk evaluation on revenue performance. It includes elements such as opportunities, win rate, average time to win, sales velocity along with key insights etc. Get a simple yet stunning designed Performing Sales Risk Analysis Procedure Key Metrics To Assess Effectiveness Of Sales Risk Analysis Brochure PDF. It is the best one to establish the tone in your meetings. It is an excellent way to make your presentations highly effective. So, download this PPT today from Slidegeeks and see the positive impacts. Our easy to edit Performing Sales Risk Analysis Procedure Key Metrics To Assess Effectiveness Of Sales Risk Analysis Brochure PDF can be your go to option for all upcoming conferences and meetings. So, what are you waiting for Grab this template today.
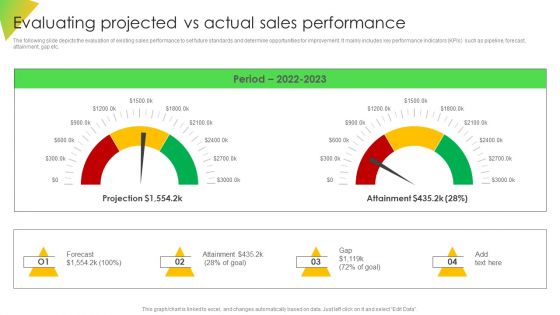
Evaluating Projected Vs Actual Sales Performance Microsoft PDF
The following slide depicts the evaluation of existing sales performance to set future standards and determine opportunities for improvement. It mainly includes key performance indicators KPIs such as pipeline, forecast, attainment, gap etc. Get a simple yet stunning designed Evaluating Projected Vs Actual Sales Performance Microsoft PDF. It is the best one to establish the tone in your meetings. It is an excellent way to make your presentations highly effective. So, download this PPT today from Slidegeeks and see the positive impacts. Our easy to edit Evaluating Projected Vs Actual Sales Performance Microsoft PDF can be your go to option for all upcoming conferences and meetings. So, what are you waiting for Grab this template today.

Assessing Impact Of Sales Risk Management With KPI Dashboard Ppt Professional Graphics Pictures PDF
The following slide highlights some key performance indicators KPIs to measure the influence of executing sales risk management strategies on revenue performance. It includes elements such as target attainment rate, gross profit, annual growth rate etc. Are you in need of a template that can accommodate all of your creative concepts This one is crafted professionally and can be altered to fit any style. Use it with Google Slides or PowerPoint. Include striking photographs, symbols, depictions, and other visuals. Fill, move around, or remove text boxes as desired. Test out color palettes and font mixtures. Edit and save your work, or work with colleagues. Download Assessing Impact Of Sales Risk Management With KPI Dashboard Ppt Professional Graphics Pictures PDF and observe how to make your presentation outstanding. Give an impeccable presentation to your group and make your presentation unforgettable.

Tactics For Establishing Sustainable Hybrid Work Environment Work From Home Performance Management Dashboard Information PDF
The following slide outlines a comprehensive key performance indicator KPI dashboard that can be used to showcase employees performance during work-from-home WFH. Information covered in this slide is related to average result area scores etc. Want to ace your presentation in front of a live audience Our Tactics For Establishing Sustainable Hybrid Work Environment Work From Home Performance Management Dashboard Information PDF can help you do that by engaging all the users towards you. Slidegeeks experts have put their efforts and expertise into creating these impeccable powerpoint presentations so that you can communicate your ideas clearly. Moreover, all the templates are customizable, and easy to edit and downloadable. Use these for both personal and commercial use.
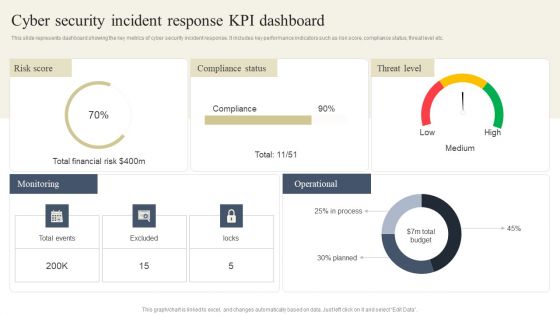
CYBER Security Breache Response Strategy Cyber Security Incident Response Kpi Dashboard Rules PDF
This slide represents dashboard showing the key metrics of cyber security incident response. It includes key performance indicators such as risk score, compliance status, threat level etc. Crafting an eye catching presentation has never been more straightforward. Let your presentation shine with this tasteful yet straightforward CYBER Security Breache Response Strategy Cyber Security Incident Response Kpi Dashboard Rules PDF template. It offers a minimalistic and classy look that is great for making a statement. The colors have been employed intelligently to add a bit of playfulness while still remaining professional. Construct the ideal CYBER Security Breache Response Strategy Cyber Security Incident Response Kpi Dashboard Rules PDF that effortlessly grabs the attention of your audience. Begin now and be certain to wow your customers.
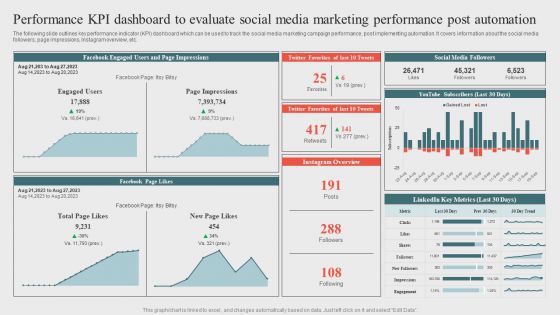
Performance Kpi Dashboard To Evaluate Social Mediaoptimizing Business Processes Through Automation Slides PDF
The following slide outlines key performance indicator KPI dashboard which can be used to track the social media marketing campaign performance, post implementing automation. It covers information about the social media followers, page impressions, Instagram overview, etc.Present like a pro with Performance Kpi Dashboard To Evaluate Social Mediaoptimizing Business Processes Through Automation Slides PDF Create beautiful presentations together with your team, using our easy to use presentation slides. Share your ideas in real time and make changes on the fly by downloading our templates. So whether you are in the office, on the go, or in a remote location, you can stay in sync with your team and present your ideas with confidence. With Slidegeeks presentation got a whole lot easier. Grab these presentations today.
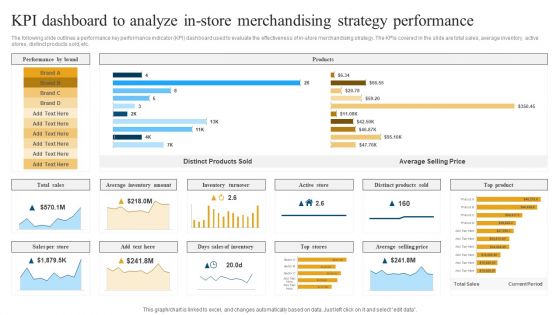
Retail Ecommerce Merchandising Tactics For Boosting Revenue KPI Dashboard To Analyze In Store Merchandising Rules PDF
The following slide outlines a performance key performance indicator KPI dashboard used to evaluate the effectiveness of in-store merchandising strategy. The KPIs covered in the slide are total sales, average inventory, active stores, distinct products sold, etc. Crafting an eye catching presentation has never been more straightforward. Let your presentation shine with this tasteful yet straightforward Retail Ecommerce Merchandising Tactics For Boosting Revenue KPI Dashboard To Analyze In Store Merchandising Rules PDF template. It offers a minimalistic and classy look that is great for making a statement. The colors have been employed intelligently to add a bit of playfulness while still remaining professional. Construct the ideal Retail Ecommerce Merchandising Tactics For Boosting Revenue KPI Dashboard To Analyze In Store Merchandising Rules PDF that effortlessly grabs the attention of your audience. Begin now and be certain to wow your customers.

Increasing Consumer Engagement With Database KPI Dashboard To Analyze Targeted Email Infographics PDF
The purpose of this slide is to highlight key performance indicator KPI dashboard which can be used by marketers to evaluate targeted email marketing campaign performance. The metrics are requests, opens, clicks, opens by country, opens vs clicks by month, etc. This modern and well arranged Increasing Consumer Engagement With Database KPI Dashboard To Analyze Targeted Email Infographics PDF provides lots of creative possibilities. It is very simple to customize and edit with the Powerpoint Software. Just drag and drop your pictures into the shapes. All facets of this template can be edited with Powerpoint no extra software is necessary. Add your own material, put your images in the places assigned for them, adjust the colors, and then you can show your slides to the world, with an animated slide included.

Cashless Payment Strategies To Enhance Business Performance Impact Of BNLP Payment Business Performance Mockup PDF
Mentioned slide demonstrates the impact of Buy Now Pay Later payment option adoption on business goals. It includes key performance indicators such as new customer engagement, market share, order level and conversion rate. Formulating a presentation can take up a lot of effort and time, so the content and message should always be the primary focus. The visuals of the PowerPoint can enhance the presenters message, so our Cashless Payment Strategies To Enhance Business Performance Impact Of BNLP Payment Business Performance Mockup PDF was created to help save time. Instead of worrying about the design, the presenter can concentrate on the message while our designers work on creating the ideal templates for whatever situation is needed. Slidegeeks has experts for everything from amazing designs to valuable content, we have put everything into Cashless Payment Strategies To Enhance Business Performance Impact Of BNLP Payment Business Performance Mockup PDF

Performance Dashboard To Measure Marketing Campaign Performance Brochure PDF
The following slide outlines key performance indicator KPI dashboard that can assist digital marketers to evaluate marketing campaign performance. The success metrics outlined in slide are total spend on advertisement, cost per thousand CPM, cost per click CPC, click-through rate CTR, etc. Want to ace your presentation in front of a live audience Our Performance Dashboard To Measure Marketing Campaign Performance Brochure PDF can help you do that by engaging all the users towards you.. Slidegeeks experts have put their efforts and expertise into creating these impeccable powerpoint presentations so that you can communicate your ideas clearly. Moreover, all the templates are customizable, and easy-to-edit and downloadable. Use these for both personal and commercial use.

Introduction To Mobile SEM KPI Metrics Dashboard To Monitor Mobile SEO Performance Diagrams PDF
The purpose of this slide is to outline key performance indicator KPI dashboard which will assist the marketer to analyze mobile search engine optimization SEO performance. The key metrics mentioned in the slide are total sessions, search engine rankings etc. Take your projects to the next level with our ultimate collection of Introduction To Mobile SEM KPI Metrics Dashboard To Monitor Mobile SEO Performance Diagrams PDF. Slidegeeks has designed a range of layouts that are perfect for representing task or activity duration, keeping track of all your deadlines at a glance. Tailor these designs to your exact needs and give them a truly corporate look with your own brand colors they will make your projects stand out from the rest.

Impact Of Customer Churn On Organization Performance Background PDF
Mentioned slide outlines the impact of a higher attrition rate on the companys financial performance. It contains information about major financial key performance indicators KPIs such as monthly recurring revenue MRR, customer lifetime value CLV, and customer acquisition cost CAC. Take your projects to the next level with our ultimate collection of Impact Of Customer Churn On Organization Performance Background PDF. Slidegeeks has designed a range of layouts that are perfect for representing task or activity duration, keeping track of all your deadlines at a glance. Tailor these designs to your exact needs and give them a truly corporate look with your own brand colors they will make your projects stand out from the rest.

Tactical Employee Engagement Action Planning Employee Engagement Satisfaction Kpi Dashboard Sample PDF
The following slide showcases employee engagement and satisfaction key performance indicators to encourage healthy team relationships. It includes key elements such as net promotor score, retention and absenteeism rate etc. Presenting this PowerPoint presentation, titled Tactical Employee Engagement Action Planning Employee Engagement Satisfaction Kpi Dashboard Sample PDF, with topics curated by our researchers after extensive research. This editable presentation is available for immediate download and provides attractive features when used. Download now and captivate your audience. Presenting this Tactical Employee Engagement Action Planning Employee Engagement Satisfaction Kpi Dashboard Sample PDF. Our researchers have carefully researched and created these slides with all aspects taken into consideration. This is a completely customizable Tactical Employee Engagement Action Planning Employee Engagement Satisfaction Kpi Dashboard Sample PDF that is available for immediate downloading. Download now and make an impact on your audience. Highlight the attractive features available with our PPTs.

Company Risk Assessment Plan Credit Risk Management KPI Dashboard Rules PDF
This slide covers the dashboard representing key performance indicators related to management of credit risks. It includes details related to regulatory parameters, exposure by credit rating etc. Do you have an important presentation coming up. Are you looking for something that will make your presentation stand out from the rest. Look no further than Company Risk Assessment Plan Credit Risk Management KPI Dashboard Rules PDF. With our professional designs, you can trust that your presentation will pop and make delivering it a smooth process. And with Slidegeeks, you can trust that your presentation will be unique and memorable. So why wait. GrabCompany Risk Assessment Plan Credit Risk Management KPI Dashboard Rules PDF today and make your presentation stand out from the rest.
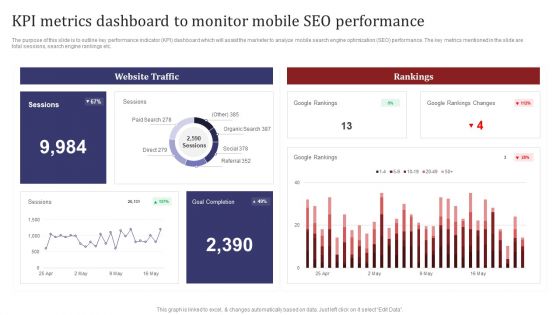
Mobile Search Engine Optimization Plan KPI Metrics Dashboard To Monitor Mobile SEO Performance Inspiration PDF
The purpose of this slide is to outline key performance indicator KPI dashboard which will assist the marketer to analyze mobile search engine optimization SEO performance. The key metrics mentioned in the slide are total sessions, search engine rankings etc. This Mobile Search Engine Optimization Plan KPI Metrics Dashboard To Monitor Mobile SEO Performance Inspiration PDF from Slidegeeks makes it easy to present information on your topic with precision. It provides customization options, so you can make changes to the colors, design, graphics, or any other component to create a unique layout. It is also available for immediate download, so you can begin using it right away. Slidegeeks has done good research to ensure that you have everything you need to make your presentation stand out. Make a name out there for a brilliant performance.

Market Research Assessment Of Target Market Requirements Brand Analytics Kpi Dashboard For Organization Clipart PDF
The following slide outlines key performance indicator KPI dashboard that can assist marketers to evaluate brand performance on social media channels. The metrics covered are age group, gender, brand perception, branding themes, celebrity analysis, etc. Do you have an important presentation coming up Are you looking for something that will make your presentation stand out from the rest Look no further than Market Research Assessment Of Target Market Requirements Brand Analytics Kpi Dashboard For Organization Clipart PDF. With our professional designs, you can trust that your presentation will pop and make delivering it a smooth process. And with Slidegeeks, you can trust that your presentation will be unique and memorable. So why wait Grab Market Research Assessment Of Target Market Requirements Brand Analytics Kpi Dashboard For Organization Clipart PDF today and make your presentation stand out from the rest.

Evaluating Impact Of Green Marketing With Kpi Dashboard Inspiration PDF
The following slide depicts dashboard to evaluate consequences of sustainable marketing on sales performance and plan future actions. It includes key performance indicators such as orders, net profit margin, sales by location, channel, packaging costs, sales price etc. This Evaluating Impact Of Green Marketing With Kpi Dashboard Inspiration PDF from Slidegeeks makes it easy to present information on your topic with precision. It provides customization options, so you can make changes to the colors, design, graphics, or any other component to create a unique layout. It is also available for immediate download, so you can begin using it right away. Slidegeeks has done good research to ensure that you have everything you need to make your presentation stand out. Make a name out there for a brilliant performance.
Cloud Performance Tracking Dashboard Managing Complexity Of Multiple Cloud Platforms Download PDF
This slide covers the key performance indicators for tracking performance of the cloud such as violations break down, sources, rules and severity.Presenting this PowerPoint presentation, titled Cloud Performance Tracking Dashboard Managing Complexity Of Multiple Cloud Platforms Download PDF, with topics curated by our researchers after extensive research. This editable presentation is available for immediate download and provides attractive features when used. Download now and captivate your audience. Presenting this Cloud Performance Tracking Dashboard Managing Complexity Of Multiple Cloud Platforms Download PDF. Our researchers have carefully researched and created these slides with all aspects taken into consideration. This is a completely customizable Cloud Performance Tracking Dashboard Managing Complexity Of Multiple Cloud Platforms Download PDF that is available for immediate downloading. Download now and make an impact on your audience. Highlight the attractive features available with our PPTs.

Ecommerce KPI Dashboard With Pand L Statement Download PDF
This slide showcases ecommerce key performance indicators KPI dashboard with financial statement. It provides information about total sales, orders, net profit, net profit margin, average order value, channels, etc. This Ecommerce KPI Dashboard With Pand L Statement Download PDF from Slidegeeks makes it easy to present information on your topic with precision. It provides customization options, so you can make changes to the colors, design, graphics, or any other component to create a unique layout. It is also available for immediate download, so you can begin using it right away. Slidegeeks has done good research to ensure that you have everything you need to make your presentation stand out. Make a name out there for a brilliant performance.

KPI Dashboard To Analyze Performance Of Healthcare Financial Department Summary PDF
The following slide showcases key performance indicator KPI dashboard which can be used to analyze the financial performance of hospital. The metrics covered in the slide are net profit margin, income and expenses, etc. Do you have an important presentation coming up Are you looking for something that will make your presentation stand out from the rest Look no further than KPI Dashboard To Analyze Performance Of Healthcare Financial Department Summary PDF. With our professional designs, you can trust that your presentation will pop and make delivering it a smooth process. And with Slidegeeks, you can trust that your presentation will be unique and memorable. So why wait Grab KPI Dashboard To Analyze Performance Of Healthcare Financial Department Summary PDF today and make your presentation stand out from the rest.
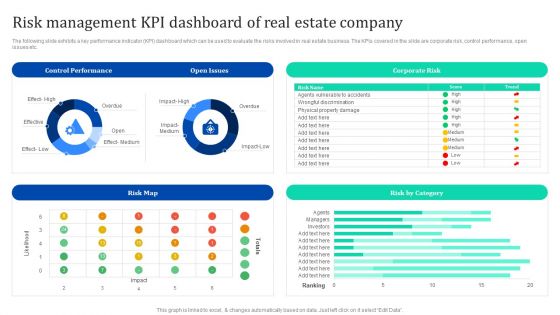
Risk Management Kpi Dashboard Of Real Estate Company Enhancing Process Improvement By Regularly Inspiration PDF
The following slide exhibits a key performance indicator KPI dashboard which can be used to evaluate the risks involved in real estate business. The KPIs covered in the slide are corporate risk, control performance, open issues etc. This Risk Management Kpi Dashboard Of Real Estate Company Enhancing Process Improvement By Regularly Inspiration PDF from Slidegeeks makes it easy to present information on your topic with precision. It provides customization options, so you can make changes to the colors, design, graphics, or any other component to create a unique layout. It is also available for immediate download, so you can begin using it right away. Slidegeeks has done good research to ensure that you have everything you need to make your presentation stand out. Make a name out there for a brilliant performance.
Strategies To Maintain Transportation Shipping And Logistics Tracking Dashboard With Shipments Ppt Infographics Information PDF
This slide covers Key performance indicators to track the automation system of the company. This dashboard includes Logistics Efficiency Status, delivery time accuracy etc. Presenting this PowerPoint presentation, titled Strategies To Maintain Transportation Shipping And Logistics Tracking Dashboard With Shipments Ppt Infographics Information PDF, with topics curated by our researchers after extensive research. This editable presentation is available for immediate download and provides attractive features when used. Download now and captivate your audience. Presenting this Strategies To Maintain Transportation Shipping And Logistics Tracking Dashboard With Shipments Ppt Infographics Information PDF. Our researchers have carefully researched and created these slides with all aspects taken into consideration. This is a completely customizable Strategies To Maintain Transportation Shipping And Logistics Tracking Dashboard With Shipments Ppt Infographics Information PDF that is available for immediate downloading. Download now and make an impact on your audience. Highlight the attractive features available with our PPTs.
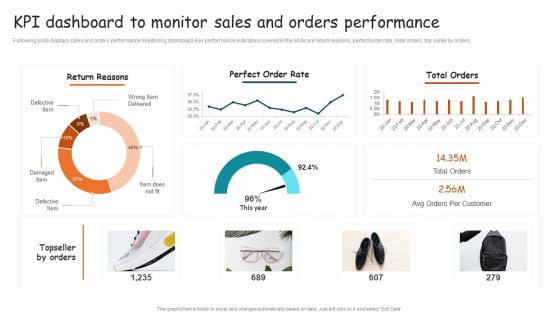
Guide For Brand Kpi Dashboard To Monitor Sales And Orders Performance Brochure PDF
Following slide displays sales and orders performance monitoring dashboard. Key performance indicators covered in the slide are return reasons, perfect order rate, total orders, top seller by orders. Do you have an important presentation coming up Are you looking for something that will make your presentation stand out from the rest Look no further than Guide For Brand Kpi Dashboard To Monitor Sales And Orders Performance Brochure PDF. With our professional designs, you can trust that your presentation will pop and make delivering it a smooth process. And with Slidegeeks, you can trust that your presentation will be unique and memorable. So why wait Grab Guide For Brand Kpi Dashboard To Monitor Sales And Orders Performance Brochure PDF today and make your presentation stand out from the rest.

Kpi Dashboard For Monitoring Warehouse Operations Stand Out Digital Supply Chain Tactics Enhancing Information PDF
Mentioned slide illustrates warehouse operations dashboard with key performance indicators KPIs. KPIs included are operating cost, order rate, total shipment by country and on-time shipment.Presenting this PowerPoint presentation, titled Kpi Dashboard For Monitoring Warehouse Operations Stand Out Digital Supply Chain Tactics Enhancing Information PDF, with topics curated by our researchers after extensive research. This editable presentation is available for immediate download and provides attractive features when used. Download now and captivate your audience. Presenting this Kpi Dashboard For Monitoring Warehouse Operations Stand Out Digital Supply Chain Tactics Enhancing Information PDF. Our researchers have carefully researched and created these slides with all aspects taken into consideration. This is a completely customizable Kpi Dashboard For Monitoring Warehouse Operations Stand Out Digital Supply Chain Tactics Enhancing Information PDF that is available for immediate downloading. Download now and make an impact on your audience. Highlight the attractive features available with our PPTs.
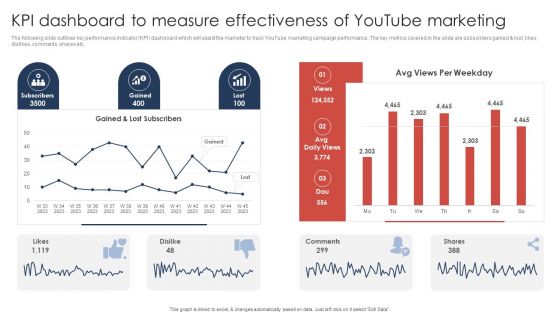
Kpi Dashboard To Measure Effectiveness Of Youtube Marketing Slides PDF
The following slide outlines key performance indicator KPI dashboard which will assist the marketer to track YouTube marketing campaign performance. The key metrics covered in the slide are subscribers gained and lost, likes, dislikes, comments, shares etc. Do you have an important presentation coming up Are you looking for something that will make your presentation stand out from the rest Look no further than Kpi Dashboard To Measure Effectiveness Of Youtube Marketing Slides PDF. With our professional designs, you can trust that your presentation will pop and make delivering it a smooth process. And with Slidegeeks, you can trust that your presentation will be unique and memorable. So why wait Grab Kpi Dashboard To Measure Effectiveness Of Youtube Marketing Slides PDF today and make your presentation stand out from the rest.

Retail Business Optimization Through Operational Excellence Strategy Determining Back Order Rate Slides PDF
Following slide illustrates information stats about back order rate and rate of return in the year 2020. Here the graph indicates that back order rate get exceeded to 4.8 percent from the target value in 2020. Do you have an important presentation coming up Are you looking for something that will make your presentation stand out from the rest Look no further than Retail Business Optimization Through Operational Excellence Strategy Determining Back Order Rate Slides PDF. With our professional designs, you can trust that your presentation will pop and make delivering it a smooth process. And with Slidegeeks, you can trust that your presentation will be unique and memorable. So why wait Grab Retail Business Optimization Through Operational Excellence Strategy Determining Back Order Rate Slides PDF today and make your presentation stand out from the rest.
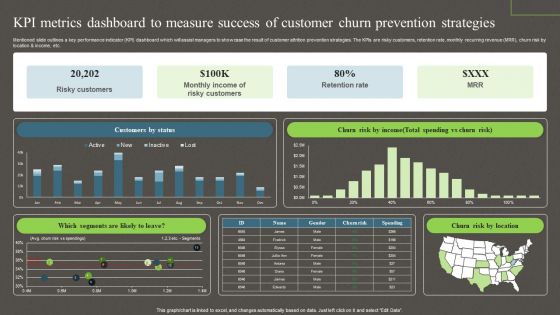
Kpi Metrics Dashboard To Measure Success Of Customer Churn Prevention Strategies Ppt PowerPoint Presentation File Model PDF
Mentioned slide outlines a key performance indicator KPI dashboard which will assist managers to showcase the result of customer attrition prevention strategies. The KPIs are risky customers, retention rate, monthly recurring revenue MRR, churn risk by location and income, etc. This Kpi Metrics Dashboard To Measure Success Of Customer Churn Prevention Strategies Ppt PowerPoint Presentation File Model PDF from Slidegeeks makes it easy to present information on your topic with precision. It provides customization options, so you can make changes to the colors, design, graphics, or any other component to create a unique layout. It is also available for immediate download, so you can begin using it right away. Slidegeeks has done good research to ensure that you have everything you need to make your presentation stand out. Make a name out there for a brilliant performance.

Definitive Guide To Conduct Digital Marketing Inspection Dashboard To Assess Social Posts Content Quality Summary PDF
This slide indicates the Dashboard to Assess Social Posts Content Quality. It provides information regarding the top published articles, story turnaround time, average number of comments per article and digital subscribers gained. Take your projects to the next level with our ultimate collection of Definitive Guide To Conduct Digital Marketing Inspection Dashboard To Assess Social Posts Content Quality Summary PDF. Slidegeeks has designed a range of layouts that are perfect for representing task or activity duration, keeping track of all your deadlines at a glance. Tailor these designs to your exact needs and give them a truly corporate look with your own brand colors they will make your projects stand out from the rest.

Retail Business Operation Management To Optimize Customer Experience Determining Back Order Rate Rules PDF
Following slide illustrates information stats about back order rate and rate of return in the year 2023. Here the graph indicates that back order rate get exceeded to 4.8percent from the target value in 2023. Do you have an important presentation coming up Are you looking for something that will make your presentation stand out from the rest Look no further than Retail Business Operation Management To Optimize Customer Experience Determining Back Order Rate Rules PDF. With our professional designs, you can trust that your presentation will pop and make delivering it a smooth process. And with Slidegeeks, you can trust that your presentation will be unique and memorable. So why wait Grab Retail Business Operation Management To Optimize Customer Experience Determining Back Order Rate Rules PDF today and make your presentation stand out from the rest.
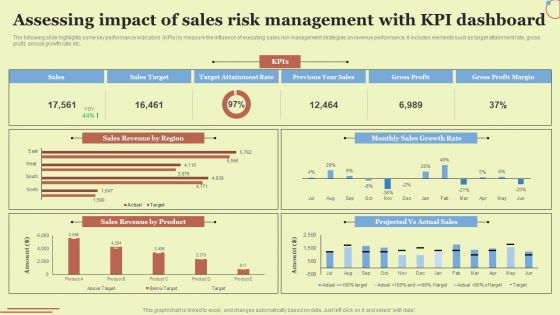
Assessing Impact Of Sales Risk Management With KPI Dashboard Ideas PDF
The following slide highlights some key performance indicators KPIs to measure the influence of executing sales risk management strategies on revenue performance. It includes elements such as target attainment rate, gross profit, annual growth rate etc. Presenting this PowerPoint presentation, titled Assessing Impact Of Sales Risk Management With KPI Dashboard Ideas PDF, with topics curated by our researchers after extensive research. This editable presentation is available for immediate download and provides attractive features when used. Download now and captivate your audience. Presenting this Assessing Impact Of Sales Risk Management With KPI Dashboard Ideas PDF. Our researchers have carefully researched and created these slides with all aspects taken into consideration. This is a completely customizable Assessing Impact Of Sales Risk Management With KPI Dashboard Ideas PDF that is available for immediate downloading. Download now and make an impact on your audience. Highlight the attractive features available with our PPTs.

Ecommerce Photo Editing Services Fundraising Deck Financial Performance Demonstration PDF
The following slide outlines the yearly revenue of our company. The graphical representation covers information about annual sales from 2019-2022 that indicates upward growth. This Ecommerce Photo Editing Services Fundraising Deck Financial Performance Demonstration PDF from Slidegeeks makes it easy to present information on your topic with precision. It provides customization options, so you can make changes to the colors, design, graphics, or any other component to create a unique layout. It is also available for immediate download, so you can begin using it right away. Slidegeeks has done good research to ensure that you have everything you need to make your presentation stand out. Make a name out there for a brilliant performance.
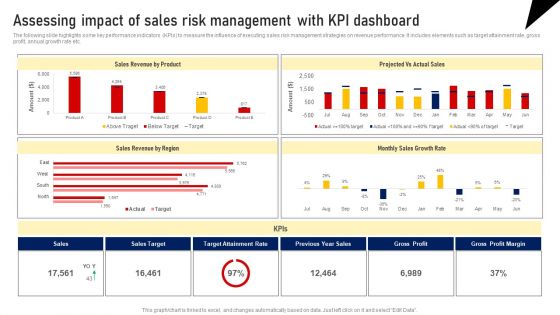
Assessing Impact Of Sales Risk Management With Kpi Dashboard Formats PDF
The following slide highlights some key performance indicators KPIs to measure the influence of executing sales risk management strategies on revenue performance. It includes elements such as target attainment rate, gross profit, annual growth rate etc. Presenting this PowerPoint presentation, titled Assessing Impact Of Sales Risk Management With Kpi Dashboard Formats PDF, with topics curated by our researchers after extensive research. This editable presentation is available for immediate download and provides attractive features when used. Download now and captivate your audience. Presenting this Assessing Impact Of Sales Risk Management With Kpi Dashboard Formats PDF. Our researchers have carefully researched and created these slides with all aspects taken into consideration. This is a completely customizable Assessing Impact Of Sales Risk Management With Kpi Dashboard Formats PDF that is available for immediate downloading. Download now and make an impact on your audience. Highlight the attractive features available with our PPTs.
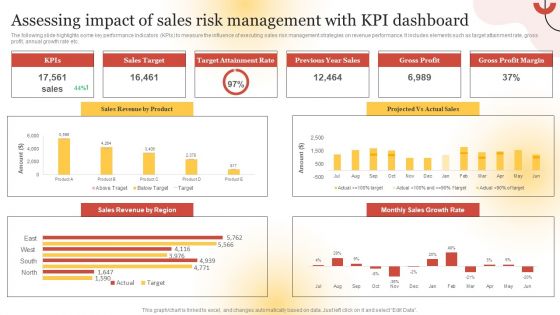
Assessing Impact Of Sales Risk Management With KPI Dashboard Guidelines PDF
The following slide highlights some key performance indicators KPIs to measure the influence of executing sales risk management strategies on revenue performance. It includes elements such as target attainment rate, gross profit, annual growth rate etc. Presenting this PowerPoint presentation, titled Assessing Impact Of Sales Risk Management With KPI Dashboard Guidelines PDF, with topics curated by our researchers after extensive research. This editable presentation is available for immediate download and provides attractive features when used. Download now and captivate your audience. Presenting this Assessing Impact Of Sales Risk Management With KPI Dashboard Guidelines PDF. Our researchers have carefully researched and created these slides with all aspects taken into consideration. This is a completely customizable Assessing Impact Of Sales Risk Management With KPI Dashboard Guidelines PDF that is available for immediate downloading. Download now and make an impact on your audience. Highlight the attractive features available with our PPTs.
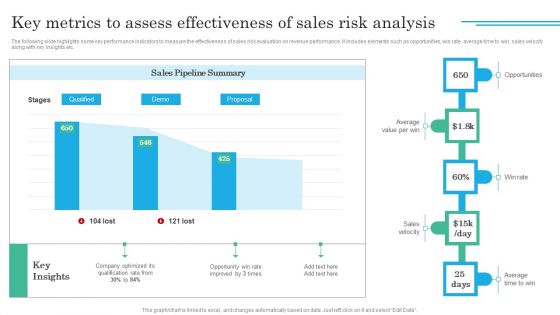
Implementing Sales Volatility Management Techniques Key Metrics To Assess Effectiveness Of Sales Designs PDF
The following slide highlights some key performance indicators to measure the effectiveness of sales risk evaluation on revenue performance. It includes elements such as opportunities, win rate, average time to win, sales velocity along with key insights etc. Do you have an important presentation coming up Are you looking for something that will make your presentation stand out from the rest Look no further than Implementing Sales Volatility Management Techniques Key Metrics To Assess Effectiveness Of Sales Designs PDF. With our professional designs, you can trust that your presentation will pop and make delivering it a smooth process. And with Slidegeeks, you can trust that your presentation will be unique and memorable. So why wait Grab Implementing Sales Volatility Management Techniques Key Metrics To Assess Effectiveness Of Sales Designs PDF today and make your presentation stand out from the rest.

Determining Risks In Sales Administration Procedure Key Metrics To Assess Effectiveness Of Sales Pictures PDF
The following slide highlights some key performance indicators to measure the effectiveness of sales risk evaluation on revenue performance. It includes elements such as opportunities, win rate, average time to win, sales velocity along with key insights etc. This Determining Risks In Sales Administration Procedure Key Metrics To Assess Effectiveness Of Sales Pictures PDF from Slidegeeks makes it easy to present information on your topic with precision. It provides customization options, so you can make changes to the colors, design, graphics, or any other component to create a unique layout. It is also available for immediate download, so you can begin using it right away. Slidegeeks has done good research to ensure that you have everything you need to make your presentation stand out. Make a name out there for a brilliant performance.

Dashboard To Analyze Flexible Working Strategies Impact On Employees Performance Infographics PDF
The following slide delineates a key performance indicator KPI dashboard through which managers can evaluate the success of a flexible working policy on workforce performance. The major KPIs are absenteeism rate, overall labor effectiveness etc. Presenting this PowerPoint presentation, titled Dashboard To Analyze Flexible Working Strategies Impact On Employees Performance Infographics PDF, with topics curated by our researchers after extensive research. This editable presentation is available for immediate download and provides attractive features when used. Download now and captivate your audience. Presenting this Dashboard To Analyze Flexible Working Strategies Impact On Employees Performance Infographics PDF. Our researchers have carefully researched and created these slides with all aspects taken into consideration. This is a completely customizable Dashboard To Analyze Flexible Working Strategies Impact On Employees Performance Infographics PDF that is available for immediate downloading. Download now and make an impact on your audience. Highlight the attractive features available with our PPTs.

Guide To Healthcare Services Administration KPI Metrics Dashboard To Measure Effectiveness Healthcare Information PDF
The following slide showcases key performance indicator KPI metrics dashboard which can be used to evaluate the success rate of healthcare recruitment. It covers information about technical and non-technical hiring, recruitment costs, current hiring pipeline etc. This Guide To Healthcare Services Administration KPI Metrics Dashboard To Measure Effectiveness Healthcare Information PDF from Slidegeeks makes it easy to present information on your topic with precision. It provides customization options, so you can make changes to the colors, design, graphics, or any other component to create a unique layout. It is also available for immediate download, so you can begin using it right away. Slidegeeks has done good research to ensure that you have everything you need to make your presentation stand out. Make a name out there for a brilliant performance.

Implementing Cyber Security Incident Enterprise Cyber Risk Dashboard Professional PDF
This slide represents the key metrics dashboard representing details related to management of cyber security incidents by an enterprise. It includes key performance indicators such as risk analysis progress, risk rating breakdown etc. Do you have an important presentation coming up Are you looking for something that will make your presentation stand out from the rest Look no further than Implementing Cyber Security Incident Enterprise Cyber Risk Dashboard Professional PDF. With our professional designs, you can trust that your presentation will pop and make delivering it a smooth process. And with Slidegeeks, you can trust that your presentation will be unique and memorable. So why wait Grab Implementing Cyber Security Incident Enterprise Cyber Risk Dashboard Professional PDF today and make your presentation stand out from the rest.

Arrow Diagram Indicate The Tasks Circular Flow Layout Process PowerPoint Slides
We present our arrow diagram indicate the tasks Circular Flow Layout Process PowerPoint Slides.Download and present our Business PowerPoint Templates because your thoughts are pointed and sharp as arrows. Present our Ring Charts PowerPoint Templates because it Draws the universal impact to highlight the similarities with your organizational structure and plans. Download our Marketing PowerPoint Templates because networking is an imperative in todays world. You need to access the views of others. Similarly you need to give access to them of your abilities. Use our Shapes PowerPoint Templates because different people with differing ideas and priorities perform together to score. Download our Process and Flows PowerPoint Templates because you have a great plan to put the pieces together, getting all the various contributors to gel for a successful completion.Use these PowerPoint slides for presentations relating to Arrows, choice, connect, design, direction, flows, four, info graph, instruction, layout, manual, marketing, modern, one, option, order, page, paper, pointing, process, product, promotion, sequence, simple, special, step, symbol. The prominent colors used in the PowerPoint template are Purple, Blue, Black. Presenters tell us our arrow diagram indicate the tasks Circular Flow Layout Process PowerPoint Slides are Majestic. Professionals tell us our info PowerPoint templates and PPT Slides are Breathtaking. PowerPoint presentation experts tell us our arrow diagram indicate the tasks Circular Flow Layout Process PowerPoint Slides are Clever. The feedback we get is that our info PowerPoint templates and PPT Slides are Nifty. Use our arrow diagram indicate the tasks Circular Flow Layout Process PowerPoint Slides are One-of-a-kind. Use our four PowerPoint templates and PPT Slides are readymade to fit into any presentation structure.
Arrow Diagram Indicate The Tasks Circle Circular Flow Layout Process PowerPoint Slides
We present our arrow diagram indicate the tasks circle Circular Flow Layout Process PowerPoint Slides.Download our Business PowerPoint Templates because this diagram helps you to show goal also clearly etched in your mind. Use our Ring Charts PowerPoint Templates because you have the ideas to develop the teams vision of where they need to be in the future. Download our Marketing PowerPoint Templates because networking is an imperative in todays world. You need to access the views of others. Similarly you need to give access to them of your abilities. Download and present our Shapes PowerPoint Templates because this slide shows each path to the smallest detail. Download our Process and Flows PowerPoint Templates because this Layout helps you to expand your plans to overcome obstacles and reassure the team that they shall continue to roll along merrily.Use these PowerPoint slides for presentations relating to Arrows, choice, connect, design, direction, flows, four, info graph, instruction, layout, manual, marketing, modern, one, option, order, page, paper, pointing, process, product, promotion, sequence, simple, special, step, symbol. The prominent colors used in the PowerPoint template are Pink, Blue, White. Presenters tell us our arrow diagram indicate the tasks circle Circular Flow Layout Process PowerPoint Slides will help you be quick off the draw. Just enter your specific text and see your points hit home. Professionals tell us our info PowerPoint templates and PPT Slides provide you with a vast range of viable options. Select the appropriate ones and just fill in your text. PowerPoint presentation experts tell us our arrow diagram indicate the tasks circle Circular Flow Layout Process PowerPoint Slides are Dazzling. The feedback we get is that our connect PowerPoint templates and PPT Slides will make you look like a winner. Use our arrow diagram indicate the tasks circle Circular Flow Layout Process PowerPoint Slides are Detailed. Use our four PowerPoint templates and PPT Slides are Spectacular.

Key Performance Indicator Tree Indicating Fixed And Variable Costs Diagrams PDF
Persuade your audience using this key performance indicator tree indicating fixed and variable costs diagrams pdf. This PPT design covers four stages, thus making it a great tool to use. It also caters to a variety of topics including costs, revenue, profit. Download this PPT design now to present a convincing pitch that not only emphasizes the topic but also showcases your presentation skills.

Business Framework Loading Bar Progress Indicator PowerPoint Presentation
This business diagram displays bar progress indicators. This business slide contains the concept of business growth shown in multiple levels. Use this diagram to present and compare data in an impressive manner.

Key Performance Indicator Tree Illustrating Online Application Revenue Download PDF
Presenting key performance indicator tree illustrating online application revenue download pdf to dispense important information. This template comprises three stages. It also presents valuable insights into the topics including daily conversion, returning users, daily revenue. This is a completely customizable PowerPoint theme that can be put to use immediately. So, download it and address the topic impactfully.

Key Performance Indicator Tree Depicting Project Fault Repair Diagrams PDF
Presenting key performance indicator tree depicting project fault repair diagrams pdf to dispense important information. This template comprises three stages. It also presents valuable insights into the topics including customer interaction, managing the business, fixing the fault. This is a completely customizable PowerPoint theme that can be put to use immediately. So, download it and address the topic impactfully.
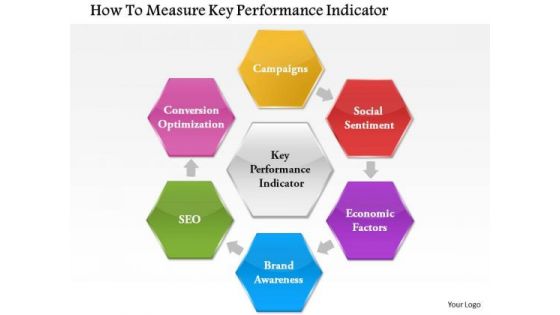
Business Framework How To Measure Key Performance Indicator PowerPoint Presentation
This Power Point diagram slide has been crafted with graphic of flower petal diagram. This PPT slide contains the concept of measuring the key performance and indicate it. Use this PPT slide for your management related presentation.
Project Key Performance Indicator Tree Illustrating Customer Satisfaction Icons PDF
Persuade your audience using this project key performance indicator tree illustrating customer satisfaction icons pdf. This PPT design covers four stages, thus making it a great tool to use. It also caters to a variety of topics including total customer complaints, total customer notifications, customer satisfaction project. Download this PPT design now to present a convincing pitch that not only emphasizes the topic but also showcases your presentation skills.
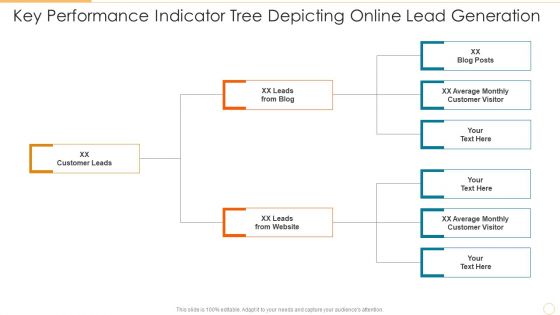
Key Performance Indicator Tree Depicting Online Lead Generation Information PDF
Persuade your audience using this key performance indicator tree depicting online lead generation information pdf. This PPT design covers three stages, thus making it a great tool to use. It also caters to a variety of topics including customer leads, leads from blog, leads from website. Download this PPT design now to present a convincing pitch that not only emphasizes the topic but also showcases your presentation skills.
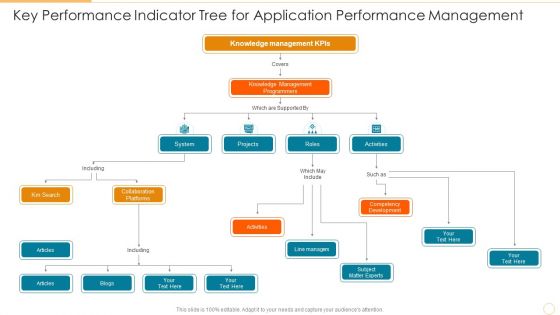
Key Performance Indicator Tree For Application Performance Management Background PDF
Persuade your audience using this key performance indicator tree for application performance management background pdf. This PPT design covers six stages, thus making it a great tool to use. It also caters to a variety of topics including collaboration platforms, competency development, knowledge management programmers. Download this PPT design now to present a convincing pitch that not only emphasizes the topic but also showcases your presentation skills.

Flowchart Indicating Monitoring Financial Transactions Process In Banks Pictures PDF
This slide depicts transaction monitoring stages in AML anti money laundering It provides information about source, analysis, insight, action, report, analyzing, financial transaction, etc.Persuade your audience using this Flowchart Indicating Monitoring Financial Transactions Process In Banks Pictures PDF. This PPT design covers one stage, thus making it a great tool to use. It also caters to a variety of topics including Payment Matching Process, Cancelled Payment, Cancelled Payment. Download this PPT design now to present a convincing pitch that not only emphasizes the topic but also showcases your presentation skills.
Templates Download Statistics Business Plan For Small PowerPoint Slides
We present our templates download statistics business plan for small PowerPoint Slides.Download our Process and Flows PowerPoint Templates because Our PowerPoint Templates and Slides will give you great value for your money. Be assured of finding the best projection to highlight your words. Present our Circle Charts PowerPoint Templates because You should Press the right buttons with our PowerPoint Templates and Slides. They will take your ideas down the perfect channel. Download our Shapes PowerPoint Templates because It will get your audience in sync. Download our Business PowerPoint Templates because You will get more than you ever bargained for. Download and present our Marketing PowerPoint Templates because Our PowerPoint Templates and Slides are focused like a searchlight beam. They highlight your ideas for your target audience.Use these PowerPoint slides for presentations relating to Infographic, graph, chart, data, icon, diagram, progress, bar, line, download, button, pie, search, time, statistics, percent, segment, cloud, business, concept, sign,loading, symbol, template, circle, graphic, full, element, report, level, black, shape, computer, modern, status, visualization, round, section, web,design, statistics, growth, colorful, info, stats, information, indicator. The prominent colors used in the PowerPoint template are Green, Gray, Black.

Stages Circularly Placed Forming Process Flow Diagram PowerPoint Slides
We present our stages circularly placed forming process Flow Diagram PowerPoint Slides.Download our Arrows PowerPoint Templates because they are the indicators of the path you have in mind. Download and present our Process and Flows PowerPoint Templates because this template helps you to bring your audiences to the table. Download and present our Business PowerPoint Templates because your ideas too are pinpointedly focused on you goals. Present our Shapes PowerPoint Templates because this is An innovative slide design depicting driving home the relevance of a steady rhythm. Use our Circle Charts PowerPoint Templates because it Creates a winner with your passion and dream.Use these PowerPoint slides for presentations relating to Arrow, Business, Chart, Circle, Design, Diagram, Direction, Document, Market, Marketing, Multiple, Navigation, Network, Options, Plan, Presentation, Process, Results, Shiny, Sphere, Statistics, Structure, Template, Three, Vector, Website, Wheel. The prominent colors used in the PowerPoint template are Blue light, White, Gray. People tell us our stages circularly placed forming process Flow Diagram PowerPoint Slides are Striking. People tell us our Diagram PowerPoint templates and PPT Slides are Pretty. The feedback we get is that our stages circularly placed forming process Flow Diagram PowerPoint Slides are Ritzy. Presenters tell us our Design PowerPoint templates and PPT Slides are Fabulous. Customers tell us our stages circularly placed forming process Flow Diagram PowerPoint Slides are designed by professionals The feedback we get is that our Document PowerPoint templates and PPT Slides are Reminiscent.
Ppt Background 3d Illustration Of 5 Phase Diagram Partnership Transaction 6 Image
We present our PPT Background 3d illustration of 5 phase diagram partnership transaction 6 Image. Use our Arrows PowerPoint Templates because, It is a step by step process with levels rising at every stage. Use our Circle Charts PowerPoint Templates because, You have it all down to a T. Use our Shapes PowerPoint Templates because, Illustrate your ideas and imprint them in the minds of your team with this template. Use our Business PowerPoint Templates because; Break it all down to Key Result Areas. Use our Process and Flows PowerPoint Templates because, they are indicators of the path you have in mind. Use these PowerPoint slides for presentations relating to background, blog, business, chain, communication, connection, constructive, contact, design, diagonal, dialog, digital, flow, global, interaction, internet, line, linear, network, partner, pointer, reaction, social, stream, structure, system, team,. The prominent colors used in the PowerPoint template are Pink, Gray, and Black

Key Performance Indicator Profit Tree With Revenues And Costs Template PDF
Presenting key performance indicator profit tree with revenues and costs template pdf to dispense important information. This template comprises three stages. It also presents valuable insights into the topics including costs, profit, revenue. This is a completely customizable PowerPoint theme that can be put to use immediately. So, download it and address the topic impactfully.

Organizational Key Performance Indicator Tree Depicting Market And Company Revenue Graphics PDF
Presenting organizational key performance indicator tree depicting market and company revenue graphics pdf to dispense important information. This template comprises three stages. It also presents valuable insights into the topics including total market revenue, company revenue, increase market share. This is a completely customizable PowerPoint theme that can be put to use immediately. So, download it and address the topic impactfully.

3d Arrow Dilemma Of Puzzle Process 7 Stages Preparing Business Plan PowerPoint Slides
We present our 3d arrow dilemma of puzzle process 7 stages preparing business plan PowerPoint Slides.Use our Symbol PowerPoint Templates because you can Educate your listeners on the means to keep it ticking over. Download and present our Flow charts PowerPoint Templates because they are the indicators of the path you have in mind. Present our Arrows PowerPoint Templates because your brain is always churning out ideas like cogs in a wheel. Download our Puzzles or Jigsaws PowerPoint Templates because it gives you really bright ideas. Use our Business PowerPoint Templates because a brainwave has occurred to you after review. You know just how to push the graph skyward.Use these PowerPoint slides for presentations relating to 3d, Puzzle, Process, Arrow, Arrows, Block, Business, Chart, Design, Development, Diagram, Direction, Element, Flow, Flowchart, Graph, Linear, Management, Organization, Process, Program, Section, Sign, Solution, Symbol. The prominent colors used in the PowerPoint template are Yellow, Gray, Black. Professionals tell us our 3d arrow dilemma of puzzle process 7 stages preparing business plan PowerPoint Slides are Reminiscent. We assure you our Design PowerPoint templates and PPT Slides are Fancy. People tell us our 3d arrow dilemma of puzzle process 7 stages preparing business plan PowerPoint Slides are effectively colour coded to prioritise your plans They automatically highlight the sequence of events you desire. Customers tell us our Block PowerPoint templates and PPT Slides are Classic. Use our 3d arrow dilemma of puzzle process 7 stages preparing business plan PowerPoint Slides are One-of-a-kind. We assure you our Block PowerPoint templates and PPT Slides are Majestic.
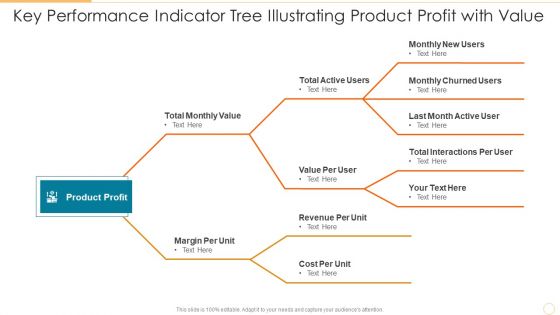
Key Performance Indicator Tree Illustrating Product Profit With Value Brochure PDF
Persuade your audience using this key performance indicator tree illustrating product profit with value brochure pdf. This PPT design covers three stages, thus making it a great tool to use. It also caters to a variety of topics including value per user, revenue per unit, cost per unit. Download this PPT design now to present a convincing pitch that not only emphasizes the topic but also showcases your presentation skills.

Mixed Scheme Business Process Diagram Creating Plan Step By PowerPoint Templates
We present our mixed scheme business process diagram creating plan step by PowerPoint templates.Download our Process and Flows PowerPoint Templates because Our PowerPoint Templates and Slides will give good value for money. They also have respect for the value of your time. Use our Flow Charts PowerPoint Templates because Our PowerPoint Templates and Slides will help you be quick off the draw. Just enter your specific text and see your points hit home. Download and present our Shapes PowerPoint Templates because Our PowerPoint Templates and Slides will generate and maintain the level of interest you desire. They will create the impression you want to imprint on your audience. Use our Business PowerPoint Templates because Our PowerPoint Templates and Slides will help you be quick off the draw. Just enter your specific text and see your points hit home. Use our Marketing PowerPoint Templates because These PowerPoint Templates and Slides will give the updraft to your ideas. See them soar to great heights with ease.Use these PowerPoint slides for presentations relating to Flow, process, schema, loop, turn, step, business, concept, vector, life, success, spectrum, rotation, recycling, diagram, circle, ring, graphic, propeller,pointer, idea, development, management, wheel, cycle, circulation, illustration, circular, system, strategy, round, research, range, iterative, center, direction, spiral,lifecycle, motion, method, quality, control, act, movement, blender, nature, mix, indicator. The prominent colors used in the PowerPoint template are Black, Yellow, Green.

Circular Mixed Process Marketing Plans Ppt Laundromat Business PowerPoint Templates
We present our circular mixed process marketing plans ppt laundromat business PowerPoint templates.Download our Process and Flows PowerPoint Templates because our PowerPoint Templates and Slides will give your ideas the shape. Use our Flow Charts PowerPoint Templates because Our PowerPoint Templates and Slides are effectively colour coded to prioritise your plans They automatically highlight the sequence of events you desire. Download and present our Business PowerPoint Templates because It will get your audience in sync. Present our Marketing PowerPoint Templates because Our PowerPoint Templates and Slides will generate and maintain the level of interest you desire. They will create the impression you want to imprint on your audience. Use our Shapes PowerPoint Templates because you should once Tap the ingenuity of our PowerPoint Templates and Slides. They are programmed to succeed.Use these PowerPoint slides for presentations relating to Flow, process, step, business, concept, vector, success, diagram, circle, graphic, idea, development, management, illustration, circular, system, strategy, round, research, center, direction, method, quality, mix, indicator. The prominent colors used in the PowerPoint template are Red, Gray, White.

Mixed Process Marketing Plans Ppt Business Template Free PowerPoint Slides
We present our mixed process marketing plans ppt business template free PowerPoint Slides.Download our Process and Flows PowerPoint Templates because Our PowerPoint Templates and Slides will let you Leave a lasting impression to your audiences. They possess an inherent longstanding recall factor. Download our Flow Charts PowerPoint Templates because You have the co-ordinates for your destination of success. Let our PowerPoint Templates and Slides map out your journey. Present our Business PowerPoint Templates because our PowerPoint Templates and Slides are the string of your bow. Fire of your ideas and conquer the podium. Download and present our Marketing PowerPoint Templates because Our PowerPoint Templates and Slides are innately eco-friendly. Their high recall value negate the need for paper handouts. Use our Shapes PowerPoint Templates because Our PowerPoint Templates and Slides are designed to help you succeed. They have all the ingredients you need.Use these PowerPoint slides for presentations relating to Flow, process, step, business, concept, vector, success, diagram, circle, graphic, idea, development, management, illustration, circular, system, strategy, round, research, center, direction, method, quality, mix, indicator. The prominent colors used in the PowerPoint template are Blue, Gray, White.
Circular Mixed Process Marketing Plans Ppt Business Software Download PowerPoint Templates
We present our circular mixed process marketing plans ppt business software download PowerPoint templates.Present our Process and Flows PowerPoint Templates because Our PowerPoint Templates and Slides ensures Effective communication. They help you put across your views with precision and clarity. Use our Flow Charts PowerPoint Templates because you can Break through with our PowerPoint Templates and Slides. Bring down the mental barriers of your audience. Download our Business PowerPoint Templates because Our PowerPoint Templates and Slides will let you meet your Deadlines. Present our Marketing PowerPoint Templates because They will bring a lot to the table. Their alluring flavours will make your audience salivate. Download our Shapes PowerPoint Templates because Our PowerPoint Templates and Slides will let you Hit the target. Go the full distance with ease and elan.Use these PowerPoint slides for presentations relating to Flow, process, step, business, concept, vector, success, diagram, circle, graphic, idea, development, management, illustration, circular, system, strategy, round, research, center, direction, method, quality, mix, indicator. The prominent colors used in the PowerPoint template are Yellow, Gray, White.
Process Marketing Plans Ppt How To Start Business Writing PowerPoint Templates
We present our process marketing plans ppt how to start business writing PowerPoint templates.Use our Process and Flows PowerPoint Templates because It can Bubble and burst with your ideas. Present our Flow Charts PowerPoint Templates because Our PowerPoint Templates and Slides will fulfill your every need. Use them and effectively satisfy the desires of your audience. Present our Business PowerPoint Templates because Our PowerPoint Templates and Slides will let you Leave a lasting impression to your audiences. They possess an inherent longstanding recall factor. Present our Marketing PowerPoint Templates because It will Strengthen your hand with your thoughts. They have all the aces you need to win the day. Present our Shapes PowerPoint Templates because You can Hit the nail on the head with our PowerPoint Templates and Slides. Embed your ideas in the minds of your audience.Use these PowerPoint slides for presentations relating to Flow, process, step, business, concept, vector, success, diagram, circle, graphic, idea, development, management, illustration, circular, system, strategy, round, research, center, direction, method, quality, mix, indicator. The prominent colors used in the PowerPoint template are Green, Gray, White.

11 Diverging Arrows Multilple Concepts Diagram Circular Network PowerPoint Slides
We present our 11 diverging arrows multilple concepts diagram Circular Network PowerPoint Slides.Download and present our Signs PowerPoint Templates because our template will help pinpoint their viability. Download and present our Future PowerPoint Templates because the Venn graphic comprising interlinking circles geometrically demonstate how various functions operating independantly, to a large extent, are essentially interdependant. Download our Ring Charts PowerPoint Templates because they are Designed to attract the attention of your audience. Download our Business PowerPoint Templates because you are sure you have the right people for your plans. Download and present our Marketing PowerPoint Templates because customer satisfaction is a mantra of the marketplace. Building a loyal client base is an essential element of your business.Use these PowerPoint slides for presentations relating to Direction, flow, gradient, green,illustration, indicator, isolated, link, loop,mix, motion, movement, multicolored,orange, paint, pattern, pointer, purple,rainbow, range, recycling, rob, ring, rotation, round, sign, six, spectrum, spin, symbol,. The prominent colors used in the PowerPoint template are Green lime , Gray, Black. You can be sure our 11 diverging arrows multilple concepts diagram Circular Network PowerPoint Slides are Second to none. Professionals tell us our isolated PowerPoint templates and PPT Slides are Endearing. PowerPoint presentation experts tell us our 11 diverging arrows multilple concepts diagram Circular Network PowerPoint Slides are Beautiful. You can be sure our indicator PowerPoint templates and PPT Slides are Bold. You can be sure our 11 diverging arrows multilple concepts diagram Circular Network PowerPoint Slides are Appealing. The feedback we get is that our link PowerPoint templates and PPT Slides are Colorful.

Advantage Of Parallel Processing 3d Complementing Arrow 6 Stages Ppt PowerPoint Slides
We present our advantage of parallel processing 3d complementing arrow 6 stages ppt PowerPoint Slides.Download and present our Arrows PowerPoint Templates because Our PowerPoint Templates and Slides ensures Effective communication. They help you put across your views with precision and clarity. Download our Flow Charts PowerPoint Templates because Our PowerPoint Templates and Slides are created with admirable insight. Use them and give your group a sense of your logical mind. Use our Marketing PowerPoint Templates because Our PowerPoint Templates and Slides are created with admirable insight. Use them and give your group a sense of your logical mind. Use our Business PowerPoint Templates because It will Strengthen your hand with your thoughts. They have all the aces you need to win the day. Download and present our Process and Flows PowerPoint Templates because Our PowerPoint Templates and Slides are conceived by a dedicated team. Use them and give form to your wondrous ideas.Use these PowerPoint slides for presentations relating to Arrow, completed, completion, concept, confirmation,design, flow, four, graphic, illustration, indication, indicator, information, layout, measurement, modern, number, one, order, phase, pointer, process, progress, purple, reflection, scale, send, set, shape, sign, two, violet, web, web design, websites, work flow. The prominent colors used in the PowerPoint template are Blue light, Black, Gray. The feedback we get is that our advantage of parallel processing 3d complementing arrow 6 stages ppt PowerPoint Slides are visually appealing. Professionals tell us our four PowerPoint templates and PPT Slides will save the presenter time. Use our advantage of parallel processing 3d complementing arrow 6 stages ppt PowerPoint Slides are visually appealing. Presenters tell us our confirmation PowerPoint templates and PPT Slides effectively help you save your valuable time. You can be sure our advantage of parallel processing 3d complementing arrow 6 stages ppt PowerPoint Slides will impress their bosses and teams. PowerPoint presentation experts tell us our design PowerPoint templates and PPT Slides are visually appealing.
Business PowerPoint Theme Process Diagram Six Decisions Cycle Flow Network Slide
We present our business powerpoint theme process diagram six decisions Cycle Flow Network Slide.Download our Arrows PowerPoint Templates because they are the indicators of the path you have in mind. Download and present our Flow Charts PowerPoint Templates because These PowerPoint Templates and Slides will give the updraft to your ideas. See them soar to great heights with ease. Download and present our Process and Flows PowerPoint Templates because this slide shows each path to the smallest detail. Download our Business PowerPoint Templates because the majestic tiger lord of all it surveys.It exudes power even when it is in repose. Present our Marketing PowerPoint Templates because Our PowerPoint Templates and Slides are conceived by a dedicated team. Use them and give form to your wondrous ideas.Use these PowerPoint slides for presentations relating to Abstract, arrow, background, buttons,circle, clean, communication, concept,conceptual, design, diagram, direction,elements, exchange, flow, flowchart, graph,graphic, icon, illustration, internet, precise, process, sign, symbol, arrows, flows, process, business. The prominent colors used in the PowerPoint template are Blue , White, Black. Use our business powerpoint theme process diagram six decisions Cycle Flow Network Slide are Attractive. Professionals tell us our buttons PowerPoint templates and PPT Slides are Adorable. Customers tell us our business powerpoint theme process diagram six decisions Cycle Flow Network Slide are Whimsical. Presenters tell us our concept PowerPoint templates and PPT Slides are Ritzy. You can be sure our business powerpoint theme process diagram six decisions Cycle Flow Network Slide will impress their bosses and teams. PowerPoint presentation experts tell us our conceptual PowerPoint templates and PPT Slides are Vintage.

Arrows For Ppt Baseline To Measure Improvements PowerPoint Templates Backgrounds Slides
We present our arrows for ppt baseline to measure improvements PowerPoint templates backgrounds slides.Download our Flow charts PowerPoint Templates because Our PowerPoint Templates and Slides will let you Hit the target. Go the full distance with ease and elan. Use our Marketing PowerPoint Templates because It will mark the footprints of your journey. Illustrate how they will lead you to your desired destination. Present our Shapes PowerPoint Templates because They will Put your wonderful verbal artistry on display. Our PowerPoint Templates and Slides will provide you the necessary glam and glitter. Present our Arrows PowerPoint Templates because Our PowerPoint Templates and Slides will help you be quick off the draw. Just enter your specific text and see your points hit home. Download and present our Process and Flows PowerPoint Templates because Our PowerPoint Templates and Slides will embellish your thoughts. See them provide the desired motivation to your team.Use these PowerPoint slides for presentations relating to Arrow, Banner, Bar, Collection, Completion, Concept, Confirmation, Design, Flow, Graph, Graphic, Illustration, Indication, Information, Instruction, Interface, Internet, Layout, Measurement, Modern, Number, Order, Phase, Pointer, Process, Progress, Reflection, Scale, Shape, Stage, Status, Step, Template, Two, Vector, Web, Web Design, Web Design Elements, Websites, Work Flow. The prominent colors used in the PowerPoint template are Green, Blue, Yellow. Customers tell us our arrows for ppt baseline to measure improvements PowerPoint templates backgrounds slides are the best it can get when it comes to presenting. We assure you our Collection PowerPoint templates and PPT Slides are visually appealing. Use our arrows for ppt baseline to measure improvements PowerPoint templates backgrounds slides look good visually. You can be sure our Flow PowerPoint templates and PPT Slides are second to none. PowerPoint presentation experts tell us our arrows for ppt baseline to measure improvements PowerPoint templates backgrounds slides are readymade to fit into any presentation structure. The feedback we get is that our Design PowerPoint templates and PPT Slides effectively help you save your valuable time.

Illustration Of Colorful Diverging 8 Arrows Circular Flow Process PowerPoint Slides
We present our illustration of colorful diverging 8 arrows Circular Flow Process PowerPoint Slides.Use our Circle Charts PowerPoint Templates because the ideas and plans are on your finger tips. Use our Arrows PowerPoint Templates because this diagram has the unique ability to drive home your ideas and show how they mesh to guarantee success. Use our Process and Flows PowerPoint Templates because some opportunities are bound to be highly profitable for you to follow up. Download and present our Business PowerPoint Templates because watch the excitement levels rise as they realise their worth. Download and present our Shapes PowerPoint Templates because it Shines the light on your thoughts and motivates your team to improve the quality of celebration for all around you.Use these PowerPoint slides for presentations relating to Arrow, arrowheads, blue, button,cerulean, circle, circulation, cobalt,colorful, cyan, cycle, element,download, emblem, gray,shadow, green,icon, indicator, interface, internet, label,link, load, marker, motion, movement,navigationpanel, next, orientation, pagesite, pink, pointer, previous, process, red,reload, rotation, stained, sign, symbol,. The prominent colors used in the PowerPoint template are Yellow, Gray, Black. Customers tell us our illustration of colorful diverging 8 arrows Circular Flow Process PowerPoint Slides are Luxurious. Customers tell us our circle PowerPoint templates and PPT Slides are Nifty. Customers tell us our illustration of colorful diverging 8 arrows Circular Flow Process PowerPoint Slides are Pleasant. People tell us our cerulean PowerPoint templates and PPT Slides are Glamorous. Customers tell us our illustration of colorful diverging 8 arrows Circular Flow Process PowerPoint Slides are Fun. Customers tell us our blue PowerPoint templates and PPT Slides will make you look like a winner.
Three Diverging Arrows Pointing Direction Cycle Network PowerPoint Slides
We present our three diverging arrows pointing direction Cycle Network PowerPoint Slides.Download our Arrows PowerPoint Templates because getting it done may not be enough. Present our Triangles PowerPoint Templates because it unravels each one for your audience while setting key timelines as you go along. Present our Shapes PowerPoint Templates because this emphasises on the relevance and importance of all milestones along the way. Present our Business PowerPoint Templates because you have had a great year or so business wise. It is time to celebrate the efforts of your team. Present our Flow Charts PowerPoint Templates because they are Designed to attract the attention of your audience.Use these PowerPoint slides for presentations relating to arrow, arrowheads, badge, banner, blue, button, cerulean, cobalt, colored, colorful, connection, cursor, cyan, design element, designator, directional, download, emblem, gray shadow, green, icon, indicator, interface, internet, link, load, magenta, marker, navigation panel, next, orientation, page site, pictogram, pink, pointer, red, right, satined, sign, signpost, smooth, symbol, . The prominent colors used in the PowerPoint template are Orange, Green, Blue. Presenters tell us our three diverging arrows pointing direction Cycle Network PowerPoint Slides are designed by a team of presentation professionals. You can be sure our banner PowerPoint templates and PPT Slides are Festive. Professionals tell us our three diverging arrows pointing direction Cycle Network PowerPoint Slides are Graceful. People tell us our banner PowerPoint templates and PPT Slides are Gorgeous. People tell us our three diverging arrows pointing direction Cycle Network PowerPoint Slides are Multicolored. Professionals tell us our cerulean PowerPoint templates and PPT Slides are Nifty.
Advantage Of Parallel Processing 7 Stages Arrow Data Flow Diagram PowerPoint Slides
We present our advantage of parallel processing 7 stages arrow data flow diagram PowerPoint Slides.Download and present our Flow Charts PowerPoint Templates because Our PowerPoint Templates and Slides are conceived by a dedicated team. Use them and give form to your wondrous ideas. Download and present our Process and Flows PowerPoint Templates because Our PowerPoint Templates and Slides offer you the needful to organise your thoughts. Use them to list out your views in a logical sequence. Download and present our Arrows PowerPoint Templates because You can Channelise the thoughts of your team with our PowerPoint Templates and Slides. Urge them to focus on the goals you have set. Present our Marketing PowerPoint Templates because Our PowerPoint Templates and Slides will let your words and thoughts hit bullseye everytime. Use our Business PowerPoint Templates because Our PowerPoint Templates and Slides help you pinpoint your timelines. Highlight the reasons for your deadlines with their use.Use these PowerPoint slides for presentations relating to Arrow, completed, completion, concept, confirmation,design, flow, four, graphic, illustration, indication, indicator, information, layout, measurement, modern, number, one, order, phase, pointer, process, progress, purple, reflection, scale, send, set, shape, sign, two, violet, web, web design, websites, work flow. The prominent colors used in the PowerPoint template are Yellow, Gray, Black. The feedback we get is that our advantage of parallel processing 7 stages arrow data flow diagram PowerPoint Slides have awesome images to get your point across. Professionals tell us our flow PowerPoint templates and PPT Slides are designed to make your presentations professional. Use our advantage of parallel processing 7 stages arrow data flow diagram PowerPoint Slides have awesome images to get your point across. Presenters tell us our design PowerPoint templates and PPT Slides will make the presenter successul in his career/life. You can be sure our advantage of parallel processing 7 stages arrow data flow diagram PowerPoint Slides will make you look like a winner. PowerPoint presentation experts tell us our four PowerPoint templates and PPT Slides will help them to explain complicated concepts.
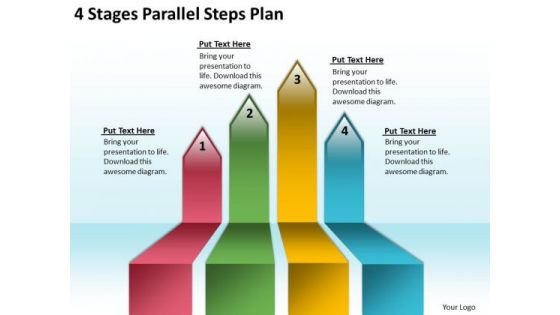
Arrows For PowerPoint Free 4 Stages Parallel Steps Plan Slides
We present our arrows for powerpoint free 4 stages parallel steps plan Slides.Use our Success PowerPoint Templates because They will bring a lot to the table. Their alluring flavours will make your audience salivate. Present our Marketing PowerPoint Templates because Our PowerPoint Templates and Slides will bullet point your ideas. See them fall into place one by one. Use our Arrows PowerPoint Templates because Our PowerPoint Templates and Slides are truly out of this world. Even the MIB duo has been keeping tabs on our team. Download and present our Flow charts PowerPoint Templates because Our PowerPoint Templates and Slides are specially created by a professional team with vast experience. They diligently strive to come up with the right vehicle for your brilliant Ideas. Download and present our Shapes PowerPoint Templates because You can Zap them with our PowerPoint Templates and Slides. See them reel under the impact.Use these PowerPoint slides for presentations relating to Arrow, Banner, Bar, Collection, Completion, Concept, Confirmation, Design, Flow, Graph, Graphic, Illustration, Indication, Information, Instruction, Interface, Internet, Layout, Measurement, Modern, Number, Order, Phase, Pointer, Process, Progress, Reflection, Scale, Shape, Stage, Status, Step, Template, Two, Vector, Web, Web Design, Web Design Elements, Websites, Work Flow. The prominent colors used in the PowerPoint template are Yellow, Red, Green. Customers tell us our arrows for powerpoint free 4 stages parallel steps plan Slides are readymade to fit into any presentation structure. We assure you our Bar PowerPoint templates and PPT Slides will save the presenter time. Use our arrows for powerpoint free 4 stages parallel steps plan Slides are topically designed to provide an attractive backdrop to any subject. You can be sure our Completion PowerPoint templates and PPT Slides will generate and maintain the level of interest you desire. They will create the impression you want to imprint on your audience. PowerPoint presentation experts tell us our arrows for powerpoint free 4 stages parallel steps plan Slides are topically designed to provide an attractive backdrop to any subject. The feedback we get is that our Confirmation PowerPoint templates and PPT Slides will generate and maintain the level of interest you desire. They will create the impression you want to imprint on your audience.

Arrows For Ppt Increasing Process Flows 10 Stages PowerPoint Templates Backgrounds Slides
We present our arrows for ppt increasing process flows 10 stages PowerPoint templates backgrounds slides.Use our Marketing PowerPoint Templates because you can Add colour to your speech with our PowerPoint Templates and Slides. Your presentation will leave your audience speechless. Download and present our Flow charts PowerPoint Templates because It will mark the footprints of your journey. Illustrate how they will lead you to your desired destination. Use our Shapes PowerPoint Templates because you should Whip up a frenzy with our PowerPoint Templates and Slides. They will fuel the excitement of your team. Download and present our Arrows PowerPoint Templates because Our PowerPoint Templates and Slides are focused like a searchlight beam. They highlight your ideas for your target audience. Download and present our Process and Flows PowerPoint Templates because You can Be the star of the show with our PowerPoint Templates and Slides. Rock the stage with your ideas.Use these PowerPoint slides for presentations relating to Arrow, Banner, Bar, Collection, Completion, Concept, Confirmation, Design, Flow, Graph, Graphic, Illustration, Indication, Information, Instruction, Interface, Internet, Layout, Measurement, Modern, Number, Order, Phase, Pointer, Process, Progress, Reflection, Scale, Shape, Stage, Status, Step, Template, Two, Vector, Web, Web Design, Web Design Elements, Websites, Work Flow. The prominent colors used in the PowerPoint template are Blue navy, Blue, Black. Customers tell us our arrows for ppt increasing process flows 10 stages PowerPoint templates backgrounds slides will help them to explain complicated concepts. We assure you our Flow PowerPoint templates and PPT Slides are readymade to fit into any presentation structure. Use our arrows for ppt increasing process flows 10 stages PowerPoint templates backgrounds slides are incredible easy to use. You can be sure our Confirmation PowerPoint templates and PPT Slides will help them to explain complicated concepts. PowerPoint presentation experts tell us our arrows for ppt increasing process flows 10 stages PowerPoint templates backgrounds slides will make the presenter look like a pro even if they are not computer savvy. The feedback we get is that our Confirmation PowerPoint templates and PPT Slides will help them to explain complicated concepts.

Arrows For PowerPoint 2 Stages Connecting Ideas Slides
We present our arrows for powerpoint 2 stages connecting ideas Slides.Use our Flow charts PowerPoint Templates because you can Set pulses racing with our PowerPoint Templates and Slides. They will raise the expectations of your team. Download and present our Marketing PowerPoint Templates because You can Double your output with our PowerPoint Templates and Slides. They make beating deadlines a piece of cake. Use our Shapes PowerPoint Templates because Our PowerPoint Templates and Slides are the chords of your song. String them along and provide the lilt to your views. Download our Arrows PowerPoint Templates because Our PowerPoint Templates and Slides come in all colours, shades and hues. They help highlight every nuance of your views. Download our Process and Flows PowerPoint Templates because It is Aesthetically crafted by artistic young minds. Our PowerPoint Templates and Slides are designed to display your dexterity.Use these PowerPoint slides for presentations relating to Arrow, Banner, Bar, Collection, Completion, Concept, Confirmation, Design, Flow, Graph, Graphic, Illustration, Indication, Information, Instruction, Interface, Internet, Layout, Measurement, Modern, Number, Order, Phase, Pointer, Process, Progress, Reflection, Scale, Shape, Stage, Status, Step, Template, Two, Vector, Web, Web Design, Web Design Elements, Websites, Work Flow. The prominent colors used in the PowerPoint template are Green, White, Black. Customers tell us our arrows for powerpoint 2 stages connecting ideas Slides are designed by a team of presentation professionals. We assure you our Concept PowerPoint templates and PPT Slides are readymade to fit into any presentation structure. Use our arrows for powerpoint 2 stages connecting ideas Slides will generate and maintain the level of interest you desire. They will create the impression you want to imprint on your audience. You can be sure our Concept PowerPoint templates and PPT Slides will impress their bosses and teams. PowerPoint presentation experts tell us our arrows for powerpoint 2 stages connecting ideas Slides will help them to explain complicated concepts. The feedback we get is that our Collection PowerPoint templates and PPT Slides provide you with a vast range of viable options. Select the appropriate ones and just fill in your text.

Ppt Template Continous Way To Show 4 Stages Firm Process 1 Design
We present our PPT template continuous way to show 4 stages firm Process 1 design. Use our Advertising PowerPoint Templates because, they are indicators of the path you have in mind. Use our Business PowerPoint Templates because; now imprint them on the minds of your audience via our slides. Use our Shapes PowerPoint Templates because, Goal Pie Chart Template: - You have a clear vision of the cake you want. Use our Process and Flows PowerPoint Templates because, transmit your thoughts via our slides and prod your team to action. Use our Finance PowerPoint Templates because, the core of any organization is the people who work for it. Use these PowerPoint slides for presentations relating to Abstract, Algorithm, Arrow, Business, Chart, Color, Connection, Design, Development, Direction, Element, Flow, Graph, Linear, Management, Model, Organization, Plan, Process, Program, Section, Segment, Set, Sign, Solution, Strategy, Symbol, Technology. The prominent colors used in the PowerPoint template are Yellow, Blue, and Green
PowerPoint Theme Process Steps Ppt Presentation
Arrows Indicates the way to growth. Use this diagram for improved controls to drive your business towards the right direction

PowerPoint Slide Layout Strategy Steps Ppt Slide Designs
Arrows Indicates the way to growth. Use this diagram for improved controls to drive your business towards the right direction
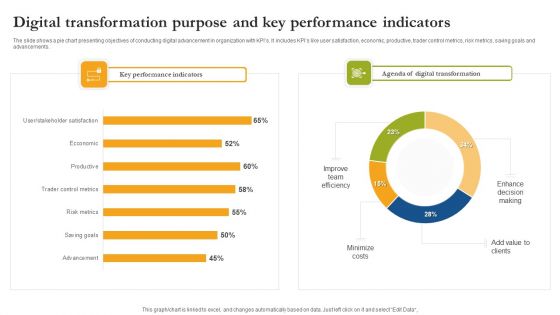
Digital Transformation Purpose And Key Performance Indicators Formats PDF
The slide shows a pie chart presenting objectives of conducting digital advancement in organization with KPIs. It includes KPIs like user satisfaction, economic, productive, trader control metrics, risk metrics, saving goals and advancements. Pitch your topic with ease and precision using this Digital Transformation Purpose And Key Performance Indicators Formats PDF. This layout presents information on Key Performance Indicators, Digital Transformation, Minimize Costs. It is also available for immediate download and adjustment. So, changes can be made in the color, design, graphics or any other component to create a unique layout.
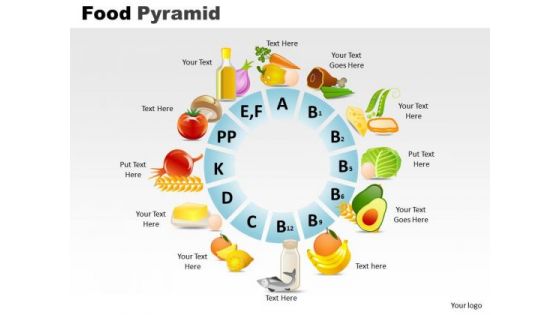
PowerPoint Slides Food Pyramid Editable Ppt Themes
PowerPoint Slides Food Pyramid Editable PPT Themes-A chart indicates various foods filling capacity and nutrition level in an amazing way to inspire people to adopt balance diet-Illustration, balanced, bar, bread, bun, butter, cake, calorie, calories, candy, carbohydrates, cereals, cheese, dairy, diet, egg, fats, fish, food, fresh, fruits, grains, guide, healthy, isolated, market, meat, nutritious, oil, outline, proteins, pyramid, shape, vector, vectors, vegetables-PowerPoint Slides Food Pyramid Editable PPT Themes

PowerPoint Templates Food Pyramid Growth Ppt Theme
PowerPoint Templates Food Pyramid Growth PPT Theme-This chart indicates various foods filling capacity and nutrition level in an amazing way to inspire people to adopt balance diet.-Illustration, balanced, bar, bread, bun, butter, cake, calorie, calories, candy, carbohydrates, cereals, cheese, dairy, diet, egg, fats, fish, food, fresh, fruits, grains, guide, healthy, isolated, market, meat, nutritious, oil, outline, proteins, pyramid, shape, vector, vectors, vegetables-PowerPoint Templates Food Pyramid Growth PPT Theme

Ppt Sequential Model Using Shapes Arrows PowerPoint Templates
PPT sequential model using shapes arrows powerpoint Templates-This Diagram with an image of Even arrows helps you chart the course of your presentation. Use it to show related information. They are indicators of the path you have in mind.-PPT sequential model using shapes arrows powerpoint Templates-action, arrow, badge, banner, blank, business, button, collection, colorful, concern, connect, decoration, design, direction, element, financial, flow, graph, instruction, involve, label, link, method, navigation, operate, procedure, process, relate, sequence, sequent, series, shape, stage, step, successive, technique
Ppt Linear Flow Of Process Using 4 State PowerPoint Presentation Diagram Templates
PPT linear flow of process using 4 state powerpoint presentation diagram Templates-This templatehelps you chart the course of your presentation. The concept and strategy is your strength. Our template will help pinpoint their viability.-PPT linear flow of process using 4 state powerpoint presentation diagram Templates-Aim, Arrow, Arrowheads, Badge, Border, Click, Connection, Curve, Design, Direction, Download, Element, Fuchsia, Icon, Illustration, Indicator, Internet, Magenta, Mark, Object, Orientation, Pointer, Shadow, Shape, Sign
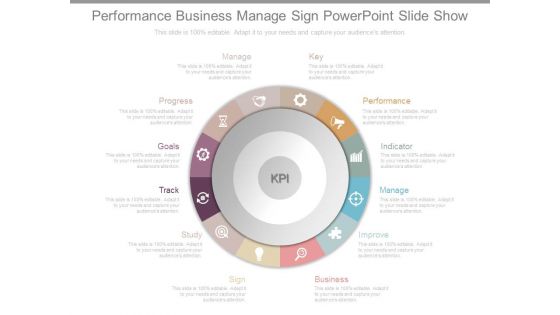
Performance Business Manage Sign Powerpoint Slide Show
This is a performance business manage sign powerpoint slide show. This is a twelve stage process. The stages in this process are key, performance, indicator, manage, improve, business, sign, study, track, goals, progress, manage, kpi.

Ppt Annular Description Of 3 State Diagram Using Arrow PowerPoint Templates
PPT annular description of 3 state diagram using arrow PowerPoint Templates-This PowerPoint diagram shows three circles connected with arrows. Circles defines path functions and arrows indicate the progression of the process-PPT annular description of 3 state diagram using arrow PowerPoint Templates-3d, Arrow, Bevel, Blue, Boy, Bright, Circular, Concept, Design, Fancy, Funky, Graphic, Icon, Illustration, Isolated, Logo, Male, Man, Reflection, Shinning, Sign, Symbol, Vivid
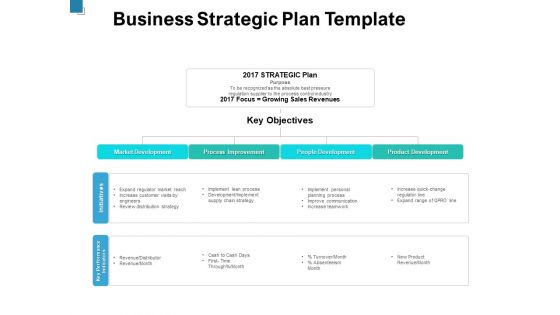
Business Strategic Plan Template Ppt PowerPoint Presentation Pictures Inspiration
Presenting this set of slides with name business strategic plan template ppt powerpoint presentation pictures inspiration. This is a two stage process. The stages in this process are market development, process improvement, people development, product development, key objectives, key performance indicators, initiatives. This is a completely editable PowerPoint presentation and is available for immediate download. Download now and impress your audience.
Ppt Annular Example Of 3 Stages Using Arrow PowerPoint Templates
PPT annular example of 3 stages using arrow PowerPoint Templates-This PowerPoint diagram shows three circles connected with arrows. Circles defines path functions and arrows indicate the progression of the process-PPT annular example of 3 stages using arrow PowerPoint Templates-3d, Arrow, Bevel, Blue, Boy, Bright, Circular, Concept, Design, Fancy, Funky, Graphic, Icon, Illustration, Isolated, Logo, Male, Man, Reflection, Shinning, Sign, Symbol, Vivid

Business Framework Business Communication Plan PowerPoint Presentation
Explain the importance of business communication plan with this power point diagram slide. To display BCP we have used graphic of plan. This image indicate the internal and external communication points for any business. Use this image for business communication related topics and build innovative presentations for your clients.

Business Analyst Key Skills Diagram Powerpoint Ideas
This is a business analyst key skills diagram powerpoint ideas. This is a four stage process. The stages in this process are business analysis role skills and abilities, business analysis role, personal underlying competencies and characteristics, techniques and tools experiences and skills, data and process modelling, requirements workshops, prototyping, interviewing, metrics and key performance indicators, vendor and software assessment.
Ppt Annular Illustration Of 3 State PowerPoint Template Diagram Using Arrow Templates
PPT annular illustration of 3 state powerpoint template diagram using arrow Templates-This PowerPoint diagram shows three circles connected with arrows. Circles defines path functions and arrows indicate the progression of the process-PPT annular illustration of 3 state powerpoint template diagram using arrow Templates-3d, Arrow, Bevel, Blue, Boy, Bright, Circular, Concept, Design, Fancy, Funky, Graphic, Icon, Illustration, Isolated, Logo, Male, Man, Reflection, Shinning, Sign, Symbol, Vivid
Ppt Annular Demonstration Of 3 Power Point Stage Using Arrow PowerPoint Templates
PPT annular demonstration of 3 power point stage using arrow PowerPoint Templates-This PowerPoint diagram shows three circles connected with arrows. Circles defines path functions and arrows indicate the progression of the process-PPT annular demonstration of 3 power point stage using arrow PowerPoint Templates-3d, Arrow, Bevel, Blue, Boy, Bright, Circular, Concept, Design, Fancy, Funky, Graphic, Icon, Illustration, Isolated, Logo, Male, Man, Reflection, Shinning, Sign, Symbol, Vivid

Ppt Half Circle PowerPoint 2010 Stage Through Bubbles 4 Steps Templates
PPT half circle powerpoint 2010 stage through bubbles 4 steps Templates-Use this Business based PowerPoint Diagram to represent the Business issues Graphically. It indicates arrange, block out, blueprint, cast, delineate, design, devise, draft, graph , lay out, outline, plot, project, shape, sketch etc.-PPT half circle powerpoint 2010 stage through bubbles 4 steps Templates-Add, Aqua, Arrows, Badges, Bar, Blend, Blue, Bright, Bubbles, Buttons, Caution, Circle, Drop, Elements, Glossy, Glowing, Graphic, Heart, Help, Icons, Idea, Illustration, Navigation, Oblong, Plus, Round, Service, Shadow, Shiny, Sign, Speech, Squares

Ppt Steps Working With Slide Numbers A Process Timeline PowerPoint Templates
PPT steps working with slide numbers a process timeline PowerPoint Templates-This Business PowerPoint Diagram shows 3d linear abstraction to prevent Business losses. It uses six steps. It indicates employment, field, function, game, line, and livelihood. It is helpful to organize information. This PowerPoint slides are professionally animated. -PPT steps working with slide numbers a process timeline PowerPoint Templates-3d, Advertisement, Advertising, Arrow, Border, Business, Circles, Collection, Customer, Design, Element, Icon, Idea, Illustration, Info, Information, Isolated, Label, Light, Location, Needle, New, Notification, Notify, Point, Pointer, Promotion, Role, Rounded

Ppt Four Colorful Puzzles Forming Circle Showing Red PowerPoint Templates
PPT four colorful puzzles forming circle showing red powerpoint templates-This PowerPoint Diagram shows the text highlighted in Red segment explaining the concept in circular manner. It Indicates articulation, bit, compartment, cut, division, member, moiety, indirect, oblique, orbicular, ring-shaped, round, rounded, spheroid etc. -Can be used for presentations on action, active, art, artwork, backdrop, background, beauty, body, cartoon, color, curve, dance, decoration, design, drawing, element, emotion, enjoy, enjoyment, erotic, exaltation, expression, female, girl, gladness, graphic, health, human, illustration, isolated, joy, jump, leap, life, lifestyle, love, naked, nude, ornament, people, play, sensual, sexy, shape, silhouette, slender, slim, vector, woman, young-PPT four colorful puzzles forming circle showing red powerpoint templates
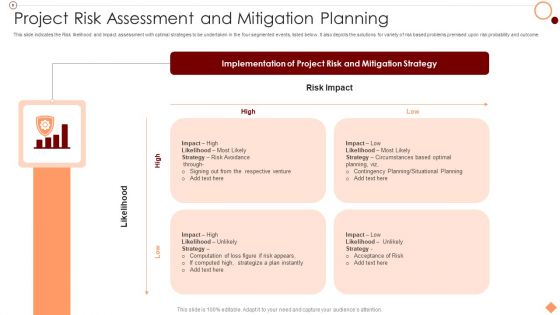
Project Risk Assessment And Mitigation Planning Graphics PDF
This slide indicates the Risk likelihood and Impact assessment with optimal strategies to be undertaken in the four segmented events, listed below. It also depicts the solutions for variety of risk based problems premised upon risk probability and outcome.Persuade your audience using this Project Risk Assessment And Mitigation Planning Graphics PDF. This PPT design covers four stages, thus making it a great tool to use. It also caters to a variety of topics including Implementation Project, Risk, Mitigation Strategy. Download this PPT design now to present a convincing pitch that not only emphasizes the topic but also showcases your presentation skills.
Ppt Four Colorful PowerPoint Background Puzzles Forming Circle Showing Yellow Templates
PPT four colorful powerpoint background puzzles forming circle showing yellow Templates-This PowerPoint Diagram shows the text highlighted in Yellow segment explaining the concept in circular manner. It Indicates annular, circulate, circling, dislike, indirect, oblique, orbicular, ring-shaped, round, rounded, spheroid etc.-Can be used for presentations on action, active, art, artwork, backdrop, background, beauty, body, cartoon, color, curve, dance, decoration, design, drawing, element, emotion, enjoy, enjoyment, erotic, exaltation, expression, female, girl, gladness, graphic, health, human, illustration, isolated, joy, jump, leap, life, lifestyle, love, naked, nude, ornament, people, play, sensual, sexy, shape, silhouette, slender, slim, vector, woman, young-PPT four colorful powerpoint background puzzles forming circle showing yellow Templates

Ppt Four Colorful PowerPoint Presentations Puzzles Forming Circle Showing Blue Templates
PPT four colorful powerpoint presentations puzzles forming circle showing blue Templates-This PowerPoint Diagram shows the text highlighted in blue segment explaining the concept in circular manner. It Indicates articulation, bit, compartment, cut, division, member, moiety, parcel, piece, portion, section, sector, slice, subdivision, wedge etc.-Can be used for presentations on action, active, art, artwork, backdrop, background, beauty, body, cartoon, color, curve, dance, decoration, design, drawing, element, emotion, enjoy, enjoyment, erotic, exaltation, expression, female, girl, gladness, graphic, health, human, illustration, isolated, joy, jump, leap, life, lifestyle, love, naked, nude, ornament, people, play, sensual, sexy, shape, silhouette, slender, slim, vector, woman, young-PPT four colorful powerpoint presentations puzzles forming circle showing blue Templates
Ppt Four Colorful Puzzles Forming Circle Showing Green PowerPoint Slide Templates
PPT four colorful puzzles forming circle showing green powerpoint slide Templates-This PowerPoint Diagram shows the text highlighted in Green segment explaining the concept in circular manner. It Indicates articulation, bit, compartment, cut, division, member, moiety, indirect, oblique, orbicular, ring-shaped, round, rounded, spheroid etc. -Can be used for presentations on action, active, art, artwork, backdrop, background, beauty, body, cartoon, color, curve, dance, decoration, design, drawing, element, emotion, enjoy, enjoyment, erotic, exaltation, expression, female, girl, gladness, graphic, health, human, illustration, isolated, joy, jump, leap, life, lifestyle, love, naked, nude, ornament, people, play, sensual, sexy, shape, silhouette, slender, slim, vector, woman, young-PPT four colorful puzzles forming circle showing green powerpoint slide Templates
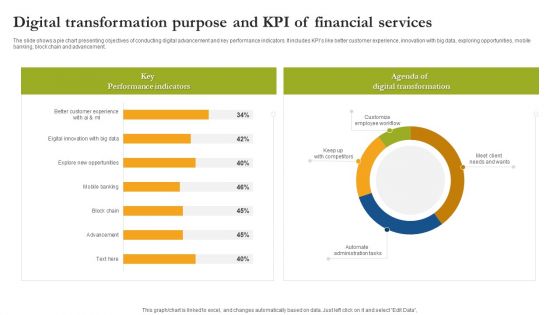
Digital Transformation Purpose And Kpi Of Financial Services Guidelines PDF
The slide shows a pie chart presenting objectives of conducting digital advancement and key performance indicators. It includes KPIs like better customer experience, innovation with big data, exploring opportunities, mobile banking, block chain and advancement. Showcasing this set of slides titled Digital Transformation Purpose And Kpi Of Financial Services Guidelines PDF. The topics addressed in these templates are Key Performance Indicators Digital Transformation, Customize Employee Workflow. All the content presented in this PPT design is completely editable. Download it and make adjustments in color, background, font etc. as per your unique business setting.

Software Implementation Strategy Key Performance Indicators Highlighting Current Problems Of Organization Professional PDF
This slide represents the key performance indicators to track the problems faced by organization and draw effective strategies to tackle the problems. It includes key performance indicators of decline in organizational sales and customer engagement rate. Make sure to capture your audiences attention in your business displays with our gratis customizable Software Implementation Strategy Key Performance Indicators Highlighting Current Problems Of Organization Professional PDF. These are great for business strategies, office conferences, capital raising or task suggestions. If you desire to acquire more customers for your tech business and ensure they stay satisfied, create your own sales presentation with these plain slides.
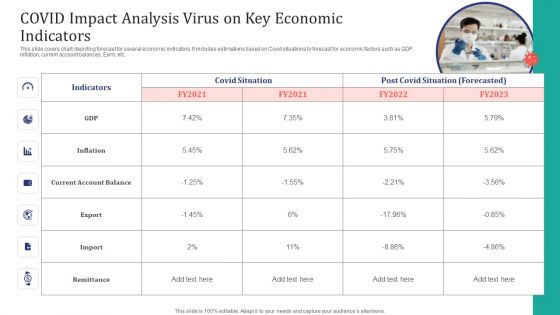
COVID Impact Analysis Virus On Key Economic Indicators Ppt Pictures Inspiration PDF
This slide covers chart depicting forecast for several economic indicators. It includes estimations based on Covid situations to forecast for economic factors such as GDP, inflation, current account balances, Exim, etc. Pitch your topic with ease and precision using this COVID Impact Analysis Virus On Key Economic Indicators Ppt Pictures Inspiration PDF. This layout presents information on Covid Situation, Post Covid Situation, Current Account Balance. It is also available for immediate download and adjustment. So, changes can be made in the color, design, graphics or any other component to create a unique layout.
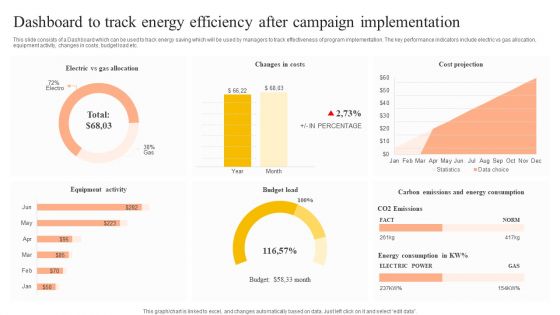
Dashboard To Track Energy Efficiency After Campaign Implementation Pictures PDF
This slide consists of a Dashboard which can be used to track energy saving which will be used by managers to track effectiveness of program implementation. The key performance indicators include electric vs gas allocation, equipment activity, changes in costs, budget load etc. Showcasing this set of slides titled Dashboard To Track Energy Efficiency After Campaign Implementation Pictures PDF. The topics addressed in these templates are Equipment Activity, Budget Load, Cost Projection. All the content presented in this PPT design is completely editable. Download it and make adjustments in color, background, font etc. as per your unique business setting.
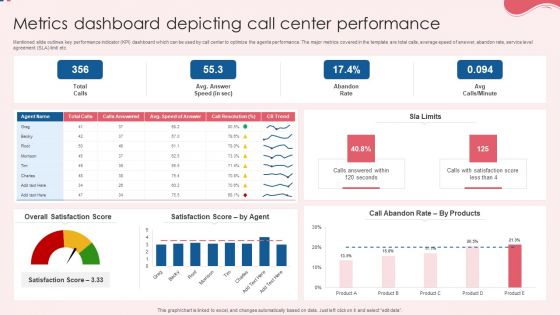
Metrics Dashboard Depicting Call Center Performance Pictures PDF
Mentioned slide outlines key performance indicator KPI dashboard which can be used by call center to optimize the agents performance. The major metrics covered in the template are total calls, average speed of answer, abandon rate, service level agreement SLA limit etc. Pitch your topic with ease and precision using this Metrics Dashboard Depicting Call Center Performance Pictures PDF. This layout presents information on Overall Satisfaction Score, Satisfaction Score, Performance. It is also available for immediate download and adjustment. So, changes can be made in the color, design, graphics or any other component to create a unique layout.
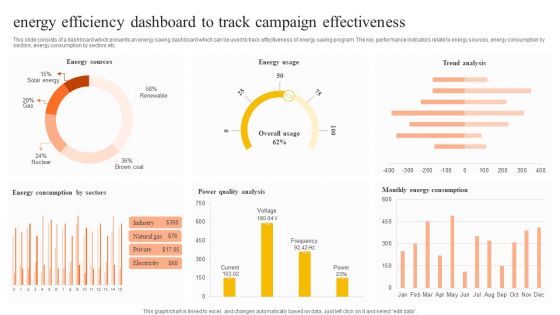
Energy Efficiency Dashboard To Track Campaign Effectiveness Pictures PDF
This slide consists of a dashboard which presents an energy saving dashboard which can be used to track effectiveness of energy saving program. The key performance indicators relate to energy sources, energy consumption by sectors, energy consumption by sectors etc. Pitch your topic with ease and precision using this Energy Efficiency Dashboard To Track Campaign Effectiveness Pictures PDF. This layout presents information on Energy Sources, Energy Usage, Trend Analysis. It is also available for immediate download and adjustment. So, changes can be made in the color, design, graphics or any other component to create a unique layout.

Information Technology Project Analysis With Kpi Dashboard Portrait PDF
The following slide highlights various key performance indicators to ensure successful information technology IT project completion. It also includes components such as risks, status, budget, deadlines, average task handle time, overdue activities etc. Pitch your topic with ease and precision using this Information Technology Project Analysis With Kpi Dashboard Portrait PDF. This layout presents information on Planning Completed, Design Completed, Development . It is also available for immediate download and adjustment. So, changes can be made in the color, design, graphics or any other component to create a unique layout.
Analysis Plan For E Commerce Promotion Tactics Content Performance Tracking Dashboard For Social Media Channels Icons PDF
This slide indicates the content performance tracking dashboard for social media channels providing information regarding the total number of posts, engagement rate, audience sentiments and multiple hashtags performance. Formulating a presentation can take up a lot of effort and time, so the content and message should always be the primary focus. The visuals of the PowerPoint can enhance the presenters message, so our Analysis Plan For E Commerce Promotion Tactics Content Performance Tracking Dashboard For Social Media Channels Icons PDF was created to help save time. Instead of worrying about the design, the presenter can concentrate on the message while our designers work on creating the ideal templates for whatever situation is needed. Slidegeeks has experts for everything from amazing designs to valuable content, we have put everything into Analysis Plan For E Commerce Promotion Tactics Content Performance Tracking Dashboard For Social Media Channels Icons PDF
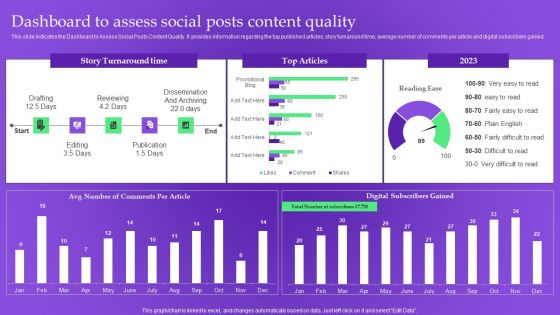
Analysis Plan For E Commerce Promotion Tactics Dashboard To Assess Social Posts Content Quality Sample PDF
This slide indicates the Dashboard to Assess Social Posts Content Quality. It provides information regarding the top published articles, story turnaround time, average number of comments per article and digital subscribers gained. This modern and well arranged Analysis Plan For E Commerce Promotion Tactics Dashboard To Assess Social Posts Content Quality Sample PDF provides lots of creative possibilities. It is very simple to customize and edit with the Powerpoint Software. Just drag and drop your pictures into the shapes. All facets of this template can be edited with Powerpoint no extra software is necessary. Add your own material, put your images in the places assigned for them, adjust the colors, and then you can show your slides to the world, with an animated slide included.

Set Of Five Vertical Steps Powerpoint Templates
This slide has been professionally created for visual representation of steps of a process. The multicolored circles which have been arranged in can be used to depict individual steps in a systematic and organized manner. This template can be used to indicate a link between individuals and can also be used to represent Hierarchy of an organization. It would be one of the easiest ways to graphically represent the flow of information or data from the top level to the lower level or vice versa in a vertical manner. This slide can also be used to depict a planned course of action. Adequate space has been marked for description which can be modified or removed as per individual needs and requirements.

Usa Ppt Template Linear Arrow 11 Phase Diagram Time Management PowerPoint 6 Design
USA PPT template linear arrow 11 phase diagram time management powerpoint 6 design-This linear arrow chart makes information accessible throughout the organization with a collective, visible view of critical data from different perspectives and providing the tools to upcoming business scenarios and plan for change.-USA PPT template linear arrow 11 phase diagram time management powerpoint 6 design-Arrow, Background, Collection, Completed, Concept, Confirmation, Design, Flow, Graph, Graphic, Illustration, Indication, Indicator, Information, Instruction, Interface, Internet, Layout, Measurement, Order, Phase, Pointer, Process, Progress, Reflection, Scale, Shape, Sign
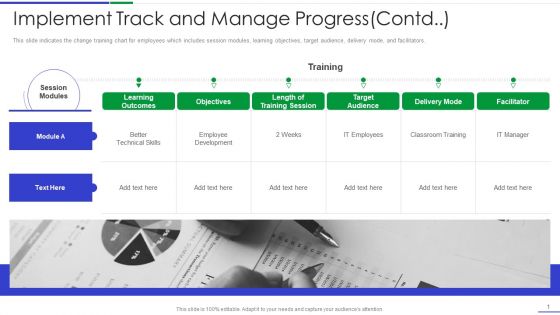
Ultimate Guide To Effective Change Management Process Implement Track And Manage Progress Contd Topics PDF
This slide indicates the change training chart for employees which includes session modules, learning objectives, target audience, delivery mode, and facilitators. Presenting ultimate guide to effective change management process implement track and manage progress contd topics pdf to provide visual cues and insights. Share and navigate important information on one stages that need your due attention. This template can be used to pitch topics like objectives, target audience, facilitator, training, development. In addtion, this PPT design contains high resolution images, graphics, etc, that are easily editable and available for immediate download.
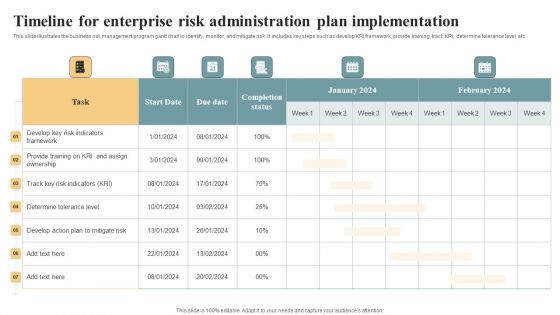
Timeline For Enterprise Risk Administration Plan Implementation Designs PDF
This slide illustrates the business risk management program gantt chart to identify, monitor, and mitigate risk. It includes key steps such as develop KRI framework, provide training, track KRI, determine tolerance level, etc. Showcasing this set of slides titled Timeline For Enterprise Risk Administration Plan Implementation Designs PDF. The topics addressed in these templates are Develop Key Risk, Indicators Framework, Determine Tolerance Level . All the content presented in this PPT design is completely editable. Download it and make adjustments in color, background, font etc. as per your unique business setting.

Ppt Continuous Description To Represent Seven Steps Process PowerPoint Templates
PPT continuous description to represent seven steps process PowerPoint Templates-Use this layout to define the outcome and the multiple possibilities in a way that is used in calculation of probabilities, genetics and strategic reasoning. This chart visualizes the concept of process steps, reoccurrences and components or of your company structure or product features. You can change color, size and orientation of any icon to your liking. -PPT continuous description to represent seven steps process PowerPoint Templates-Aim, Arrow, Arrowheads, Badge, Border, Click, Connection, Curve, Design, Direction, Download, Element, Fuchsia, Icon, Illustration, Indicator, Internet, Magenta, Mark, Object, Orientation, Pointer, Shadow, Shape, Sign
Ppt Horizontal Description To Represent Seven Steps In Process PowerPoint Templates
PPT horizontal description to represent seven steps in process PowerPoint Templates-Use this Business Process Chart which consists of seven text boxes to describe seven different approaches. It imitates affairs, bargaining, barter, buying and selling, contracts, deal, dealings, exchange, free enterprise, game, industrialism, industry, manufacturing, manner, means, measure, mechanism, mode, modus operandi, movement, operation, and outgrowth.-PPT horizontal description to represent seven steps in process PowerPoint Templates-Aim, Arrow, Arrowheads, Badge, Border, Click, Connection, Curve, Design, Direction, Download, Element, Fuchsia, Icon, Illustration, Indicator, Internet, Magenta, Mark, Object, Orientation, Pointer, Shadow, Shape, Sign

Business Projects Portfolio Spotlight Status Report Template Brochure PDF
The slide showcases a spotlight status report for multiple projects of a software development company. It depicts a stoplight chart to indicate which projects in a portfolio are in good shape the colours red, yellow, and green are used to show status. Showcasing this set of slides titled Business Projects Portfolio Spotlight Status Report Template Brochure PDF. The topics addressed in these templates are Business Projects Portfolio, Spotlight Status, Report Template. All the content presented in this PPT design is completely editable. Download it and make adjustments in color, background, font etc. as per your unique business setting.
Customer Satisfaction Levels High Medium Low Indicator Dashboard Ppt PowerPoint Presentation Icon Show
This is a customer satisfaction levels high medium low indicator dashboard ppt powerpoint presentation icon show. This is a six stage process. The stages in this process are performance dashboard, performance meter, performance kpi.
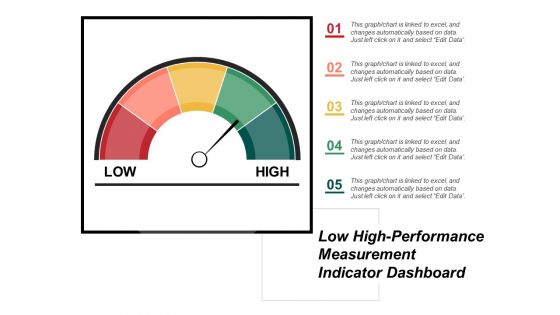
Low High Performance Measurement Indicator Dashboard Ppt PowerPoint Presentation Summary Images
This is a low high performance measurement indicator dashboard ppt powerpoint presentation summary images. This is a five stage process. The stages in this process are performance dashboard, performance meter, performance kpi.

 Home
Home