Gauge Chart
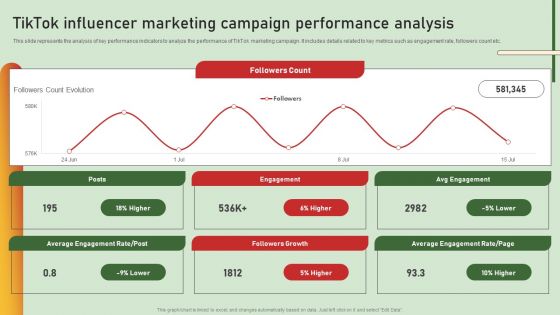
Comprehensive Influencer Promotional Guide To Improve Brand Reputation Tiktok Influencer Marketing Campaign Brochure PDF
This slide represents the analysis of key performance indicators to analyze the performance of TikTok marketing campaign. It includes details related to key metrics such as engagement rate, followers count etc. Present like a pro with Comprehensive Influencer Promotional Guide To Improve Brand Reputation Tiktok Influencer Marketing Campaign Brochure PDF Create beautiful presentations together with your team, using our easy to use presentation slides. Share your ideas in real time and make changes on the fly by downloading our templates. So whether you are in the office, on the go, or in a remote location, you can stay in sync with your team and present your ideas with confidence. With Slidegeeks presentation got a whole lot easier. Grab these presentations today.
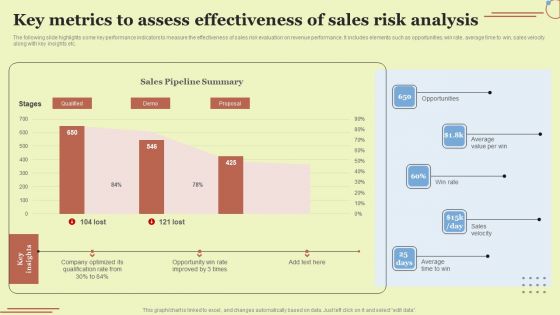
Key Metrics To Assess Effectiveness Of Sales Risk Analysis Download PDF
The following slide highlights some key performance indicators to measure the effectiveness of sales risk evaluation on revenue performance. It includes elements such as opportunities, win rate, average time to win, sales velocity along with key insights etc. Get a simple yet stunning designed Key Metrics To Assess Effectiveness Of Sales Risk Analysis Download PDF. It is the best one to establish the tone in your meetings. It is an excellent way to make your presentations highly effective. So, download this PPT today from Slidegeeks and see the positive impacts. Our easy to edit Key Metrics To Assess Effectiveness Of Sales Risk Analysis Download PDF can be your go to option for all upcoming conferences and meetings. So, what are you waiting for Grab this template today.
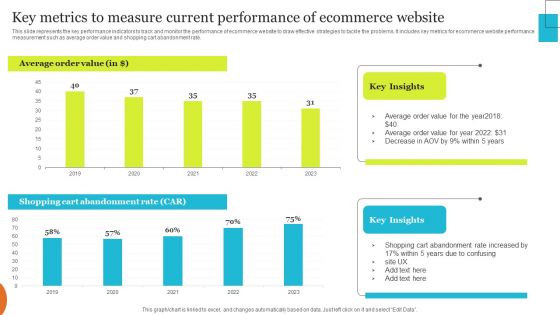
Implementing Effective Ecommerce Managemnet Platform Key Metrics To Measure Current Performance Clipart PDF
This slide represents the key performance indicators to track and monitor the performance of ecommerce website to draw effective strategies to tackle the problems. It includes key metrics for ecommerce website performance measurement such as average order value and shopping cart abandonment rate. Want to ace your presentation in front of a live audience Our Implementing Effective Ecommerce Managemnet Platform Key Metrics To Measure Current Performance Clipart PDF can help you do that by engaging all the users towards you. Slidegeeks experts have put their efforts and expertise into creating these impeccable powerpoint presentations so that you can communicate your ideas clearly. Moreover, all the templates are customizable, and easy to edit and downloadable. Use these for both personal and commercial use.
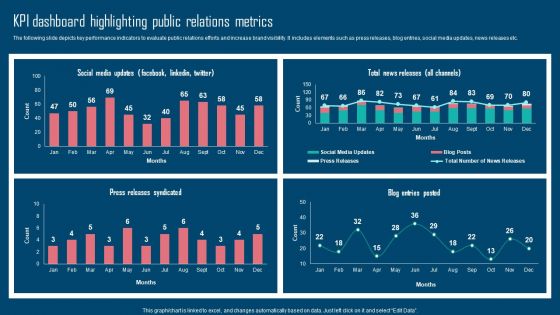
Adopting IMC Technique To Boost Brand Recognition Kpi Dashboard Highlighting Public Relations Metrics Brochure PDF
The following slide depicts key performance indicators to evaluate public relations efforts and increase brand visibility. It includes elements such as press releases, blog entries, social media updates, news releases etc. Formulating a presentation can take up a lot of effort and time, so the content and message should always be the primary focus. The visuals of the PowerPoint can enhance the presenters message, so our Adopting IMC Technique To Boost Brand Recognition Kpi Dashboard Highlighting Public Relations Metrics Brochure PDF was created to help save time. Instead of worrying about the design, the presenter can concentrate on the message while our designers work on creating the ideal templates for whatever situation is needed. Slidegeeks has experts for everything from amazing designs to valuable content, we have put everything into Adopting IMC Technique To Boost Brand Recognition Kpi Dashboard Highlighting Public Relations Metrics Brochure PDF
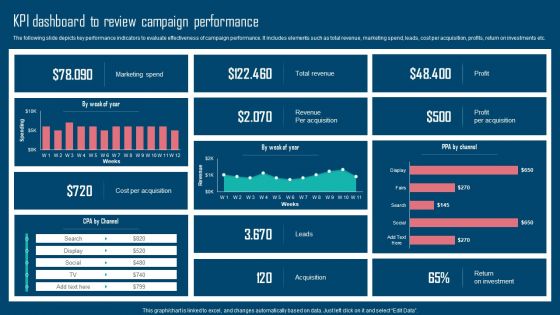
Adopting IMC Technique To Boost Brand Recognition Kpi Dashboard To Review Campaign Performance Pictures PDF
The following slide depicts key performance indicators to evaluate effectiveness of campaign performance. It includes elements such as total revenue, marketing spend, leads, cost per acquisition, profits, return on investments etc. This modern and well arranged Adopting IMC Technique To Boost Brand Recognition Kpi Dashboard To Review Campaign Performance Pictures PDF provides lots of creative possibilities. It is very simple to customize and edit with the Powerpoint Software. Just drag and drop your pictures into the shapes. All facets of this template can be edited with Powerpoint no extra software is necessary. Add your own material, put your images in the places assigned for them, adjust the colors, and then you can show your slides to the world, with an animated slide included.
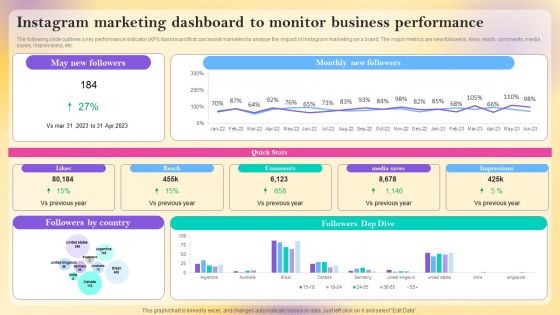
Instagram Marketing Dashboard To Monitor Business Performance Information PDF
The following slide outlines a key performance indicator KPI dashboard that can assist marketers to analyze the impact of Instagram marketing on a brand. The major metrics are new followers, likes, reach, comments, media saves, impressions, etc. This Instagram Marketing Dashboard To Monitor Business Performance Information PDF is perfect for any presentation, be it in front of clients or colleagues. It is a versatile and stylish solution for organizing your meetings. The product features a modern design for your presentation meetings. The adjustable and customizable slides provide unlimited possibilities for acing up your presentation. Slidegeeks has done all the homework before launching the product for you. So, do not wait, grab the presentation templates today

Video Promotion Service Investor Funding Elevator Pitch Deck Financial Performance Professional PDF
The slide mentions the revenue, run rate and margin percentage of the company indicating the growth in organizations financial performance Slidegeeks is here to make your presentations a breeze with Video Promotion Service Investor Funding Elevator Pitch Deck Financial Performance Professional PDF With our easy to use and customizable templates, you can focus on delivering your ideas rather than worrying about formatting. With a variety of designs to choose from, you are sure to find one that suits your needs. And with animations and unique photos, illustrations, and fonts, you can make your presentation pop. So whether you are giving a sales pitch or presenting to the board, make sure to check out Slidegeeks first.
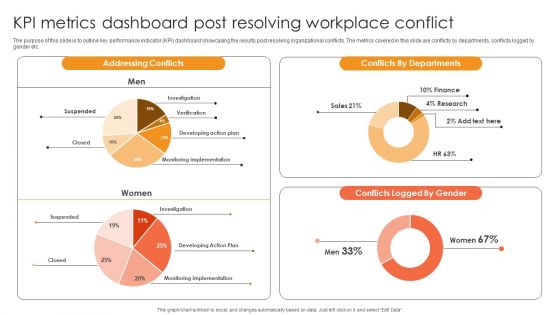
Kpi Metrics Dashboard Post Resolving Workplace Conflict Ppt Inspiration Graphics Download PDF
The purpose of this slide is to outline key performance indicator KPI dashboard showcasing the results post resolving organizational conflicts. The metrics covered in this slide are conflicts by departments, conflicts logged by gender etc. This Kpi Metrics Dashboard Post Resolving Workplace Conflict Ppt Inspiration Graphics Download PDF is perfect for any presentation, be it in front of clients or colleagues. It is a versatile and stylish solution for organizing your meetings. The Kpi Metrics Dashboard Post Resolving Workplace Conflict Ppt Inspiration Graphics Download PDF features a modern design for your presentation meetings. The adjustable and customizable slides provide unlimited possibilities for acing up your presentation. Slidegeeks has done all the homework before launching the product for you. So, do not wait, grab the presentation templates today
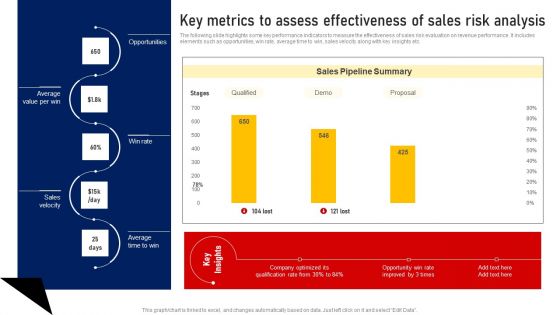
Performing Sales Risk Analysis Procedure Key Metrics To Assess Effectiveness Of Sales Risk Analysis Brochure PDF
The following slide highlights some key performance indicators to measure the effectiveness of sales risk evaluation on revenue performance. It includes elements such as opportunities, win rate, average time to win, sales velocity along with key insights etc. Get a simple yet stunning designed Performing Sales Risk Analysis Procedure Key Metrics To Assess Effectiveness Of Sales Risk Analysis Brochure PDF. It is the best one to establish the tone in your meetings. It is an excellent way to make your presentations highly effective. So, download this PPT today from Slidegeeks and see the positive impacts. Our easy to edit Performing Sales Risk Analysis Procedure Key Metrics To Assess Effectiveness Of Sales Risk Analysis Brochure PDF can be your go to option for all upcoming conferences and meetings. So, what are you waiting for Grab this template today.
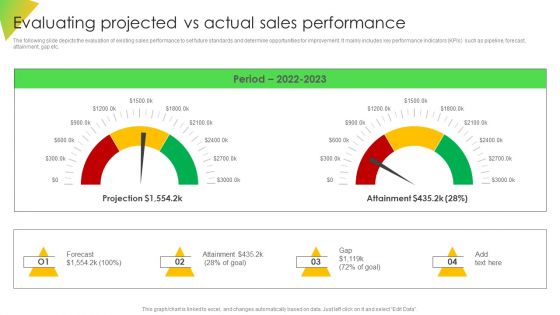
Evaluating Projected Vs Actual Sales Performance Microsoft PDF
The following slide depicts the evaluation of existing sales performance to set future standards and determine opportunities for improvement. It mainly includes key performance indicators KPIs such as pipeline, forecast, attainment, gap etc. Get a simple yet stunning designed Evaluating Projected Vs Actual Sales Performance Microsoft PDF. It is the best one to establish the tone in your meetings. It is an excellent way to make your presentations highly effective. So, download this PPT today from Slidegeeks and see the positive impacts. Our easy to edit Evaluating Projected Vs Actual Sales Performance Microsoft PDF can be your go to option for all upcoming conferences and meetings. So, what are you waiting for Grab this template today.

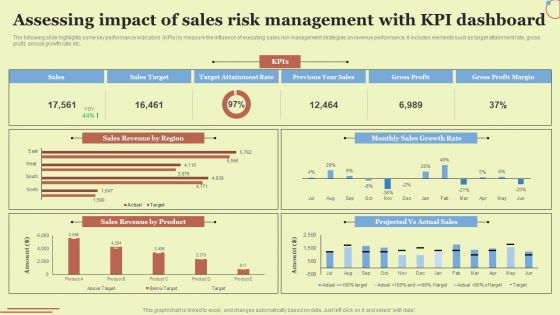
Assessing Impact Of Sales Risk Management With KPI Dashboard Ppt Professional Graphics Pictures PDF
The following slide highlights some key performance indicators KPIs to measure the influence of executing sales risk management strategies on revenue performance. It includes elements such as target attainment rate, gross profit, annual growth rate etc. Are you in need of a template that can accommodate all of your creative concepts This one is crafted professionally and can be altered to fit any style. Use it with Google Slides or PowerPoint. Include striking photographs, symbols, depictions, and other visuals. Fill, move around, or remove text boxes as desired. Test out color palettes and font mixtures. Edit and save your work, or work with colleagues. Download Assessing Impact Of Sales Risk Management With KPI Dashboard Ppt Professional Graphics Pictures PDF and observe how to make your presentation outstanding. Give an impeccable presentation to your group and make your presentation unforgettable.

Tactics For Establishing Sustainable Hybrid Work Environment Work From Home Performance Management Dashboard Information PDF
The following slide outlines a comprehensive key performance indicator KPI dashboard that can be used to showcase employees performance during work-from-home WFH. Information covered in this slide is related to average result area scores etc. Want to ace your presentation in front of a live audience Our Tactics For Establishing Sustainable Hybrid Work Environment Work From Home Performance Management Dashboard Information PDF can help you do that by engaging all the users towards you. Slidegeeks experts have put their efforts and expertise into creating these impeccable powerpoint presentations so that you can communicate your ideas clearly. Moreover, all the templates are customizable, and easy to edit and downloadable. Use these for both personal and commercial use.
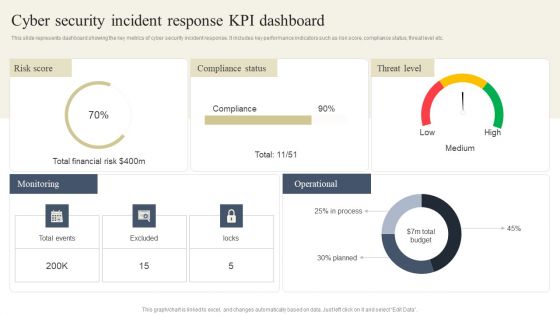
CYBER Security Breache Response Strategy Cyber Security Incident Response Kpi Dashboard Rules PDF
This slide represents dashboard showing the key metrics of cyber security incident response. It includes key performance indicators such as risk score, compliance status, threat level etc. Crafting an eye catching presentation has never been more straightforward. Let your presentation shine with this tasteful yet straightforward CYBER Security Breache Response Strategy Cyber Security Incident Response Kpi Dashboard Rules PDF template. It offers a minimalistic and classy look that is great for making a statement. The colors have been employed intelligently to add a bit of playfulness while still remaining professional. Construct the ideal CYBER Security Breache Response Strategy Cyber Security Incident Response Kpi Dashboard Rules PDF that effortlessly grabs the attention of your audience. Begin now and be certain to wow your customers.
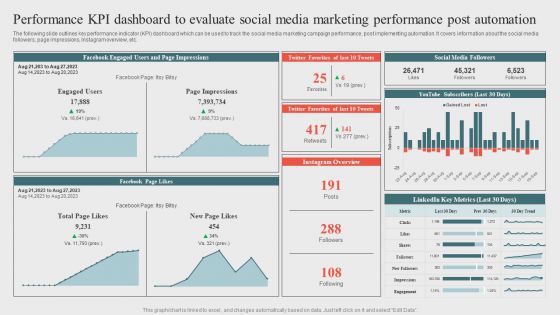
Performance Kpi Dashboard To Evaluate Social Mediaoptimizing Business Processes Through Automation Slides PDF
The following slide outlines key performance indicator KPI dashboard which can be used to track the social media marketing campaign performance, post implementing automation. It covers information about the social media followers, page impressions, Instagram overview, etc.Present like a pro with Performance Kpi Dashboard To Evaluate Social Mediaoptimizing Business Processes Through Automation Slides PDF Create beautiful presentations together with your team, using our easy to use presentation slides. Share your ideas in real time and make changes on the fly by downloading our templates. So whether you are in the office, on the go, or in a remote location, you can stay in sync with your team and present your ideas with confidence. With Slidegeeks presentation got a whole lot easier. Grab these presentations today.
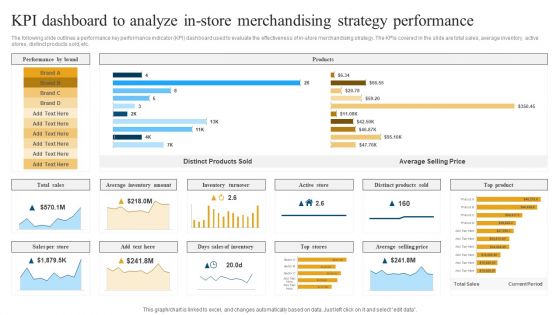
Retail Ecommerce Merchandising Tactics For Boosting Revenue KPI Dashboard To Analyze In Store Merchandising Rules PDF
The following slide outlines a performance key performance indicator KPI dashboard used to evaluate the effectiveness of in-store merchandising strategy. The KPIs covered in the slide are total sales, average inventory, active stores, distinct products sold, etc. Crafting an eye catching presentation has never been more straightforward. Let your presentation shine with this tasteful yet straightforward Retail Ecommerce Merchandising Tactics For Boosting Revenue KPI Dashboard To Analyze In Store Merchandising Rules PDF template. It offers a minimalistic and classy look that is great for making a statement. The colors have been employed intelligently to add a bit of playfulness while still remaining professional. Construct the ideal Retail Ecommerce Merchandising Tactics For Boosting Revenue KPI Dashboard To Analyze In Store Merchandising Rules PDF that effortlessly grabs the attention of your audience. Begin now and be certain to wow your customers.

Increasing Consumer Engagement With Database KPI Dashboard To Analyze Targeted Email Infographics PDF
The purpose of this slide is to highlight key performance indicator KPI dashboard which can be used by marketers to evaluate targeted email marketing campaign performance. The metrics are requests, opens, clicks, opens by country, opens vs clicks by month, etc. This modern and well arranged Increasing Consumer Engagement With Database KPI Dashboard To Analyze Targeted Email Infographics PDF provides lots of creative possibilities. It is very simple to customize and edit with the Powerpoint Software. Just drag and drop your pictures into the shapes. All facets of this template can be edited with Powerpoint no extra software is necessary. Add your own material, put your images in the places assigned for them, adjust the colors, and then you can show your slides to the world, with an animated slide included.

Cashless Payment Strategies To Enhance Business Performance Impact Of BNLP Payment Business Performance Mockup PDF
Mentioned slide demonstrates the impact of Buy Now Pay Later payment option adoption on business goals. It includes key performance indicators such as new customer engagement, market share, order level and conversion rate. Formulating a presentation can take up a lot of effort and time, so the content and message should always be the primary focus. The visuals of the PowerPoint can enhance the presenters message, so our Cashless Payment Strategies To Enhance Business Performance Impact Of BNLP Payment Business Performance Mockup PDF was created to help save time. Instead of worrying about the design, the presenter can concentrate on the message while our designers work on creating the ideal templates for whatever situation is needed. Slidegeeks has experts for everything from amazing designs to valuable content, we have put everything into Cashless Payment Strategies To Enhance Business Performance Impact Of BNLP Payment Business Performance Mockup PDF

Performance Dashboard To Measure Marketing Campaign Performance Brochure PDF
The following slide outlines key performance indicator KPI dashboard that can assist digital marketers to evaluate marketing campaign performance. The success metrics outlined in slide are total spend on advertisement, cost per thousand CPM, cost per click CPC, click-through rate CTR, etc. Want to ace your presentation in front of a live audience Our Performance Dashboard To Measure Marketing Campaign Performance Brochure PDF can help you do that by engaging all the users towards you.. Slidegeeks experts have put their efforts and expertise into creating these impeccable powerpoint presentations so that you can communicate your ideas clearly. Moreover, all the templates are customizable, and easy-to-edit and downloadable. Use these for both personal and commercial use.

Introduction To Mobile SEM KPI Metrics Dashboard To Monitor Mobile SEO Performance Diagrams PDF
The purpose of this slide is to outline key performance indicator KPI dashboard which will assist the marketer to analyze mobile search engine optimization SEO performance. The key metrics mentioned in the slide are total sessions, search engine rankings etc. Take your projects to the next level with our ultimate collection of Introduction To Mobile SEM KPI Metrics Dashboard To Monitor Mobile SEO Performance Diagrams PDF. Slidegeeks has designed a range of layouts that are perfect for representing task or activity duration, keeping track of all your deadlines at a glance. Tailor these designs to your exact needs and give them a truly corporate look with your own brand colors they will make your projects stand out from the rest.

Impact Of Customer Churn On Organization Performance Background PDF
Mentioned slide outlines the impact of a higher attrition rate on the companys financial performance. It contains information about major financial key performance indicators KPIs such as monthly recurring revenue MRR, customer lifetime value CLV, and customer acquisition cost CAC. Take your projects to the next level with our ultimate collection of Impact Of Customer Churn On Organization Performance Background PDF. Slidegeeks has designed a range of layouts that are perfect for representing task or activity duration, keeping track of all your deadlines at a glance. Tailor these designs to your exact needs and give them a truly corporate look with your own brand colors they will make your projects stand out from the rest.

Tactical Employee Engagement Action Planning Employee Engagement Satisfaction Kpi Dashboard Sample PDF
The following slide showcases employee engagement and satisfaction key performance indicators to encourage healthy team relationships. It includes key elements such as net promotor score, retention and absenteeism rate etc. Presenting this PowerPoint presentation, titled Tactical Employee Engagement Action Planning Employee Engagement Satisfaction Kpi Dashboard Sample PDF, with topics curated by our researchers after extensive research. This editable presentation is available for immediate download and provides attractive features when used. Download now and captivate your audience. Presenting this Tactical Employee Engagement Action Planning Employee Engagement Satisfaction Kpi Dashboard Sample PDF. Our researchers have carefully researched and created these slides with all aspects taken into consideration. This is a completely customizable Tactical Employee Engagement Action Planning Employee Engagement Satisfaction Kpi Dashboard Sample PDF that is available for immediate downloading. Download now and make an impact on your audience. Highlight the attractive features available with our PPTs.

Company Risk Assessment Plan Credit Risk Management KPI Dashboard Rules PDF
This slide covers the dashboard representing key performance indicators related to management of credit risks. It includes details related to regulatory parameters, exposure by credit rating etc. Do you have an important presentation coming up. Are you looking for something that will make your presentation stand out from the rest. Look no further than Company Risk Assessment Plan Credit Risk Management KPI Dashboard Rules PDF. With our professional designs, you can trust that your presentation will pop and make delivering it a smooth process. And with Slidegeeks, you can trust that your presentation will be unique and memorable. So why wait. GrabCompany Risk Assessment Plan Credit Risk Management KPI Dashboard Rules PDF today and make your presentation stand out from the rest.
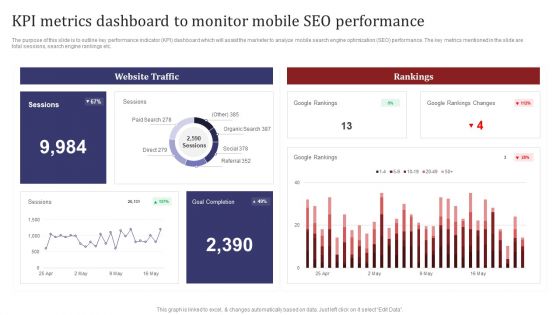
Mobile Search Engine Optimization Plan KPI Metrics Dashboard To Monitor Mobile SEO Performance Inspiration PDF
The purpose of this slide is to outline key performance indicator KPI dashboard which will assist the marketer to analyze mobile search engine optimization SEO performance. The key metrics mentioned in the slide are total sessions, search engine rankings etc. This Mobile Search Engine Optimization Plan KPI Metrics Dashboard To Monitor Mobile SEO Performance Inspiration PDF from Slidegeeks makes it easy to present information on your topic with precision. It provides customization options, so you can make changes to the colors, design, graphics, or any other component to create a unique layout. It is also available for immediate download, so you can begin using it right away. Slidegeeks has done good research to ensure that you have everything you need to make your presentation stand out. Make a name out there for a brilliant performance.

Market Research Assessment Of Target Market Requirements Brand Analytics Kpi Dashboard For Organization Clipart PDF
The following slide outlines key performance indicator KPI dashboard that can assist marketers to evaluate brand performance on social media channels. The metrics covered are age group, gender, brand perception, branding themes, celebrity analysis, etc. Do you have an important presentation coming up Are you looking for something that will make your presentation stand out from the rest Look no further than Market Research Assessment Of Target Market Requirements Brand Analytics Kpi Dashboard For Organization Clipart PDF. With our professional designs, you can trust that your presentation will pop and make delivering it a smooth process. And with Slidegeeks, you can trust that your presentation will be unique and memorable. So why wait Grab Market Research Assessment Of Target Market Requirements Brand Analytics Kpi Dashboard For Organization Clipart PDF today and make your presentation stand out from the rest.

Evaluating Impact Of Green Marketing With Kpi Dashboard Inspiration PDF
The following slide depicts dashboard to evaluate consequences of sustainable marketing on sales performance and plan future actions. It includes key performance indicators such as orders, net profit margin, sales by location, channel, packaging costs, sales price etc. This Evaluating Impact Of Green Marketing With Kpi Dashboard Inspiration PDF from Slidegeeks makes it easy to present information on your topic with precision. It provides customization options, so you can make changes to the colors, design, graphics, or any other component to create a unique layout. It is also available for immediate download, so you can begin using it right away. Slidegeeks has done good research to ensure that you have everything you need to make your presentation stand out. Make a name out there for a brilliant performance.
Cloud Performance Tracking Dashboard Managing Complexity Of Multiple Cloud Platforms Download PDF
This slide covers the key performance indicators for tracking performance of the cloud such as violations break down, sources, rules and severity.Presenting this PowerPoint presentation, titled Cloud Performance Tracking Dashboard Managing Complexity Of Multiple Cloud Platforms Download PDF, with topics curated by our researchers after extensive research. This editable presentation is available for immediate download and provides attractive features when used. Download now and captivate your audience. Presenting this Cloud Performance Tracking Dashboard Managing Complexity Of Multiple Cloud Platforms Download PDF. Our researchers have carefully researched and created these slides with all aspects taken into consideration. This is a completely customizable Cloud Performance Tracking Dashboard Managing Complexity Of Multiple Cloud Platforms Download PDF that is available for immediate downloading. Download now and make an impact on your audience. Highlight the attractive features available with our PPTs.

Ecommerce KPI Dashboard With Pand L Statement Download PDF
This slide showcases ecommerce key performance indicators KPI dashboard with financial statement. It provides information about total sales, orders, net profit, net profit margin, average order value, channels, etc. This Ecommerce KPI Dashboard With Pand L Statement Download PDF from Slidegeeks makes it easy to present information on your topic with precision. It provides customization options, so you can make changes to the colors, design, graphics, or any other component to create a unique layout. It is also available for immediate download, so you can begin using it right away. Slidegeeks has done good research to ensure that you have everything you need to make your presentation stand out. Make a name out there for a brilliant performance.

KPI Dashboard To Analyze Performance Of Healthcare Financial Department Summary PDF
The following slide showcases key performance indicator KPI dashboard which can be used to analyze the financial performance of hospital. The metrics covered in the slide are net profit margin, income and expenses, etc. Do you have an important presentation coming up Are you looking for something that will make your presentation stand out from the rest Look no further than KPI Dashboard To Analyze Performance Of Healthcare Financial Department Summary PDF. With our professional designs, you can trust that your presentation will pop and make delivering it a smooth process. And with Slidegeeks, you can trust that your presentation will be unique and memorable. So why wait Grab KPI Dashboard To Analyze Performance Of Healthcare Financial Department Summary PDF today and make your presentation stand out from the rest.
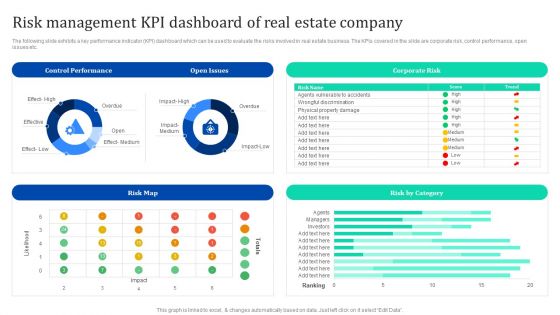
Risk Management Kpi Dashboard Of Real Estate Company Enhancing Process Improvement By Regularly Inspiration PDF
The following slide exhibits a key performance indicator KPI dashboard which can be used to evaluate the risks involved in real estate business. The KPIs covered in the slide are corporate risk, control performance, open issues etc. This Risk Management Kpi Dashboard Of Real Estate Company Enhancing Process Improvement By Regularly Inspiration PDF from Slidegeeks makes it easy to present information on your topic with precision. It provides customization options, so you can make changes to the colors, design, graphics, or any other component to create a unique layout. It is also available for immediate download, so you can begin using it right away. Slidegeeks has done good research to ensure that you have everything you need to make your presentation stand out. Make a name out there for a brilliant performance.
Strategies To Maintain Transportation Shipping And Logistics Tracking Dashboard With Shipments Ppt Infographics Information PDF
This slide covers Key performance indicators to track the automation system of the company. This dashboard includes Logistics Efficiency Status, delivery time accuracy etc. Presenting this PowerPoint presentation, titled Strategies To Maintain Transportation Shipping And Logistics Tracking Dashboard With Shipments Ppt Infographics Information PDF, with topics curated by our researchers after extensive research. This editable presentation is available for immediate download and provides attractive features when used. Download now and captivate your audience. Presenting this Strategies To Maintain Transportation Shipping And Logistics Tracking Dashboard With Shipments Ppt Infographics Information PDF. Our researchers have carefully researched and created these slides with all aspects taken into consideration. This is a completely customizable Strategies To Maintain Transportation Shipping And Logistics Tracking Dashboard With Shipments Ppt Infographics Information PDF that is available for immediate downloading. Download now and make an impact on your audience. Highlight the attractive features available with our PPTs.
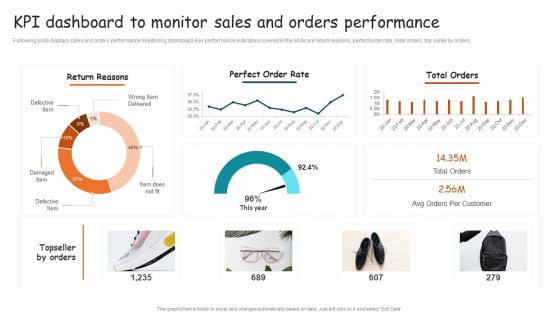
Guide For Brand Kpi Dashboard To Monitor Sales And Orders Performance Brochure PDF
Following slide displays sales and orders performance monitoring dashboard. Key performance indicators covered in the slide are return reasons, perfect order rate, total orders, top seller by orders. Do you have an important presentation coming up Are you looking for something that will make your presentation stand out from the rest Look no further than Guide For Brand Kpi Dashboard To Monitor Sales And Orders Performance Brochure PDF. With our professional designs, you can trust that your presentation will pop and make delivering it a smooth process. And with Slidegeeks, you can trust that your presentation will be unique and memorable. So why wait Grab Guide For Brand Kpi Dashboard To Monitor Sales And Orders Performance Brochure PDF today and make your presentation stand out from the rest.

Kpi Dashboard For Monitoring Warehouse Operations Stand Out Digital Supply Chain Tactics Enhancing Information PDF
Mentioned slide illustrates warehouse operations dashboard with key performance indicators KPIs. KPIs included are operating cost, order rate, total shipment by country and on-time shipment.Presenting this PowerPoint presentation, titled Kpi Dashboard For Monitoring Warehouse Operations Stand Out Digital Supply Chain Tactics Enhancing Information PDF, with topics curated by our researchers after extensive research. This editable presentation is available for immediate download and provides attractive features when used. Download now and captivate your audience. Presenting this Kpi Dashboard For Monitoring Warehouse Operations Stand Out Digital Supply Chain Tactics Enhancing Information PDF. Our researchers have carefully researched and created these slides with all aspects taken into consideration. This is a completely customizable Kpi Dashboard For Monitoring Warehouse Operations Stand Out Digital Supply Chain Tactics Enhancing Information PDF that is available for immediate downloading. Download now and make an impact on your audience. Highlight the attractive features available with our PPTs.
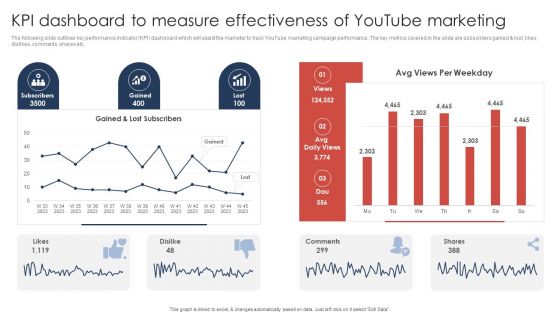
Kpi Dashboard To Measure Effectiveness Of Youtube Marketing Slides PDF
The following slide outlines key performance indicator KPI dashboard which will assist the marketer to track YouTube marketing campaign performance. The key metrics covered in the slide are subscribers gained and lost, likes, dislikes, comments, shares etc. Do you have an important presentation coming up Are you looking for something that will make your presentation stand out from the rest Look no further than Kpi Dashboard To Measure Effectiveness Of Youtube Marketing Slides PDF. With our professional designs, you can trust that your presentation will pop and make delivering it a smooth process. And with Slidegeeks, you can trust that your presentation will be unique and memorable. So why wait Grab Kpi Dashboard To Measure Effectiveness Of Youtube Marketing Slides PDF today and make your presentation stand out from the rest.

Retail Business Optimization Through Operational Excellence Strategy Determining Back Order Rate Slides PDF
Following slide illustrates information stats about back order rate and rate of return in the year 2020. Here the graph indicates that back order rate get exceeded to 4.8 percent from the target value in 2020. Do you have an important presentation coming up Are you looking for something that will make your presentation stand out from the rest Look no further than Retail Business Optimization Through Operational Excellence Strategy Determining Back Order Rate Slides PDF. With our professional designs, you can trust that your presentation will pop and make delivering it a smooth process. And with Slidegeeks, you can trust that your presentation will be unique and memorable. So why wait Grab Retail Business Optimization Through Operational Excellence Strategy Determining Back Order Rate Slides PDF today and make your presentation stand out from the rest.
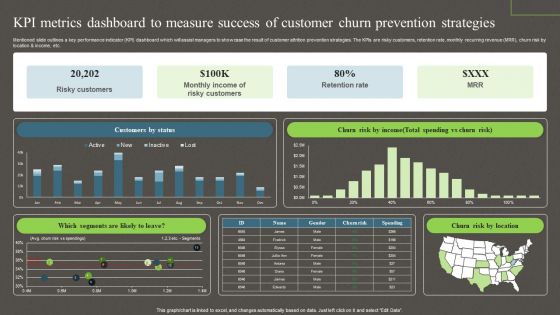
Kpi Metrics Dashboard To Measure Success Of Customer Churn Prevention Strategies Ppt PowerPoint Presentation File Model PDF
Mentioned slide outlines a key performance indicator KPI dashboard which will assist managers to showcase the result of customer attrition prevention strategies. The KPIs are risky customers, retention rate, monthly recurring revenue MRR, churn risk by location and income, etc. This Kpi Metrics Dashboard To Measure Success Of Customer Churn Prevention Strategies Ppt PowerPoint Presentation File Model PDF from Slidegeeks makes it easy to present information on your topic with precision. It provides customization options, so you can make changes to the colors, design, graphics, or any other component to create a unique layout. It is also available for immediate download, so you can begin using it right away. Slidegeeks has done good research to ensure that you have everything you need to make your presentation stand out. Make a name out there for a brilliant performance.

Definitive Guide To Conduct Digital Marketing Inspection Dashboard To Assess Social Posts Content Quality Summary PDF
This slide indicates the Dashboard to Assess Social Posts Content Quality. It provides information regarding the top published articles, story turnaround time, average number of comments per article and digital subscribers gained. Take your projects to the next level with our ultimate collection of Definitive Guide To Conduct Digital Marketing Inspection Dashboard To Assess Social Posts Content Quality Summary PDF. Slidegeeks has designed a range of layouts that are perfect for representing task or activity duration, keeping track of all your deadlines at a glance. Tailor these designs to your exact needs and give them a truly corporate look with your own brand colors they will make your projects stand out from the rest.

Retail Business Operation Management To Optimize Customer Experience Determining Back Order Rate Rules PDF
Following slide illustrates information stats about back order rate and rate of return in the year 2023. Here the graph indicates that back order rate get exceeded to 4.8percent from the target value in 2023. Do you have an important presentation coming up Are you looking for something that will make your presentation stand out from the rest Look no further than Retail Business Operation Management To Optimize Customer Experience Determining Back Order Rate Rules PDF. With our professional designs, you can trust that your presentation will pop and make delivering it a smooth process. And with Slidegeeks, you can trust that your presentation will be unique and memorable. So why wait Grab Retail Business Operation Management To Optimize Customer Experience Determining Back Order Rate Rules PDF today and make your presentation stand out from the rest.
Assessing Impact Of Sales Risk Management With KPI Dashboard Ideas PDF
The following slide highlights some key performance indicators KPIs to measure the influence of executing sales risk management strategies on revenue performance. It includes elements such as target attainment rate, gross profit, annual growth rate etc. Presenting this PowerPoint presentation, titled Assessing Impact Of Sales Risk Management With KPI Dashboard Ideas PDF, with topics curated by our researchers after extensive research. This editable presentation is available for immediate download and provides attractive features when used. Download now and captivate your audience. Presenting this Assessing Impact Of Sales Risk Management With KPI Dashboard Ideas PDF. Our researchers have carefully researched and created these slides with all aspects taken into consideration. This is a completely customizable Assessing Impact Of Sales Risk Management With KPI Dashboard Ideas PDF that is available for immediate downloading. Download now and make an impact on your audience. Highlight the attractive features available with our PPTs.

Ecommerce Photo Editing Services Fundraising Deck Financial Performance Demonstration PDF
The following slide outlines the yearly revenue of our company. The graphical representation covers information about annual sales from 2019-2022 that indicates upward growth. This Ecommerce Photo Editing Services Fundraising Deck Financial Performance Demonstration PDF from Slidegeeks makes it easy to present information on your topic with precision. It provides customization options, so you can make changes to the colors, design, graphics, or any other component to create a unique layout. It is also available for immediate download, so you can begin using it right away. Slidegeeks has done good research to ensure that you have everything you need to make your presentation stand out. Make a name out there for a brilliant performance.
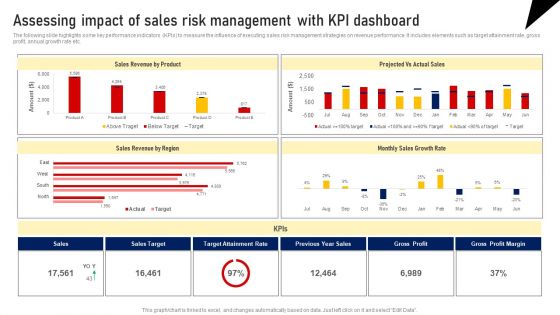
Assessing Impact Of Sales Risk Management With Kpi Dashboard Formats PDF
The following slide highlights some key performance indicators KPIs to measure the influence of executing sales risk management strategies on revenue performance. It includes elements such as target attainment rate, gross profit, annual growth rate etc. Presenting this PowerPoint presentation, titled Assessing Impact Of Sales Risk Management With Kpi Dashboard Formats PDF, with topics curated by our researchers after extensive research. This editable presentation is available for immediate download and provides attractive features when used. Download now and captivate your audience. Presenting this Assessing Impact Of Sales Risk Management With Kpi Dashboard Formats PDF. Our researchers have carefully researched and created these slides with all aspects taken into consideration. This is a completely customizable Assessing Impact Of Sales Risk Management With Kpi Dashboard Formats PDF that is available for immediate downloading. Download now and make an impact on your audience. Highlight the attractive features available with our PPTs.
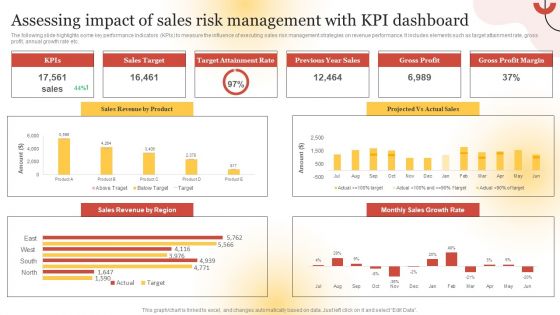
Assessing Impact Of Sales Risk Management With KPI Dashboard Guidelines PDF
The following slide highlights some key performance indicators KPIs to measure the influence of executing sales risk management strategies on revenue performance. It includes elements such as target attainment rate, gross profit, annual growth rate etc. Presenting this PowerPoint presentation, titled Assessing Impact Of Sales Risk Management With KPI Dashboard Guidelines PDF, with topics curated by our researchers after extensive research. This editable presentation is available for immediate download and provides attractive features when used. Download now and captivate your audience. Presenting this Assessing Impact Of Sales Risk Management With KPI Dashboard Guidelines PDF. Our researchers have carefully researched and created these slides with all aspects taken into consideration. This is a completely customizable Assessing Impact Of Sales Risk Management With KPI Dashboard Guidelines PDF that is available for immediate downloading. Download now and make an impact on your audience. Highlight the attractive features available with our PPTs.
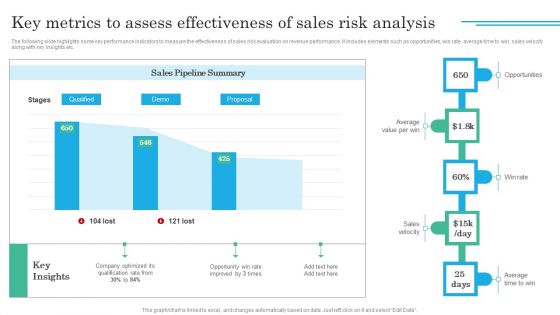
Implementing Sales Volatility Management Techniques Key Metrics To Assess Effectiveness Of Sales Designs PDF
The following slide highlights some key performance indicators to measure the effectiveness of sales risk evaluation on revenue performance. It includes elements such as opportunities, win rate, average time to win, sales velocity along with key insights etc. Do you have an important presentation coming up Are you looking for something that will make your presentation stand out from the rest Look no further than Implementing Sales Volatility Management Techniques Key Metrics To Assess Effectiveness Of Sales Designs PDF. With our professional designs, you can trust that your presentation will pop and make delivering it a smooth process. And with Slidegeeks, you can trust that your presentation will be unique and memorable. So why wait Grab Implementing Sales Volatility Management Techniques Key Metrics To Assess Effectiveness Of Sales Designs PDF today and make your presentation stand out from the rest.

Determining Risks In Sales Administration Procedure Key Metrics To Assess Effectiveness Of Sales Pictures PDF
The following slide highlights some key performance indicators to measure the effectiveness of sales risk evaluation on revenue performance. It includes elements such as opportunities, win rate, average time to win, sales velocity along with key insights etc. This Determining Risks In Sales Administration Procedure Key Metrics To Assess Effectiveness Of Sales Pictures PDF from Slidegeeks makes it easy to present information on your topic with precision. It provides customization options, so you can make changes to the colors, design, graphics, or any other component to create a unique layout. It is also available for immediate download, so you can begin using it right away. Slidegeeks has done good research to ensure that you have everything you need to make your presentation stand out. Make a name out there for a brilliant performance.

Dashboard To Analyze Flexible Working Strategies Impact On Employees Performance Infographics PDF
The following slide delineates a key performance indicator KPI dashboard through which managers can evaluate the success of a flexible working policy on workforce performance. The major KPIs are absenteeism rate, overall labor effectiveness etc. Presenting this PowerPoint presentation, titled Dashboard To Analyze Flexible Working Strategies Impact On Employees Performance Infographics PDF, with topics curated by our researchers after extensive research. This editable presentation is available for immediate download and provides attractive features when used. Download now and captivate your audience. Presenting this Dashboard To Analyze Flexible Working Strategies Impact On Employees Performance Infographics PDF. Our researchers have carefully researched and created these slides with all aspects taken into consideration. This is a completely customizable Dashboard To Analyze Flexible Working Strategies Impact On Employees Performance Infographics PDF that is available for immediate downloading. Download now and make an impact on your audience. Highlight the attractive features available with our PPTs.

Guide To Healthcare Services Administration KPI Metrics Dashboard To Measure Effectiveness Healthcare Information PDF
The following slide showcases key performance indicator KPI metrics dashboard which can be used to evaluate the success rate of healthcare recruitment. It covers information about technical and non-technical hiring, recruitment costs, current hiring pipeline etc. This Guide To Healthcare Services Administration KPI Metrics Dashboard To Measure Effectiveness Healthcare Information PDF from Slidegeeks makes it easy to present information on your topic with precision. It provides customization options, so you can make changes to the colors, design, graphics, or any other component to create a unique layout. It is also available for immediate download, so you can begin using it right away. Slidegeeks has done good research to ensure that you have everything you need to make your presentation stand out. Make a name out there for a brilliant performance.

Implementing Cyber Security Incident Enterprise Cyber Risk Dashboard Professional PDF
This slide represents the key metrics dashboard representing details related to management of cyber security incidents by an enterprise. It includes key performance indicators such as risk analysis progress, risk rating breakdown etc. Do you have an important presentation coming up Are you looking for something that will make your presentation stand out from the rest Look no further than Implementing Cyber Security Incident Enterprise Cyber Risk Dashboard Professional PDF. With our professional designs, you can trust that your presentation will pop and make delivering it a smooth process. And with Slidegeeks, you can trust that your presentation will be unique and memorable. So why wait Grab Implementing Cyber Security Incident Enterprise Cyber Risk Dashboard Professional PDF today and make your presentation stand out from the rest.

Arrow Diagram Indicate The Tasks Circular Flow Layout Process PowerPoint Slides
We present our arrow diagram indicate the tasks Circular Flow Layout Process PowerPoint Slides.Download and present our Business PowerPoint Templates because your thoughts are pointed and sharp as arrows. Present our Ring Charts PowerPoint Templates because it Draws the universal impact to highlight the similarities with your organizational structure and plans. Download our Marketing PowerPoint Templates because networking is an imperative in todays world. You need to access the views of others. Similarly you need to give access to them of your abilities. Use our Shapes PowerPoint Templates because different people with differing ideas and priorities perform together to score. Download our Process and Flows PowerPoint Templates because you have a great plan to put the pieces together, getting all the various contributors to gel for a successful completion.Use these PowerPoint slides for presentations relating to Arrows, choice, connect, design, direction, flows, four, info graph, instruction, layout, manual, marketing, modern, one, option, order, page, paper, pointing, process, product, promotion, sequence, simple, special, step, symbol. The prominent colors used in the PowerPoint template are Purple, Blue, Black. Presenters tell us our arrow diagram indicate the tasks Circular Flow Layout Process PowerPoint Slides are Majestic. Professionals tell us our info PowerPoint templates and PPT Slides are Breathtaking. PowerPoint presentation experts tell us our arrow diagram indicate the tasks Circular Flow Layout Process PowerPoint Slides are Clever. The feedback we get is that our info PowerPoint templates and PPT Slides are Nifty. Use our arrow diagram indicate the tasks Circular Flow Layout Process PowerPoint Slides are One-of-a-kind. Use our four PowerPoint templates and PPT Slides are readymade to fit into any presentation structure.
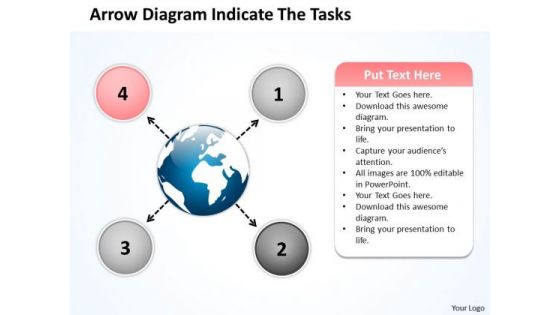
Arrow Diagram Indicate The Tasks Circle Circular Flow Layout Process PowerPoint Slides
We present our arrow diagram indicate the tasks circle Circular Flow Layout Process PowerPoint Slides.Download our Business PowerPoint Templates because this diagram helps you to show goal also clearly etched in your mind. Use our Ring Charts PowerPoint Templates because you have the ideas to develop the teams vision of where they need to be in the future. Download our Marketing PowerPoint Templates because networking is an imperative in todays world. You need to access the views of others. Similarly you need to give access to them of your abilities. Download and present our Shapes PowerPoint Templates because this slide shows each path to the smallest detail. Download our Process and Flows PowerPoint Templates because this Layout helps you to expand your plans to overcome obstacles and reassure the team that they shall continue to roll along merrily.Use these PowerPoint slides for presentations relating to Arrows, choice, connect, design, direction, flows, four, info graph, instruction, layout, manual, marketing, modern, one, option, order, page, paper, pointing, process, product, promotion, sequence, simple, special, step, symbol. The prominent colors used in the PowerPoint template are Pink, Blue, White. Presenters tell us our arrow diagram indicate the tasks circle Circular Flow Layout Process PowerPoint Slides will help you be quick off the draw. Just enter your specific text and see your points hit home. Professionals tell us our info PowerPoint templates and PPT Slides provide you with a vast range of viable options. Select the appropriate ones and just fill in your text. PowerPoint presentation experts tell us our arrow diagram indicate the tasks circle Circular Flow Layout Process PowerPoint Slides are Dazzling. The feedback we get is that our connect PowerPoint templates and PPT Slides will make you look like a winner. Use our arrow diagram indicate the tasks circle Circular Flow Layout Process PowerPoint Slides are Detailed. Use our four PowerPoint templates and PPT Slides are Spectacular.

Key Performance Indicator Tree Indicating Fixed And Variable Costs Diagrams PDF
Persuade your audience using this key performance indicator tree indicating fixed and variable costs diagrams pdf. This PPT design covers four stages, thus making it a great tool to use. It also caters to a variety of topics including costs, revenue, profit. Download this PPT design now to present a convincing pitch that not only emphasizes the topic but also showcases your presentation skills.

Business Framework Loading Bar Progress Indicator PowerPoint Presentation
This business diagram displays bar progress indicators. This business slide contains the concept of business growth shown in multiple levels. Use this diagram to present and compare data in an impressive manner.

Key Performance Indicator Tree Illustrating Online Application Revenue Download PDF
Presenting key performance indicator tree illustrating online application revenue download pdf to dispense important information. This template comprises three stages. It also presents valuable insights into the topics including daily conversion, returning users, daily revenue. This is a completely customizable PowerPoint theme that can be put to use immediately. So, download it and address the topic impactfully.

Key Performance Indicator Tree Depicting Project Fault Repair Diagrams PDF
Presenting key performance indicator tree depicting project fault repair diagrams pdf to dispense important information. This template comprises three stages. It also presents valuable insights into the topics including customer interaction, managing the business, fixing the fault. This is a completely customizable PowerPoint theme that can be put to use immediately. So, download it and address the topic impactfully.
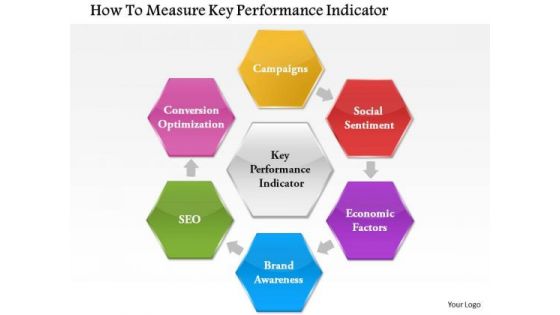
Business Framework How To Measure Key Performance Indicator PowerPoint Presentation
This Power Point diagram slide has been crafted with graphic of flower petal diagram. This PPT slide contains the concept of measuring the key performance and indicate it. Use this PPT slide for your management related presentation.
Project Key Performance Indicator Tree Illustrating Customer Satisfaction Icons PDF
Persuade your audience using this project key performance indicator tree illustrating customer satisfaction icons pdf. This PPT design covers four stages, thus making it a great tool to use. It also caters to a variety of topics including total customer complaints, total customer notifications, customer satisfaction project. Download this PPT design now to present a convincing pitch that not only emphasizes the topic but also showcases your presentation skills.
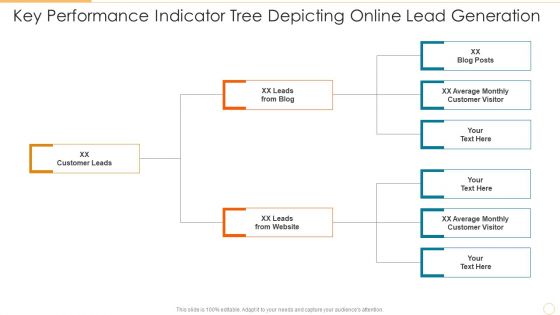
Key Performance Indicator Tree Depicting Online Lead Generation Information PDF
Persuade your audience using this key performance indicator tree depicting online lead generation information pdf. This PPT design covers three stages, thus making it a great tool to use. It also caters to a variety of topics including customer leads, leads from blog, leads from website. Download this PPT design now to present a convincing pitch that not only emphasizes the topic but also showcases your presentation skills.
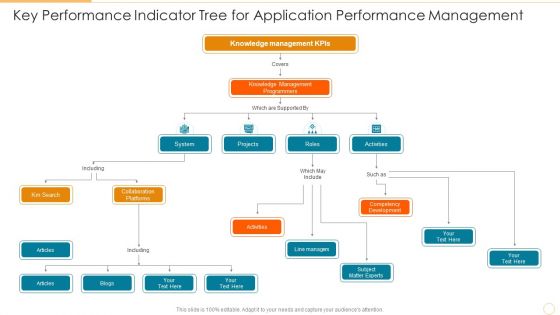
Key Performance Indicator Tree For Application Performance Management Background PDF
Persuade your audience using this key performance indicator tree for application performance management background pdf. This PPT design covers six stages, thus making it a great tool to use. It also caters to a variety of topics including collaboration platforms, competency development, knowledge management programmers. Download this PPT design now to present a convincing pitch that not only emphasizes the topic but also showcases your presentation skills.

Flowchart Indicating Monitoring Financial Transactions Process In Banks Pictures PDF
This slide depicts transaction monitoring stages in AML anti money laundering It provides information about source, analysis, insight, action, report, analyzing, financial transaction, etc.Persuade your audience using this Flowchart Indicating Monitoring Financial Transactions Process In Banks Pictures PDF. This PPT design covers one stage, thus making it a great tool to use. It also caters to a variety of topics including Payment Matching Process, Cancelled Payment, Cancelled Payment. Download this PPT design now to present a convincing pitch that not only emphasizes the topic but also showcases your presentation skills.
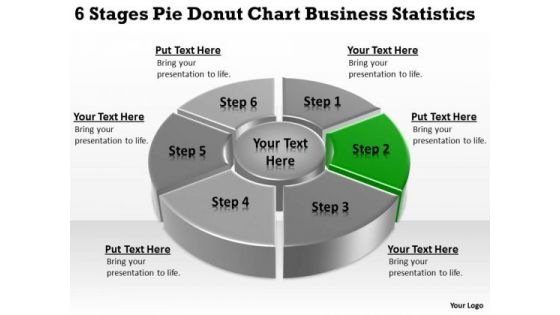
Templates Download Statistics Business Plan For Small PowerPoint Slides
We present our templates download statistics business plan for small PowerPoint Slides.Download our Process and Flows PowerPoint Templates because Our PowerPoint Templates and Slides will give you great value for your money. Be assured of finding the best projection to highlight your words. Present our Circle Charts PowerPoint Templates because You should Press the right buttons with our PowerPoint Templates and Slides. They will take your ideas down the perfect channel. Download our Shapes PowerPoint Templates because It will get your audience in sync. Download our Business PowerPoint Templates because You will get more than you ever bargained for. Download and present our Marketing PowerPoint Templates because Our PowerPoint Templates and Slides are focused like a searchlight beam. They highlight your ideas for your target audience.Use these PowerPoint slides for presentations relating to Infographic, graph, chart, data, icon, diagram, progress, bar, line, download, button, pie, search, time, statistics, percent, segment, cloud, business, concept, sign,loading, symbol, template, circle, graphic, full, element, report, level, black, shape, computer, modern, status, visualization, round, section, web,design, statistics, growth, colorful, info, stats, information, indicator. The prominent colors used in the PowerPoint template are Green, Gray, Black.

Stages Circularly Placed Forming Process Flow Diagram PowerPoint Slides
We present our stages circularly placed forming process Flow Diagram PowerPoint Slides.Download our Arrows PowerPoint Templates because they are the indicators of the path you have in mind. Download and present our Process and Flows PowerPoint Templates because this template helps you to bring your audiences to the table. Download and present our Business PowerPoint Templates because your ideas too are pinpointedly focused on you goals. Present our Shapes PowerPoint Templates because this is An innovative slide design depicting driving home the relevance of a steady rhythm. Use our Circle Charts PowerPoint Templates because it Creates a winner with your passion and dream.Use these PowerPoint slides for presentations relating to Arrow, Business, Chart, Circle, Design, Diagram, Direction, Document, Market, Marketing, Multiple, Navigation, Network, Options, Plan, Presentation, Process, Results, Shiny, Sphere, Statistics, Structure, Template, Three, Vector, Website, Wheel. The prominent colors used in the PowerPoint template are Blue light, White, Gray. People tell us our stages circularly placed forming process Flow Diagram PowerPoint Slides are Striking. People tell us our Diagram PowerPoint templates and PPT Slides are Pretty. The feedback we get is that our stages circularly placed forming process Flow Diagram PowerPoint Slides are Ritzy. Presenters tell us our Design PowerPoint templates and PPT Slides are Fabulous. Customers tell us our stages circularly placed forming process Flow Diagram PowerPoint Slides are designed by professionals The feedback we get is that our Document PowerPoint templates and PPT Slides are Reminiscent.
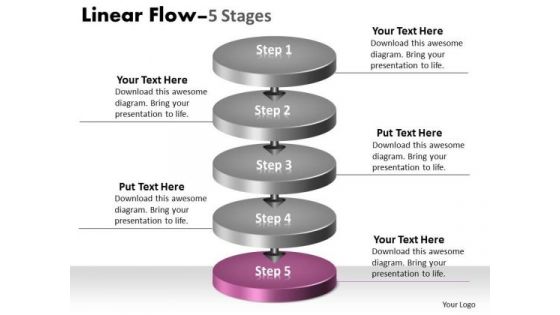
Ppt Background 3d Illustration Of 5 Phase Diagram Partnership Transaction 6 Image
We present our PPT Background 3d illustration of 5 phase diagram partnership transaction 6 Image. Use our Arrows PowerPoint Templates because, It is a step by step process with levels rising at every stage. Use our Circle Charts PowerPoint Templates because, You have it all down to a T. Use our Shapes PowerPoint Templates because, Illustrate your ideas and imprint them in the minds of your team with this template. Use our Business PowerPoint Templates because; Break it all down to Key Result Areas. Use our Process and Flows PowerPoint Templates because, they are indicators of the path you have in mind. Use these PowerPoint slides for presentations relating to background, blog, business, chain, communication, connection, constructive, contact, design, diagonal, dialog, digital, flow, global, interaction, internet, line, linear, network, partner, pointer, reaction, social, stream, structure, system, team,. The prominent colors used in the PowerPoint template are Pink, Gray, and Black

 Home
Home