Gauge Chart
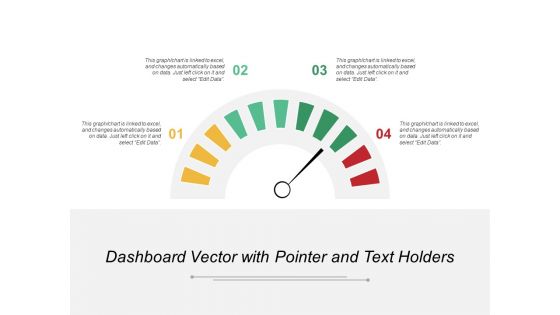
Dashboard Vector With Pointer And Text Holders Ppt PowerPoint Presentation Portfolio Format Ideas
This is a dashboard vector with pointer and text holders ppt powerpoint presentation portfolio format ideas. This is a four stage process. The stages in this process are performance dashboard, performance meter, performance kpi.
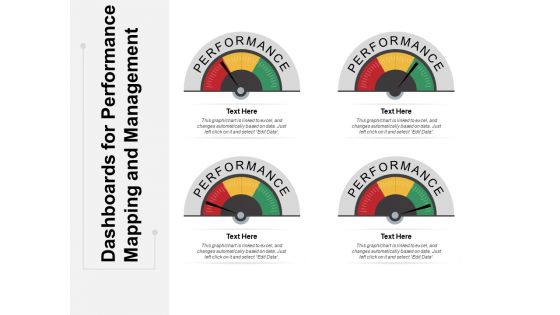
Dashboards For Performance Mapping And Management Ppt PowerPoint Presentation Ideas File Formats
This is a dashboards for performance mapping and management ppt powerpoint presentation ideas file formats. This is a four stage process. The stages in this process are performance dashboard, performance meter, performance kpi.

KPI Dashboards And Operational Metrics Ppt PowerPoint Presentation Portfolio Infographics
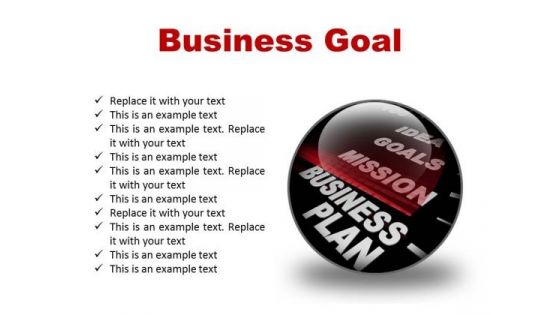
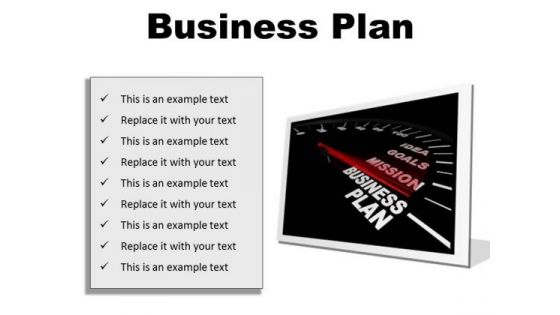
Business Plan Future PowerPoint Presentation Slides C
Microsoft Powerpoint Slides and Backgrounds with a speedometer needle speeds past the various stages of getting a job the resume the interview and success
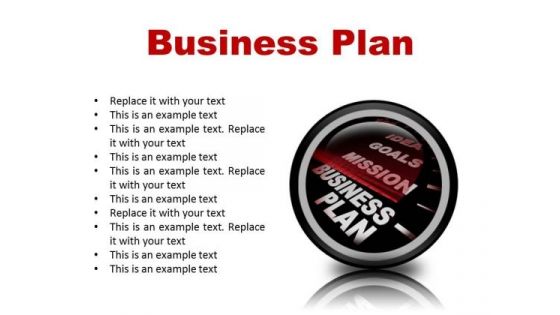
Business Plan Future PowerPoint Presentation Slides Cc
Microsoft Powerpoint Slides and Backgrounds with a speedometer needle speeds past the various stages of getting a job the resume the interview and success
Business Plan Future PowerPoint Presentation Slides F
Microsoft Powerpoint Slides and Backgrounds with a speedometer needle speeds past the various stages of getting a job the resume the interview and success
Business Plan Future PowerPoint Presentation Slides R
Microsoft Powerpoint Slides and Backgrounds with a speedometer needle speeds past the various stages of getting a job the resume the interview and success
Business Plan Future PowerPoint Presentation Slides S
Microsoft Powerpoint Slides and Backgrounds with a speedometer needle speeds past the various stages of getting a job the resume the interview and success
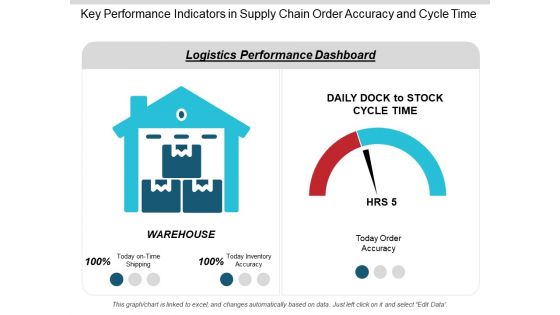
Key Performance Indicators In Supply Chain Order Accuracy And Cycle Time Ppt PowerPoint Presentation Infographics Slideshow
This is a key performance indicators in supply chain order accuracy and cycle time ppt powerpoint presentation infographics slideshow. This is a two stage process. The stages in this process are logistics performance, logistics dashboard, logistics kpis.
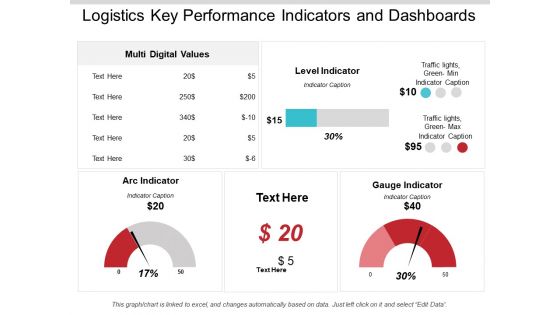
Logistics Key Performance Indicators And Dashboards Ppt PowerPoint Presentation Infographics Background Image
This is a logistics key performance indicators and dashboards ppt powerpoint presentation infographics background image. This is a three stage process. The stages in this process are logistics performance, logistics dashboard, logistics kpis.

Competitor Analysis Ppt PowerPoint Presentation Slides Visuals
This is a competitor analysis ppt powerpoint presentation slides visuals. This is a four stage process. The stages in this process are sales development, revenue, sales, performance, indicators.
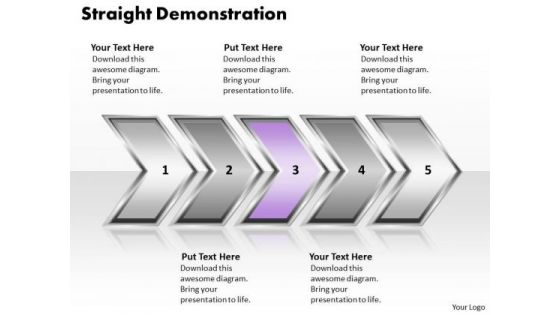
Ppt Straight Demonstration Of Process Using Circular Arrows PowerPoint 2010 Templates
PPT straight demonstration of process using circular arrows powerpoint 2010 Templates-Analyze the six success factors of your business with this linear business chart for Microsoft PowerPoint presentations. This diagram helps you to analyze all the connected ideas and also can be used to show six aspects of an issue. It is a useful captivating tool enables you to define your message in your Marketing PPT presentations. You can apply other 3D Styles and shapes to the slide to enhance your presentations.-PPT straight demonstration of process using circular arrows powerpoint 2010 Templates-Aim, Arrow, Arrowheads, Badge, Border, Click, Connection, Curve, Design, Direction, Download, Element, Fuchsia, Icon, Illustration, Indicator, Internet, Magenta, Mark, Object, Orientation, Pointer, Shadow, Shape, Sign
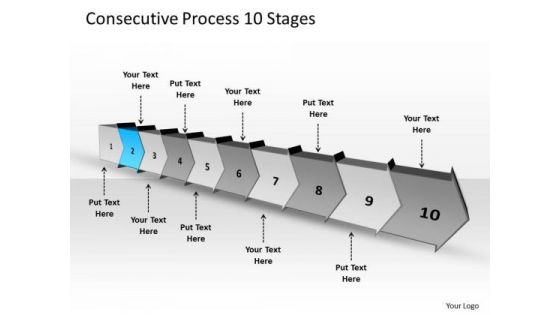
Consecutive Process 10 Stages Creating Flowchart PowerPoint Templates
We present our consecutive process 10 stages creating flowchart PowerPoint templates. Use our Arrows PowerPoint Templates because; you have the ideas to develop the teams vision of where they need to be in the future. Use our Business PowerPoint Templates because, you have played a stellar role and have a few ideas. Use our Shapes PowerPoint Templates because, prove how they mesh to motivate the company team and provide the steam to activate the composite machine. Use our Finance PowerPoint Templates because, our presentation designs are for those on the go. Use our Process and Flows PowerPoint Templates because, they are indicators of the path you have in mind. Use these PowerPoint slides for presentations relating to abstract arrow blank business chart circular circulation concept conceptual consecutive design diagram executive flow icon idea illustration management model numbers organization procedure process. The prominent colors used in the PowerPoint template are Blue, Gray, and Black

Market Assessment Ppt PowerPoint Presentation Model
This is a market assessment ppt powerpoint presentation model. This is a five stage process. The stages in this process are forecasting of sales volume, specification of new product development, target market, indication of product positioning.

Market Assessment Ppt PowerPoint Presentation Files
This is a market assessment ppt powerpoint presentation files. This is a five stage process. The stages in this process are target market, forecasting of sales volume, indication of product positioning, competitor reaction, specification of new product development.
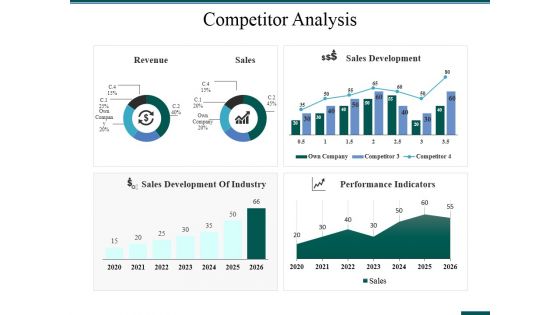
Competitor Analysis Ppt PowerPoint Presentation Model Visual Aids
This is a competitor analysis ppt powerpoint presentation model visual aids. This is a four stage process. The stages in this process are competitor analysis, revenue, sales, sales development, performance indicators.
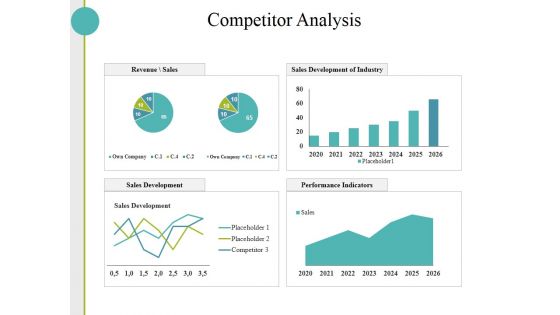
Competitor Analysis Ppt PowerPoint Presentation Layouts Slides
This is a competitor analysis ppt powerpoint presentation layouts slides. This is a four stage process. The stages in this process are sales development, performance indicators, sales development of industry, revenue sales.
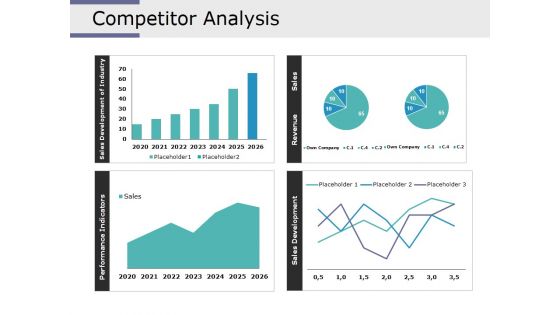
Competitor Analysis Ppt PowerPoint Presentation Model Show
This is a competitor analysis ppt powerpoint presentation model show. This is a four stage process. The stages in this process are performance indicators, sales development of industry, sales development, revenue, sales.

Competitor Analysis Ppt PowerPoint Presentation Samples
This is a competitor analysis ppt powerpoint presentation samples. This is a four stage process. The stages in this process are sales development of industry, performance indicators, sales development, sales.

Competitor Analysis Ppt PowerPoint Presentation Outline Ideas
This is a competitor analysis ppt powerpoint presentation outline ideas. This is a four stage process. The stages in this process are sales development of industry, revenue, sales, performance indicators.
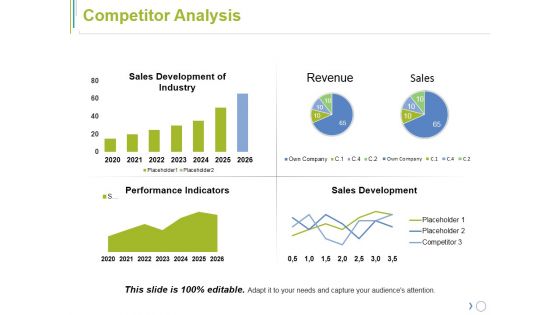
Competitor Analysis Ppt PowerPoint Presentation File Mockup
This is a competitor analysis ppt powerpoint presentation file mockup. This is a four stage process. The stages in this process are sales development of industry, revenue, performance indicators, sales development.

Competitor Analysis Ppt PowerPoint Presentation Layouts Slideshow
This is a competitor analysis ppt powerpoint presentation layouts slideshow. This is a four stage process. The stages in this process are sales development of industry, performance indicators, sales development, revenue, sales.
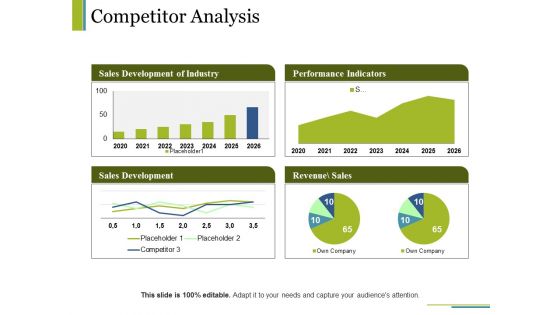
Competitor Analysis Ppt PowerPoint Presentation Visual Aids Model
This is a competitor analysis ppt powerpoint presentation visual aids model. This is a four stage process. The stages in this process are sales development of industry, performance indicators, sales development, revenue sales, business.
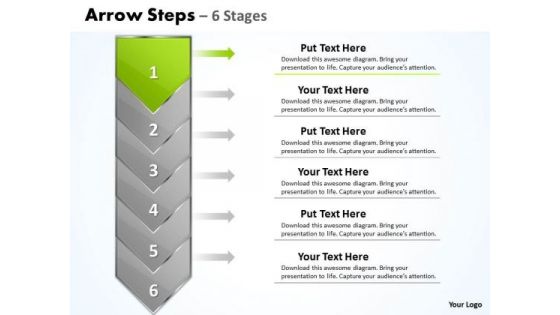
Process PowerPoint Template Arrow 6 Stages 1 Communication Skills Design
We present our process PowerPoint template arrow 6 stages 1 communication skills design. Use our Abstract PowerPoint Templates because; now imprint them on the minds of your audience via our slides. Use our Symbol PowerPoint Templates because, Its also been said that prevention is better than cure, either way you have a store of knowledge for sure. Use our Arrows PowerPoint Templates because, aesthetically designed to make a great first impression this template highlights. Use our Business PowerPoint Templates because, they are indicators of the path you have in mind. Use our Process and Flows PowerPoint Templates because, Brainstorming Light Bulbs: - The atmosphere in the workplace is electric. Use these PowerPoint slides for presentations relating to Arrow, Background, Business, Chart, Diagram, Financial, Graphic, Gray, Icon, Illustration, Management, Orange, Perspective, Planning, Process, Process, Stages, Steps, Text. The prominent colors used in the PowerPoint template are Green, Gray, and Black
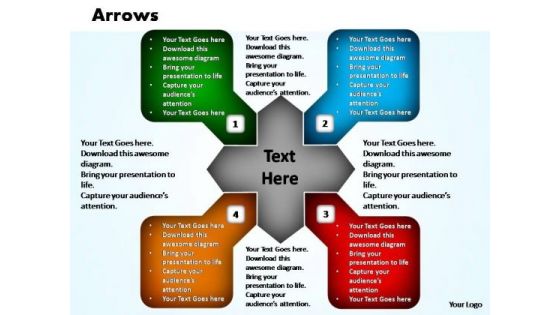
PowerPoint Templates Business Arrows Ppt Slides
PowerPoint Templates Business Arrows PPT Slides-The arrows indicate the progression of the process. Constant monitoring of the processes provides you with opportunities to concentrate on the core competencies in your business and improve the standards for more effective results.-PowerPoint Templates Business Arrows PPT Slides
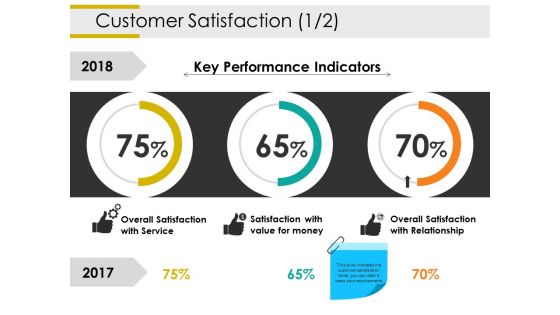
Customer Satisfaction Template 1 Ppt PowerPoint Presentation Portfolio Graphics Example
This is a customer satisfaction template 1 ppt powerpoint presentation portfolio graphics example. This is a three stage process. The stages in this process are overall satisfaction with service, satisfaction with value for money, overall satisfaction with relationship, key performance indicators, business, percentage.
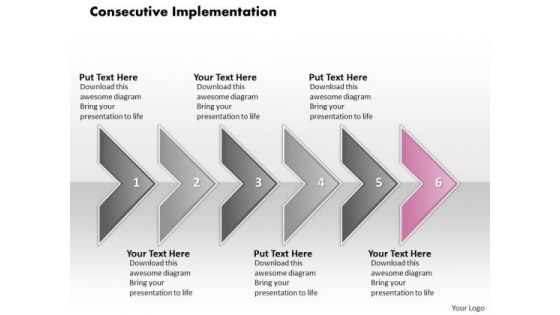
Ppt Consecutive Implementation Of 6 Concepts Through Arrows PowerPoint 2010 Templates
PPT consecutive implementation of 6 concepts through arrows powerpoint 2010 Templates-This arrow diagram is built for presenting different ways for a single process. This power point diagram consists of 6 arrows. Continuous and ongoing process can be shown using this PPT Template.-PPT consecutive implementation of 6 concepts through arrows powerpoint 2010 Templates-Aim, Arrow, Badge, Border, Color, Connection, Curve, Design, Direction, Download, Icon, Illustration, Indicator, Internet, Label, Link, Magenta, Mark, Next, Object, Orientation, Paper, Peeling, Pointer, Rounded, Set, Shadow, Shape, Sign
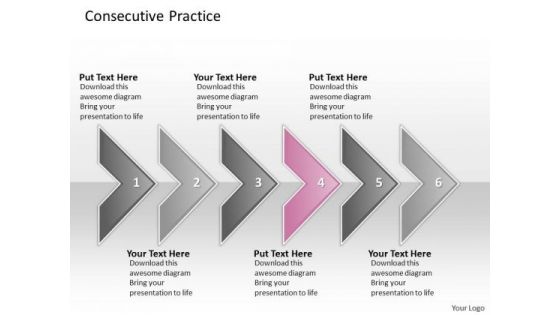
Ppt Consecutive Practice Of 6 Concepts Through Circular Arrows PowerPoint 2010 Templates
PPT consecutive practice of 6 concepts through circular arrows powerpoint 2010 Templates-This arrow diagram is built for presenting different ways for a single process. This power point diagram consists of 6 arrows. Continuous and ongoing process can be shown using this PPT Template.-PPT consecutive practice of 6 concepts through circular arrows powerpoint 2010 Templates-Aim, Arrow, Badge, Border, Color, Connection, Curve, Design, Direction, Download, Icon, Illustration, Indicator, Internet, Label, Link, Magenta, Mark, Next, Object, Orientation, Paper, Peeling, Pointer, Rounded, Set, Shadow, Shape, Sign

Ppt Consecutive Effect Of 6 Concepts Through Arrows PowerPoint Templates
PPT consecutive effect of 6 concepts through arrows powerpoint templates-This diagram organizes, represents and summarizes information so that patterns and relationships can be identified. It aims to inform, influence or convince an audience. Add charm and personality to your presentations with our attractive PPT design-PPT consecutive effect of 6 concepts through arrows powerpoint templates-Aim, Arrow, Badge, Border, Color, Connection, Curve, Design, Direction, Download, Icon, Illustration, Indicator, Internet, Label, Link, Magenta, Mark, Next, Object, Orientation, Paper, Peeling, Pointer, Rounded, Set, Shadow, Shape, Sign
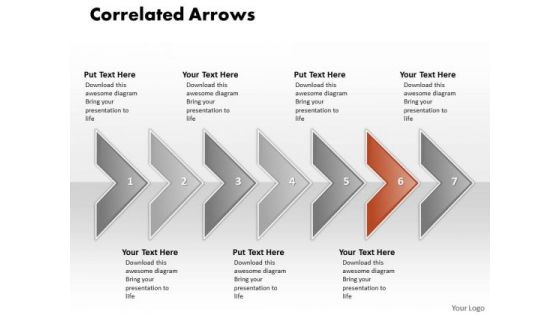
Ppt 7 Phase Diagram Correlated Arrows In Horizontal Line PowerPoint Templates
PPT 7 phase diagram correlated arrows in horizontal line PowerPoint Templates-The above template contains a graphic of seven arrows in straight line. This image signifies the concept of correlated activities. Adjust the above image in your PPT presentations to visually support your content in your PPT slideshows related to Market surveys, Statistics and Analysis. Create captivating presentations to deliver comparative facts and figures.-PPT 7 phase diagram correlated arrows in horizontal line PowerPoint Templates-Aim, Arrow, Badge, Border, Color, Connection, Curve, Design, Direction, Download, Icon, Illustration, Indicator, Internet, Label, Link, Magenta, Mark, Next, Object, Orientation, Paper, Peeling, Pointer, Rounded, Set, Shadow, Shape, Sign
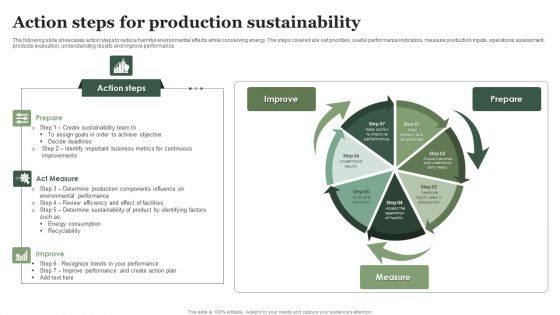
Action Steps For Production Sustainability Ppt Pictures Tips PDF
The following slide showcases action steps to reduce harmful environmental effects while conserving energy. The steps covered are set priorities, useful performance indicators, measure production inputs, operations assessment, products evaluation, understanding results and improve performance. Presenting Action Steps For Production Sustainability Ppt Pictures Tips PDF to dispense important information. This template comprises three stages. It also presents valuable insights into the topics including Action Steps, Act Measure, Improve. This is a completely customizable PowerPoint theme that can be put to use immediately. So, download it and address the topic impactfully.

Ppt Consecutive Execution Of 6 Concepts Through Curved Arrows PowerPoint 2010 Templates
PPT consecutive execution of 6 concepts through curved arrows powerpoint 2010 Templates-The above template displays a diagram of curved arrows. This Diagram is mainly used to depict the progress of sequential steps in the flow or process. It is a powerful tool conceived to enable you to define your message more clearly in your PPT presentations. -PPT consecutive execution of 6 concepts through curved arrows powerpoint 2010 Templates-Aim, Arrow, Badge, Border, Color, Connection, Curve, Design, Direction, Download, Icon, Illustration, Indicator, Internet, Label, Link, Magenta, Mark, Next, Object, Orientation, Paper, Peeling, Pointer, Rounded, Set, Shadow, Shape, Sign

Ppt Consecutive Explanation Of 5 Steps Through Arrows PowerPoint 2010 Templates
PPT consecutive explanation of 5 steps through arrows powerpoint 2010 Templates-This is a type of diagram that represents an algorithm or process, showing the steps as circles. Arrows Indicates the way to growth. Use this diagram for improved controls to drive your business towards the right direction.-PPT consecutive explanation of 5 steps through arrows powerpoint 2010 Templates-3d, Abstract, Arrow, Circle, Circular, Click, Computer, Data, Direction, Graphic, Icon, Illustration, Insignia, Intention, Internet, Isolated, Label, Mail, Mascot, Media, Menu, Motion, Page, Pushing, Search, Shiny, Sign, Simple, Symbol

Ppt Straight Explanation To Represent Seven Steps In Process PowerPoint Templates
PPT straight explanation to represent seven steps in process PowerPoint Templates-Develop competitive advantage with our above Diagram which contains a diagram of horizontal arrows. These arrows are indicators of the path you have in mind. Use them to help you organize the logic of your views-PPT straight explanation to represent seven steps in process PowerPoint Templates-above, aiming, arrow, arrowhead, balance, communicate, communication, connection, descriptive, design, designer, direct, direction, dynamic, element, graphic, high, icon, illustration, inform, internet, journey, multimedia, pointer, reflection, set, shape, sign, signal, straight, symbol, top, transportation, travel, vector
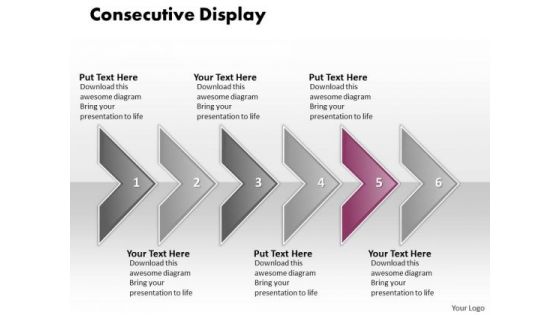
Ppt Consecutive Display Of 6 Concepts Through Curved Arrows PowerPoint 2010 Templates
PPT consecutive display of 6 concepts through curved arrows powerpoint 2010 Templates-This diagram is used to organize information so that it can be accessed more easily. It consists of consecutive arrows. You should understand your target audience and enhance presentations to create the wow effect to your visual delivery.-PPT consecutive display of 6 concepts through curved arrows powerpoint 2010 Templates-Aim, Arrow, Badge, Border, Color, Connection, Curve, Design, Direction, Download, Icon, Illustration, Indicator, Internet, Label, Link, Magenta, Mark, Next, Object, Orientation, Paper, Peeling, Pointer, Rounded, Set, Shadow, Shape, Sign
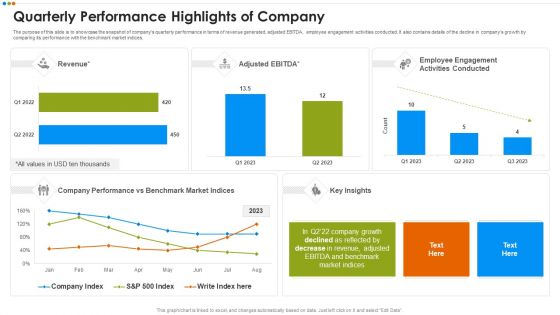
Quarterly Budget Analysis Of Business Organization Quarterly Performance Highlights Of Company Graphics PDF
The purpose of this slide is to showcase the snapshot of companys quarterly performance in terms of revenue generated, adjusted EBITDA, employee engagement activities conducted. It also contains details of the decline in companys growth by comparing its performance with the benchmark market indices.This is a Quarterly Budget Analysis Of Business Organization Quarterly Performance Highlights Of Company Graphics PDF template with various stages. Focus and dispense information on two stages using this creative set, that comes with editable features. It contains large content boxes to add your information on topics like Quarterly Performance Highlights Of Company You can also showcase facts, figures, and other relevant content using this PPT layout. Grab it now.

Industry 4 0 Readiness Assessment For Food Manufacturing Sector Portrait PDF
This slide indicates the industry 4.0 readiness assessment for food manufacturing sector. It also provides the information regarding the food value chain segments, key drivers along with industry 4.0 impact and ease of implementation. Coming up with a presentation necessitates that the majority of the effort goes into the content and the message you intend to convey. The visuals of a PowerPoint presentation can only be effective if it supplements and supports the story that is being told. Keeping this in mind our experts created Industry 4 0 Readiness Assessment For Food Manufacturing Sector Portrait PDF to reduce the time that goes into designing the presentation. This way, you can concentrate on the message while our designers take care of providing you with the right template for the situation.

Projected Key Financials Template Ppt PowerPoint Presentation Styles Graphics Design
This is a projected key financials template ppt powerpoint presentation styles graphics design. This is a four stage process. The stages in this process are sales, gross profit, net profit.

Series Of Actions To Achieve Result 6 Stages Business Plan Program PowerPoint Templates
We present our series of actions to achieve result 6 stages business plan program PowerPoint templates.Use our Process and Flows PowerPoint Templates because they enhance the essence of your viable ideas. Download and present our Arrows PowerPoint Templates because they will help you to organise the logic of your views. Use our Shapes PowerPoint Templates because the Gear train is a basic element of living and daily business. Present our Business PowerPoint Templates because project your ideas to you colleagues and complete the full picture. Download our Signs PowerPoint Templates because you have played a stellar role and have a few ideas.Use these PowerPoint slides for presentations relating to Arrows, cold, design, diagram, directional, drop, element, fahrenheit, flow, gauge, graph, graphic, green, heat, hot, icon, illustration, info graphic, orange, pointer, process, progress, red, segments, set, shadow, steps. The prominent colors used in the PowerPoint template are Blue, White, Gray. People tell us our series of actions to achieve result 6 stages business plan program PowerPoint templates will make the presenter successul in his career/life. You can be sure our drop PowerPoint templates and PPT Slides are Lush. People tell us our series of actions to achieve result 6 stages business plan program PowerPoint templates are Whimsical. PowerPoint presentation experts tell us our element PowerPoint templates and PPT Slides help you meet deadlines which are an element of today's workplace. Just browse and pick the slides that appeal to your intuitive senses. You can be sure our series of actions to achieve result 6 stages business plan program PowerPoint templates are Colorful. People tell us our drop PowerPoint templates and PPT Slides are Detailed.
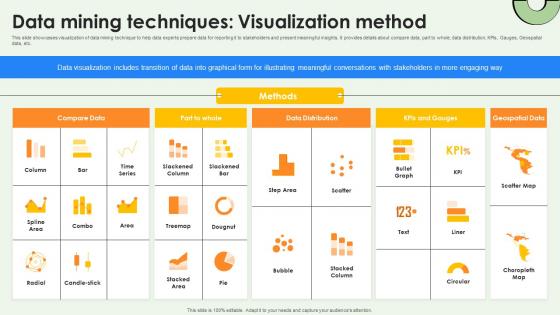
Data Warehousing And Data Mining Techniques Visualization Method AI SS V
This slide showcases visualization of data mining technique to help data experts prepare data for reporting it to stakeholders and present meaningful insights. It provides details about compare data, part to whole, data distribution, KPIs, Gauges, Geospatial data, etc. Find a pre-designed and impeccable Data Warehousing And Data Mining Techniques Visualization Method AI SS V. The templates can ace your presentation without additional effort. You can download these easy-to-edit presentation templates to make your presentation stand out from others. So, what are you waiting for Download the template from Slidegeeks today and give a unique touch to your presentation.
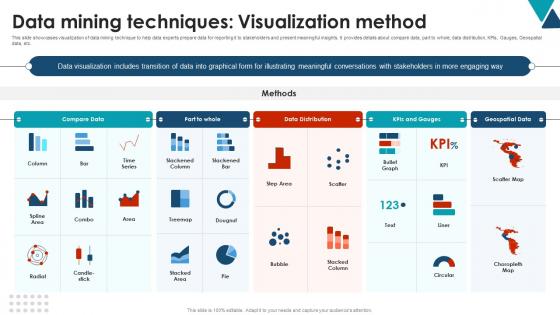
Data Mining Techniques Visualization Method Using Data Mining Tools To Optimize Processes AI SS V
This slide showcases visualization of data mining technique to help data experts prepare data for reporting it to stakeholders and present meaningful insights. It provides details about compare data, part to whole, data distribution, KPIs, Gauges, Geospatial data, etc. Here you can discover an assortment of the finest PowerPoint and Google Slides templates. With these templates, you can create presentations for a variety of purposes while simultaneously providing your audience with an eye-catching visual experience. Download Data Mining Techniques Visualization Method Using Data Mining Tools To Optimize Processes AI SS V to deliver an impeccable presentation. These templates will make your job of preparing presentations much quicker, yet still, maintain a high level of quality. Slidegeeks has experienced researchers who prepare these templates and write high-quality content for you. Later on, you can personalize the content by editing the Data Mining Techniques Visualization Method Using Data Mining Tools To Optimize Processes AI SS V.

Business Plan Speedometer Future PowerPoint Template 1110
A speedometer with needle pointing to the words Business Plan

Speedometer Diagram For Growth Analysis Powerpoint Template

Business Framework PowerPoint Speedometer PowerPoint Presentation
This image slide displays speedometer diagram with download and upload speed template. This innovative image slide has been designed to depict progress. This image slide is 100% editable. You may change color, size and orientation of any icon to your liking. This image slide may be used in school, business and social presentations. Create amazing presentations using this image slide.
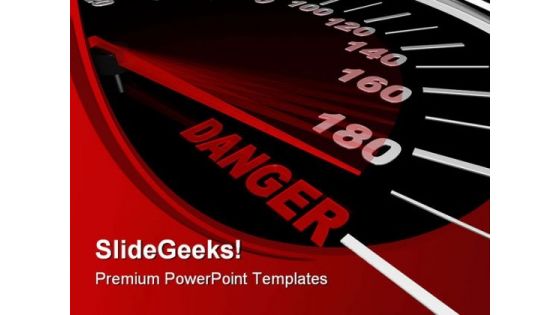
Speedometer Shows Danger Travel PowerPoint Themes And PowerPoint Slides 0411
Microsoft PowerPoint Theme and Slide with danger word on speedometer

Speedometer Shows Win Metaphor PowerPoint Themes And PowerPoint Slides 0811
Microsoft PowerPoint Theme and Slide with a speedometer with red needle speeding to the word win

Smart Meter Working To Analyse Consumption Internet Of Things Solutions To Enhance Energy IoT SS V
This slide includes smart meters that measure and transmit energy consumption data for efficient monitoring. It includes steps such as collection of data, transmission of data, consumption pattern analysis, and monitoring. Slidegeeks has constructed Smart Meter Working To Analyse Consumption Internet Of Things Solutions To Enhance Energy IoT SS V after conducting extensive research and examination. These presentation templates are constantly being generated and modified based on user preferences and critiques from editors. Here, you will find the most attractive templates for a range of purposes while taking into account ratings and remarks from users regarding the content. This is an excellent jumping-off point to explore our content and will give new users an insight into our top-notch PowerPoint Templates.

Revenue Performance Reporting Speedometer Ppt PowerPoint Presentation Visuals
This is a revenue performance reporting speedometer ppt powerpoint presentation visuals. This is a four stage process. The stages in this process are speedometer, measurement, business, marketing, finance.
Speedometer Vector Icon Ppt Powerpoint Presentation Gallery Objects
This is a speedometer vector icon ppt powerpoint presentation gallery objects. This is a four stage process. The stages in this process are accelerator, seed accelerators, startup accelerator.
Analytics Icon Dashboard Speedometer Ppt PowerPoint Presentation Complete Deck
Presenting this set of slides with name analytics icon dashboard speedometer ppt powerpoint presentation complete deck. The topics discussed in these slides are dashboard, speedometer, key performance, business, automobile. This is a completely editable PowerPoint presentation and is available for immediate download. Download now and impress your audience.
Speedometer Performance Indicator Vector Icon Ppt PowerPoint Presentation Show Deck PDF
Presenting this set of slides with name speedometer performance indicator vector icon ppt powerpoint presentation show deck pdf. This is a three stage process. The stages in this process are speedometer performance indicator vector icon. This is a completely editable PowerPoint presentation and is available for immediate download. Download now and impress your audience.

Electronic Indicator Device Speedometer Ppt PowerPoint Presentation Complete Deck With Slides
If designing a presentation takes a lot of your time and resources and you are looking for a better alternative, then this electronic indicator device speedometer ppt powerpoint presentation complete deck with slides is the right fit for you. This is a prefabricated set that can help you deliver a great presentation on the topic. All the twelve slides included in this sample template can be used to present a birds-eye view of the topic. These slides are also fully editable, giving you enough freedom to add specific details to make this layout more suited to your business setting. Apart from the content, all other elements like color, design, theme are also replaceable and editable. This helps in designing a variety of presentations with a single layout. Not only this, you can use this PPT design in formats like PDF, PNG, and JPG once downloaded. Therefore, without any further ado, download and utilize this sample presentation as per your liking.
Risk Meter Indicating Extreme Level Ppt PowerPoint Presentation Icon Template
This is a risk meter indicating extreme level ppt powerpoint presentation icon template. This is a five stage process. The stages in this process are risk meter, risk speedometer, hazard meter.
Business Plan03 PowerPoint Icon C
A speedometer with needle pointing to the words Business Plan
Business Plan03 PowerPoint Icon Cc
A speedometer with needle pointing to the words Business Plan
Business Plan03 PowerPoint Icon S
A speedometer with needle pointing to the words Business Plan

Speedometer Slow To Fast Travel PowerPoint Themes And PowerPoint Slides 0911
Microsoft PowerPoint Theme and Slide with a speedometer with needle racing to the words

Fast Word On Speedometer Travel PowerPoint Themes And PowerPoint Slides 0511
Microsoft PowerPoint Theme and Slide with The word fast on a speedometer with red needle pointing to it
Vehicle Dashboard With Speedometer Vector Icon Ppt PowerPoint Presentation Portfolio Graphics PDF
Presenting vehicle dashboard with speedometer vector icon ppt powerpoint presentation portfolio graphics pdf to dispense important information. This template comprises three stages. It also presents valuable insights into the topics including vehicle dashboard with speedometer vector icon. This is a completely customizable PowerPoint theme that can be put to use immediately. So, download it and address the topic impactfully.
Speedometer On Human Hand Vector Icon Ppt PowerPoint Presentation Outline Icons PDF
Presenting this set of slides with name speedometer on human hand vector icon ppt powerpoint presentation outline icons pdf. This is a three stage process. The stages in this process are speedometer on human hand vector icon. This is a completely editable PowerPoint presentation and is available for immediate download. Download now and impress your audience.

 Home
Home