Gauge Chart

Digital Transformation Purpose And Key Performance Indicators Formats PDF
The slide shows a pie chart presenting objectives of conducting digital advancement in organization with KPIs. It includes KPIs like user satisfaction, economic, productive, trader control metrics, risk metrics, saving goals and advancements. Pitch your topic with ease and precision using this Digital Transformation Purpose And Key Performance Indicators Formats PDF. This layout presents information on Key Performance Indicators, Digital Transformation, Minimize Costs. It is also available for immediate download and adjustment. So, changes can be made in the color, design, graphics or any other component to create a unique layout.
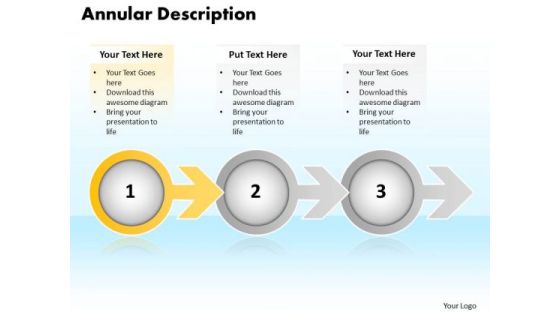
Ppt Annular Description Of 3 State Diagram Using Arrow PowerPoint Templates
PPT annular description of 3 state diagram using arrow PowerPoint Templates-This PowerPoint diagram shows three circles connected with arrows. Circles defines path functions and arrows indicate the progression of the process-PPT annular description of 3 state diagram using arrow PowerPoint Templates-3d, Arrow, Bevel, Blue, Boy, Bright, Circular, Concept, Design, Fancy, Funky, Graphic, Icon, Illustration, Isolated, Logo, Male, Man, Reflection, Shinning, Sign, Symbol, Vivid

Business Strategic Plan Template Ppt PowerPoint Presentation Pictures Inspiration
Presenting this set of slides with name business strategic plan template ppt powerpoint presentation pictures inspiration. This is a two stage process. The stages in this process are market development, process improvement, people development, product development, key objectives, key performance indicators, initiatives. This is a completely editable PowerPoint presentation and is available for immediate download. Download now and impress your audience.
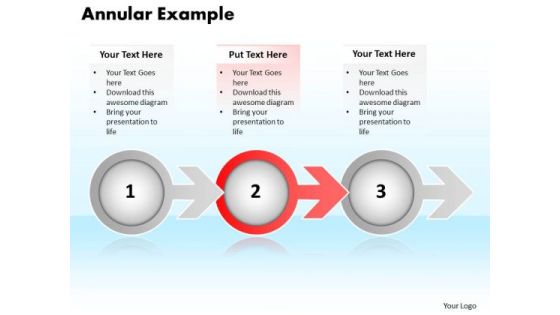
Ppt Annular Example Of 3 Stages Using Arrow PowerPoint Templates
PPT annular example of 3 stages using arrow PowerPoint Templates-This PowerPoint diagram shows three circles connected with arrows. Circles defines path functions and arrows indicate the progression of the process-PPT annular example of 3 stages using arrow PowerPoint Templates-3d, Arrow, Bevel, Blue, Boy, Bright, Circular, Concept, Design, Fancy, Funky, Graphic, Icon, Illustration, Isolated, Logo, Male, Man, Reflection, Shinning, Sign, Symbol, Vivid

Business Framework Business Communication Plan PowerPoint Presentation
Explain the importance of business communication plan with this power point diagram slide. To display BCP we have used graphic of plan. This image indicate the internal and external communication points for any business. Use this image for business communication related topics and build innovative presentations for your clients.

Business Analyst Key Skills Diagram Powerpoint Ideas
This is a business analyst key skills diagram powerpoint ideas. This is a four stage process. The stages in this process are business analysis role skills and abilities, business analysis role, personal underlying competencies and characteristics, techniques and tools experiences and skills, data and process modelling, requirements workshops, prototyping, interviewing, metrics and key performance indicators, vendor and software assessment.

Ppt Annular Illustration Of 3 State PowerPoint Template Diagram Using Arrow Templates
PPT annular illustration of 3 state powerpoint template diagram using arrow Templates-This PowerPoint diagram shows three circles connected with arrows. Circles defines path functions and arrows indicate the progression of the process-PPT annular illustration of 3 state powerpoint template diagram using arrow Templates-3d, Arrow, Bevel, Blue, Boy, Bright, Circular, Concept, Design, Fancy, Funky, Graphic, Icon, Illustration, Isolated, Logo, Male, Man, Reflection, Shinning, Sign, Symbol, Vivid

Ppt Annular Demonstration Of 3 Power Point Stage Using Arrow PowerPoint Templates
PPT annular demonstration of 3 power point stage using arrow PowerPoint Templates-This PowerPoint diagram shows three circles connected with arrows. Circles defines path functions and arrows indicate the progression of the process-PPT annular demonstration of 3 power point stage using arrow PowerPoint Templates-3d, Arrow, Bevel, Blue, Boy, Bright, Circular, Concept, Design, Fancy, Funky, Graphic, Icon, Illustration, Isolated, Logo, Male, Man, Reflection, Shinning, Sign, Symbol, Vivid
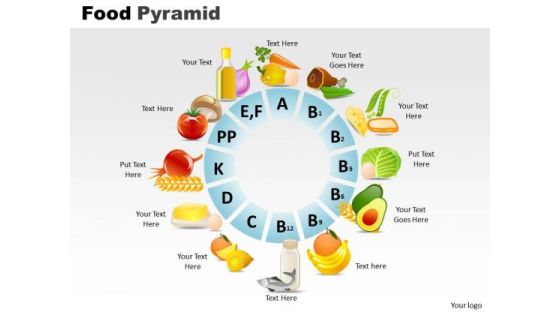
PowerPoint Slides Food Pyramid Editable Ppt Themes
PowerPoint Slides Food Pyramid Editable PPT Themes-A chart indicates various foods filling capacity and nutrition level in an amazing way to inspire people to adopt balance diet-Illustration, balanced, bar, bread, bun, butter, cake, calorie, calories, candy, carbohydrates, cereals, cheese, dairy, diet, egg, fats, fish, food, fresh, fruits, grains, guide, healthy, isolated, market, meat, nutritious, oil, outline, proteins, pyramid, shape, vector, vectors, vegetables-PowerPoint Slides Food Pyramid Editable PPT Themes

PowerPoint Templates Food Pyramid Growth Ppt Theme
PowerPoint Templates Food Pyramid Growth PPT Theme-This chart indicates various foods filling capacity and nutrition level in an amazing way to inspire people to adopt balance diet.-Illustration, balanced, bar, bread, bun, butter, cake, calorie, calories, candy, carbohydrates, cereals, cheese, dairy, diet, egg, fats, fish, food, fresh, fruits, grains, guide, healthy, isolated, market, meat, nutritious, oil, outline, proteins, pyramid, shape, vector, vectors, vegetables-PowerPoint Templates Food Pyramid Growth PPT Theme

Ppt Sequential Model Using Shapes Arrows PowerPoint Templates
PPT sequential model using shapes arrows powerpoint Templates-This Diagram with an image of Even arrows helps you chart the course of your presentation. Use it to show related information. They are indicators of the path you have in mind.-PPT sequential model using shapes arrows powerpoint Templates-action, arrow, badge, banner, blank, business, button, collection, colorful, concern, connect, decoration, design, direction, element, financial, flow, graph, instruction, involve, label, link, method, navigation, operate, procedure, process, relate, sequence, sequent, series, shape, stage, step, successive, technique

Ppt Half Circle PowerPoint 2010 Stage Through Bubbles 4 Steps Templates
PPT half circle powerpoint 2010 stage through bubbles 4 steps Templates-Use this Business based PowerPoint Diagram to represent the Business issues Graphically. It indicates arrange, block out, blueprint, cast, delineate, design, devise, draft, graph , lay out, outline, plot, project, shape, sketch etc.-PPT half circle powerpoint 2010 stage through bubbles 4 steps Templates-Add, Aqua, Arrows, Badges, Bar, Blend, Blue, Bright, Bubbles, Buttons, Caution, Circle, Drop, Elements, Glossy, Glowing, Graphic, Heart, Help, Icons, Idea, Illustration, Navigation, Oblong, Plus, Round, Service, Shadow, Shiny, Sign, Speech, Squares

Ppt Linear Flow Of Process Using 4 State PowerPoint Presentation Diagram Templates
PPT linear flow of process using 4 state powerpoint presentation diagram Templates-This templatehelps you chart the course of your presentation. The concept and strategy is your strength. Our template will help pinpoint their viability.-PPT linear flow of process using 4 state powerpoint presentation diagram Templates-Aim, Arrow, Arrowheads, Badge, Border, Click, Connection, Curve, Design, Direction, Download, Element, Fuchsia, Icon, Illustration, Indicator, Internet, Magenta, Mark, Object, Orientation, Pointer, Shadow, Shape, Sign
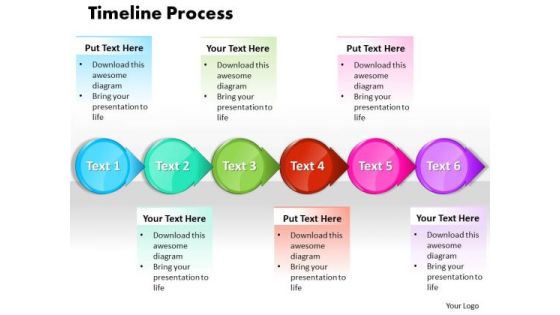
Ppt Steps Working With Slide Numbers A Process Timeline PowerPoint Templates
PPT steps working with slide numbers a process timeline PowerPoint Templates-This Business PowerPoint Diagram shows 3d linear abstraction to prevent Business losses. It uses six steps. It indicates employment, field, function, game, line, and livelihood. It is helpful to organize information. This PowerPoint slides are professionally animated. -PPT steps working with slide numbers a process timeline PowerPoint Templates-3d, Advertisement, Advertising, Arrow, Border, Business, Circles, Collection, Customer, Design, Element, Icon, Idea, Illustration, Info, Information, Isolated, Label, Light, Location, Needle, New, Notification, Notify, Point, Pointer, Promotion, Role, Rounded

Project Risk Assessment And Mitigation Planning Graphics PDF
This slide indicates the Risk likelihood and Impact assessment with optimal strategies to be undertaken in the four segmented events, listed below. It also depicts the solutions for variety of risk based problems premised upon risk probability and outcome.Persuade your audience using this Project Risk Assessment And Mitigation Planning Graphics PDF. This PPT design covers four stages, thus making it a great tool to use. It also caters to a variety of topics including Implementation Project, Risk, Mitigation Strategy. Download this PPT design now to present a convincing pitch that not only emphasizes the topic but also showcases your presentation skills.

Ppt Four Colorful Puzzles Forming Circle Showing Red PowerPoint Templates
PPT four colorful puzzles forming circle showing red powerpoint templates-This PowerPoint Diagram shows the text highlighted in Red segment explaining the concept in circular manner. It Indicates articulation, bit, compartment, cut, division, member, moiety, indirect, oblique, orbicular, ring-shaped, round, rounded, spheroid etc. -Can be used for presentations on action, active, art, artwork, backdrop, background, beauty, body, cartoon, color, curve, dance, decoration, design, drawing, element, emotion, enjoy, enjoyment, erotic, exaltation, expression, female, girl, gladness, graphic, health, human, illustration, isolated, joy, jump, leap, life, lifestyle, love, naked, nude, ornament, people, play, sensual, sexy, shape, silhouette, slender, slim, vector, woman, young-PPT four colorful puzzles forming circle showing red powerpoint templates

Ppt Four Colorful PowerPoint Background Puzzles Forming Circle Showing Yellow Templates
PPT four colorful powerpoint background puzzles forming circle showing yellow Templates-This PowerPoint Diagram shows the text highlighted in Yellow segment explaining the concept in circular manner. It Indicates annular, circulate, circling, dislike, indirect, oblique, orbicular, ring-shaped, round, rounded, spheroid etc.-Can be used for presentations on action, active, art, artwork, backdrop, background, beauty, body, cartoon, color, curve, dance, decoration, design, drawing, element, emotion, enjoy, enjoyment, erotic, exaltation, expression, female, girl, gladness, graphic, health, human, illustration, isolated, joy, jump, leap, life, lifestyle, love, naked, nude, ornament, people, play, sensual, sexy, shape, silhouette, slender, slim, vector, woman, young-PPT four colorful powerpoint background puzzles forming circle showing yellow Templates
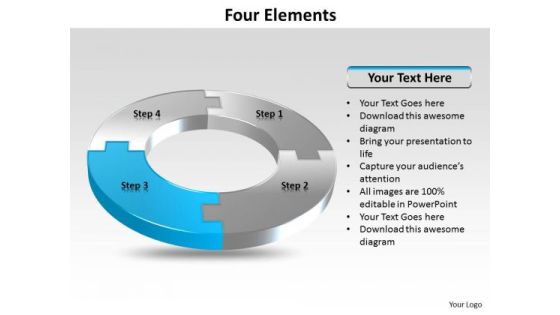
Ppt Four Colorful PowerPoint Presentations Puzzles Forming Circle Showing Blue Templates
PPT four colorful powerpoint presentations puzzles forming circle showing blue Templates-This PowerPoint Diagram shows the text highlighted in blue segment explaining the concept in circular manner. It Indicates articulation, bit, compartment, cut, division, member, moiety, parcel, piece, portion, section, sector, slice, subdivision, wedge etc.-Can be used for presentations on action, active, art, artwork, backdrop, background, beauty, body, cartoon, color, curve, dance, decoration, design, drawing, element, emotion, enjoy, enjoyment, erotic, exaltation, expression, female, girl, gladness, graphic, health, human, illustration, isolated, joy, jump, leap, life, lifestyle, love, naked, nude, ornament, people, play, sensual, sexy, shape, silhouette, slender, slim, vector, woman, young-PPT four colorful powerpoint presentations puzzles forming circle showing blue Templates

Ppt Four Colorful Puzzles Forming Circle Showing Green PowerPoint Slide Templates
PPT four colorful puzzles forming circle showing green powerpoint slide Templates-This PowerPoint Diagram shows the text highlighted in Green segment explaining the concept in circular manner. It Indicates articulation, bit, compartment, cut, division, member, moiety, indirect, oblique, orbicular, ring-shaped, round, rounded, spheroid etc. -Can be used for presentations on action, active, art, artwork, backdrop, background, beauty, body, cartoon, color, curve, dance, decoration, design, drawing, element, emotion, enjoy, enjoyment, erotic, exaltation, expression, female, girl, gladness, graphic, health, human, illustration, isolated, joy, jump, leap, life, lifestyle, love, naked, nude, ornament, people, play, sensual, sexy, shape, silhouette, slender, slim, vector, woman, young-PPT four colorful puzzles forming circle showing green powerpoint slide Templates
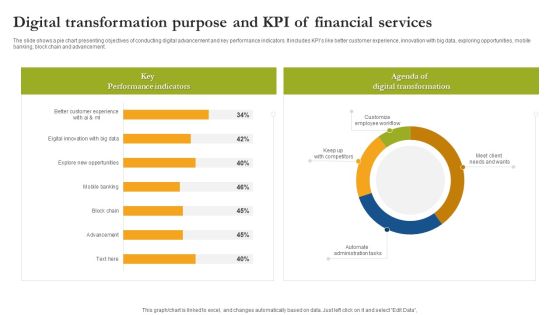
Digital Transformation Purpose And Kpi Of Financial Services Guidelines PDF
The slide shows a pie chart presenting objectives of conducting digital advancement and key performance indicators. It includes KPIs like better customer experience, innovation with big data, exploring opportunities, mobile banking, block chain and advancement. Showcasing this set of slides titled Digital Transformation Purpose And Kpi Of Financial Services Guidelines PDF. The topics addressed in these templates are Key Performance Indicators Digital Transformation, Customize Employee Workflow. All the content presented in this PPT design is completely editable. Download it and make adjustments in color, background, font etc. as per your unique business setting.
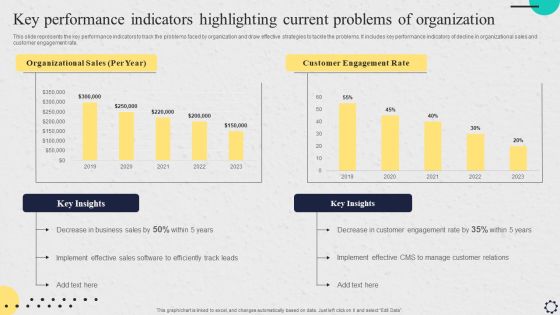
Software Implementation Strategy Key Performance Indicators Highlighting Current Problems Of Organization Professional PDF
This slide represents the key performance indicators to track the problems faced by organization and draw effective strategies to tackle the problems. It includes key performance indicators of decline in organizational sales and customer engagement rate. Make sure to capture your audiences attention in your business displays with our gratis customizable Software Implementation Strategy Key Performance Indicators Highlighting Current Problems Of Organization Professional PDF. These are great for business strategies, office conferences, capital raising or task suggestions. If you desire to acquire more customers for your tech business and ensure they stay satisfied, create your own sales presentation with these plain slides.

Dashboard To Track Energy Efficiency After Campaign Implementation Pictures PDF
This slide consists of a Dashboard which can be used to track energy saving which will be used by managers to track effectiveness of program implementation. The key performance indicators include electric vs gas allocation, equipment activity, changes in costs, budget load etc. Showcasing this set of slides titled Dashboard To Track Energy Efficiency After Campaign Implementation Pictures PDF. The topics addressed in these templates are Equipment Activity, Budget Load, Cost Projection. All the content presented in this PPT design is completely editable. Download it and make adjustments in color, background, font etc. as per your unique business setting.

Metrics Dashboard Depicting Call Center Performance Pictures PDF
Mentioned slide outlines key performance indicator KPI dashboard which can be used by call center to optimize the agents performance. The major metrics covered in the template are total calls, average speed of answer, abandon rate, service level agreement SLA limit etc. Pitch your topic with ease and precision using this Metrics Dashboard Depicting Call Center Performance Pictures PDF. This layout presents information on Overall Satisfaction Score, Satisfaction Score, Performance. It is also available for immediate download and adjustment. So, changes can be made in the color, design, graphics or any other component to create a unique layout.

Energy Efficiency Dashboard To Track Campaign Effectiveness Pictures PDF
This slide consists of a dashboard which presents an energy saving dashboard which can be used to track effectiveness of energy saving program. The key performance indicators relate to energy sources, energy consumption by sectors, energy consumption by sectors etc. Pitch your topic with ease and precision using this Energy Efficiency Dashboard To Track Campaign Effectiveness Pictures PDF. This layout presents information on Energy Sources, Energy Usage, Trend Analysis. It is also available for immediate download and adjustment. So, changes can be made in the color, design, graphics or any other component to create a unique layout.
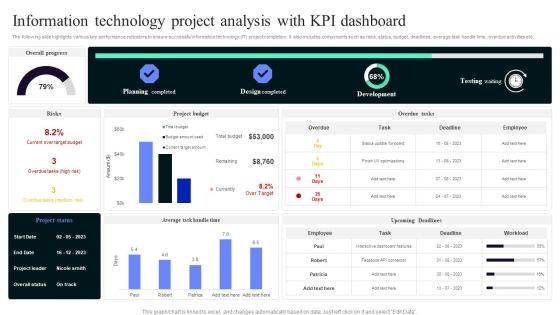
Information Technology Project Analysis With Kpi Dashboard Portrait PDF
The following slide highlights various key performance indicators to ensure successful information technology IT project completion. It also includes components such as risks, status, budget, deadlines, average task handle time, overdue activities etc. Pitch your topic with ease and precision using this Information Technology Project Analysis With Kpi Dashboard Portrait PDF. This layout presents information on Planning Completed, Design Completed, Development . It is also available for immediate download and adjustment. So, changes can be made in the color, design, graphics or any other component to create a unique layout.

COVID Impact Analysis Virus On Key Economic Indicators Ppt Pictures Inspiration PDF
This slide covers chart depicting forecast for several economic indicators. It includes estimations based on Covid situations to forecast for economic factors such as GDP, inflation, current account balances, Exim, etc. Pitch your topic with ease and precision using this COVID Impact Analysis Virus On Key Economic Indicators Ppt Pictures Inspiration PDF. This layout presents information on Covid Situation, Post Covid Situation, Current Account Balance. It is also available for immediate download and adjustment. So, changes can be made in the color, design, graphics or any other component to create a unique layout.

Analysis Plan For E Commerce Promotion Tactics Content Performance Tracking Dashboard For Social Media Channels Icons PDF
This slide indicates the content performance tracking dashboard for social media channels providing information regarding the total number of posts, engagement rate, audience sentiments and multiple hashtags performance. Formulating a presentation can take up a lot of effort and time, so the content and message should always be the primary focus. The visuals of the PowerPoint can enhance the presenters message, so our Analysis Plan For E Commerce Promotion Tactics Content Performance Tracking Dashboard For Social Media Channels Icons PDF was created to help save time. Instead of worrying about the design, the presenter can concentrate on the message while our designers work on creating the ideal templates for whatever situation is needed. Slidegeeks has experts for everything from amazing designs to valuable content, we have put everything into Analysis Plan For E Commerce Promotion Tactics Content Performance Tracking Dashboard For Social Media Channels Icons PDF

Analysis Plan For E Commerce Promotion Tactics Dashboard To Assess Social Posts Content Quality Sample PDF
This slide indicates the Dashboard to Assess Social Posts Content Quality. It provides information regarding the top published articles, story turnaround time, average number of comments per article and digital subscribers gained. This modern and well arranged Analysis Plan For E Commerce Promotion Tactics Dashboard To Assess Social Posts Content Quality Sample PDF provides lots of creative possibilities. It is very simple to customize and edit with the Powerpoint Software. Just drag and drop your pictures into the shapes. All facets of this template can be edited with Powerpoint no extra software is necessary. Add your own material, put your images in the places assigned for them, adjust the colors, and then you can show your slides to the world, with an animated slide included.
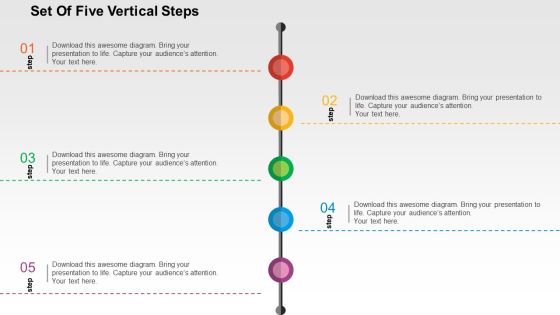
Set Of Five Vertical Steps Powerpoint Templates
This slide has been professionally created for visual representation of steps of a process. The multicolored circles which have been arranged in can be used to depict individual steps in a systematic and organized manner. This template can be used to indicate a link between individuals and can also be used to represent Hierarchy of an organization. It would be one of the easiest ways to graphically represent the flow of information or data from the top level to the lower level or vice versa in a vertical manner. This slide can also be used to depict a planned course of action. Adequate space has been marked for description which can be modified or removed as per individual needs and requirements.

Usa Ppt Template Linear Arrow 11 Phase Diagram Time Management PowerPoint 6 Design
USA PPT template linear arrow 11 phase diagram time management powerpoint 6 design-This linear arrow chart makes information accessible throughout the organization with a collective, visible view of critical data from different perspectives and providing the tools to upcoming business scenarios and plan for change.-USA PPT template linear arrow 11 phase diagram time management powerpoint 6 design-Arrow, Background, Collection, Completed, Concept, Confirmation, Design, Flow, Graph, Graphic, Illustration, Indication, Indicator, Information, Instruction, Interface, Internet, Layout, Measurement, Order, Phase, Pointer, Process, Progress, Reflection, Scale, Shape, Sign
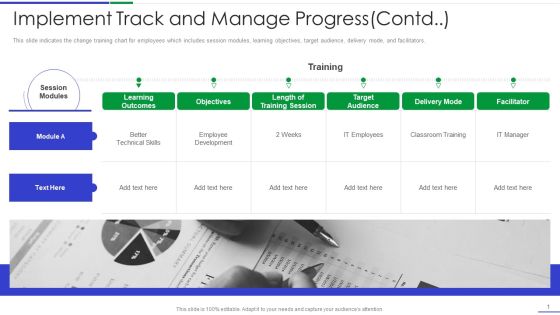
Ultimate Guide To Effective Change Management Process Implement Track And Manage Progress Contd Topics PDF
This slide indicates the change training chart for employees which includes session modules, learning objectives, target audience, delivery mode, and facilitators. Presenting ultimate guide to effective change management process implement track and manage progress contd topics pdf to provide visual cues and insights. Share and navigate important information on one stages that need your due attention. This template can be used to pitch topics like objectives, target audience, facilitator, training, development. In addtion, this PPT design contains high resolution images, graphics, etc, that are easily editable and available for immediate download.

Timeline For Enterprise Risk Administration Plan Implementation Designs PDF
This slide illustrates the business risk management program gantt chart to identify, monitor, and mitigate risk. It includes key steps such as develop KRI framework, provide training, track KRI, determine tolerance level, etc. Showcasing this set of slides titled Timeline For Enterprise Risk Administration Plan Implementation Designs PDF. The topics addressed in these templates are Develop Key Risk, Indicators Framework, Determine Tolerance Level . All the content presented in this PPT design is completely editable. Download it and make adjustments in color, background, font etc. as per your unique business setting.
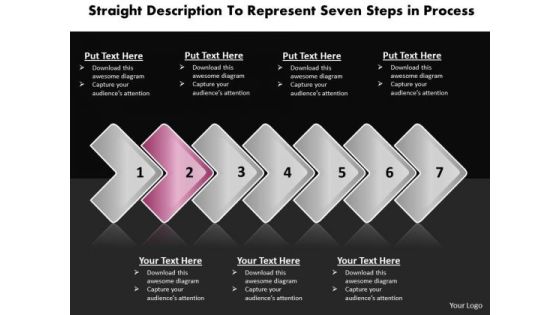
Ppt Continuous Description To Represent Seven Steps Process PowerPoint Templates
PPT continuous description to represent seven steps process PowerPoint Templates-Use this layout to define the outcome and the multiple possibilities in a way that is used in calculation of probabilities, genetics and strategic reasoning. This chart visualizes the concept of process steps, reoccurrences and components or of your company structure or product features. You can change color, size and orientation of any icon to your liking. -PPT continuous description to represent seven steps process PowerPoint Templates-Aim, Arrow, Arrowheads, Badge, Border, Click, Connection, Curve, Design, Direction, Download, Element, Fuchsia, Icon, Illustration, Indicator, Internet, Magenta, Mark, Object, Orientation, Pointer, Shadow, Shape, Sign

Ppt Horizontal Description To Represent Seven Steps In Process PowerPoint Templates
PPT horizontal description to represent seven steps in process PowerPoint Templates-Use this Business Process Chart which consists of seven text boxes to describe seven different approaches. It imitates affairs, bargaining, barter, buying and selling, contracts, deal, dealings, exchange, free enterprise, game, industrialism, industry, manufacturing, manner, means, measure, mechanism, mode, modus operandi, movement, operation, and outgrowth.-PPT horizontal description to represent seven steps in process PowerPoint Templates-Aim, Arrow, Arrowheads, Badge, Border, Click, Connection, Curve, Design, Direction, Download, Element, Fuchsia, Icon, Illustration, Indicator, Internet, Magenta, Mark, Object, Orientation, Pointer, Shadow, Shape, Sign

Business Projects Portfolio Spotlight Status Report Template Brochure PDF
The slide showcases a spotlight status report for multiple projects of a software development company. It depicts a stoplight chart to indicate which projects in a portfolio are in good shape the colours red, yellow, and green are used to show status. Showcasing this set of slides titled Business Projects Portfolio Spotlight Status Report Template Brochure PDF. The topics addressed in these templates are Business Projects Portfolio, Spotlight Status, Report Template. All the content presented in this PPT design is completely editable. Download it and make adjustments in color, background, font etc. as per your unique business setting.

Customer Satisfaction Levels High Medium Low Indicator Dashboard Ppt PowerPoint Presentation Icon Show
This is a customer satisfaction levels high medium low indicator dashboard ppt powerpoint presentation icon show. This is a six stage process. The stages in this process are performance dashboard, performance meter, performance kpi.

Low High Performance Measurement Indicator Dashboard Ppt PowerPoint Presentation Summary Images
This is a low high performance measurement indicator dashboard ppt powerpoint presentation summary images. This is a five stage process. The stages in this process are performance dashboard, performance meter, performance kpi.

Dashboard Vector With Pointer And Text Holders Ppt PowerPoint Presentation Portfolio Format Ideas
This is a dashboard vector with pointer and text holders ppt powerpoint presentation portfolio format ideas. This is a four stage process. The stages in this process are performance dashboard, performance meter, performance kpi.

Dashboards For Performance Mapping And Management Ppt PowerPoint Presentation Ideas File Formats
This is a dashboards for performance mapping and management ppt powerpoint presentation ideas file formats. This is a four stage process. The stages in this process are performance dashboard, performance meter, performance kpi.

KPI Dashboards And Operational Metrics Ppt PowerPoint Presentation Portfolio Infographics

Business Plan Future PowerPoint Presentation Slides C
Microsoft Powerpoint Slides and Backgrounds with a speedometer needle speeds past the various stages of getting a job the resume the interview and success
Business Plan Future PowerPoint Presentation Slides Cc
Microsoft Powerpoint Slides and Backgrounds with a speedometer needle speeds past the various stages of getting a job the resume the interview and success

Business Plan Future PowerPoint Presentation Slides F
Microsoft Powerpoint Slides and Backgrounds with a speedometer needle speeds past the various stages of getting a job the resume the interview and success
Business Plan Future PowerPoint Presentation Slides R
Microsoft Powerpoint Slides and Backgrounds with a speedometer needle speeds past the various stages of getting a job the resume the interview and success
Business Plan Future PowerPoint Presentation Slides S
Microsoft Powerpoint Slides and Backgrounds with a speedometer needle speeds past the various stages of getting a job the resume the interview and success

Key Performance Indicators In Supply Chain Order Accuracy And Cycle Time Ppt PowerPoint Presentation Infographics Slideshow
This is a key performance indicators in supply chain order accuracy and cycle time ppt powerpoint presentation infographics slideshow. This is a two stage process. The stages in this process are logistics performance, logistics dashboard, logistics kpis.
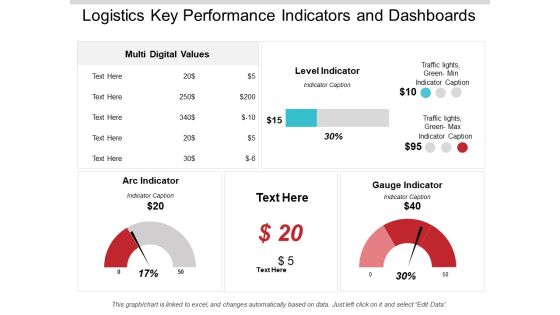
Logistics Key Performance Indicators And Dashboards Ppt PowerPoint Presentation Infographics Background Image
This is a logistics key performance indicators and dashboards ppt powerpoint presentation infographics background image. This is a three stage process. The stages in this process are logistics performance, logistics dashboard, logistics kpis.
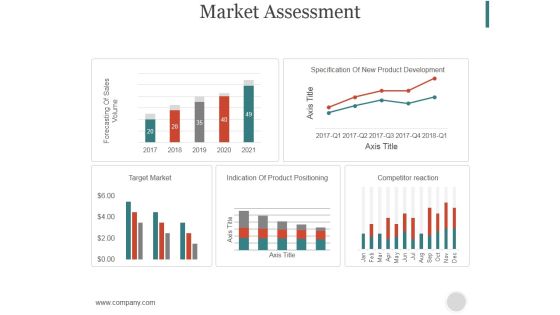
Market Assessment Ppt PowerPoint Presentation Model
This is a market assessment ppt powerpoint presentation model. This is a five stage process. The stages in this process are forecasting of sales volume, specification of new product development, target market, indication of product positioning.

Process PowerPoint Template Arrow 6 Stages 1 Communication Skills Design
We present our process PowerPoint template arrow 6 stages 1 communication skills design. Use our Abstract PowerPoint Templates because; now imprint them on the minds of your audience via our slides. Use our Symbol PowerPoint Templates because, Its also been said that prevention is better than cure, either way you have a store of knowledge for sure. Use our Arrows PowerPoint Templates because, aesthetically designed to make a great first impression this template highlights. Use our Business PowerPoint Templates because, they are indicators of the path you have in mind. Use our Process and Flows PowerPoint Templates because, Brainstorming Light Bulbs: - The atmosphere in the workplace is electric. Use these PowerPoint slides for presentations relating to Arrow, Background, Business, Chart, Diagram, Financial, Graphic, Gray, Icon, Illustration, Management, Orange, Perspective, Planning, Process, Process, Stages, Steps, Text. The prominent colors used in the PowerPoint template are Green, Gray, and Black
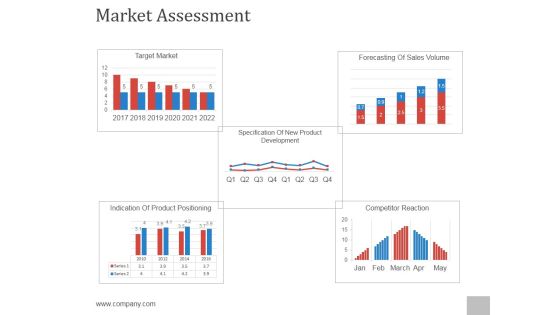
Market Assessment Ppt PowerPoint Presentation Files
This is a market assessment ppt powerpoint presentation files. This is a five stage process. The stages in this process are target market, forecasting of sales volume, indication of product positioning, competitor reaction, specification of new product development.

Competitor Analysis Ppt PowerPoint Presentation Model Visual Aids
This is a competitor analysis ppt powerpoint presentation model visual aids. This is a four stage process. The stages in this process are competitor analysis, revenue, sales, sales development, performance indicators.

Competitor Analysis Ppt PowerPoint Presentation Layouts Slides
This is a competitor analysis ppt powerpoint presentation layouts slides. This is a four stage process. The stages in this process are sales development, performance indicators, sales development of industry, revenue sales.

Competitor Analysis Ppt PowerPoint Presentation Model Show
This is a competitor analysis ppt powerpoint presentation model show. This is a four stage process. The stages in this process are performance indicators, sales development of industry, sales development, revenue, sales.

Competitor Analysis Ppt PowerPoint Presentation Samples
This is a competitor analysis ppt powerpoint presentation samples. This is a four stage process. The stages in this process are sales development of industry, performance indicators, sales development, sales.

Competitor Analysis Ppt PowerPoint Presentation Outline Ideas
This is a competitor analysis ppt powerpoint presentation outline ideas. This is a four stage process. The stages in this process are sales development of industry, revenue, sales, performance indicators.

Competitor Analysis Ppt PowerPoint Presentation File Mockup
This is a competitor analysis ppt powerpoint presentation file mockup. This is a four stage process. The stages in this process are sales development of industry, revenue, performance indicators, sales development.

Competitor Analysis Ppt PowerPoint Presentation Layouts Slideshow
This is a competitor analysis ppt powerpoint presentation layouts slideshow. This is a four stage process. The stages in this process are sales development of industry, performance indicators, sales development, revenue, sales.

Competitor Analysis Ppt PowerPoint Presentation Visual Aids Model
This is a competitor analysis ppt powerpoint presentation visual aids model. This is a four stage process. The stages in this process are sales development of industry, performance indicators, sales development, revenue sales, business.
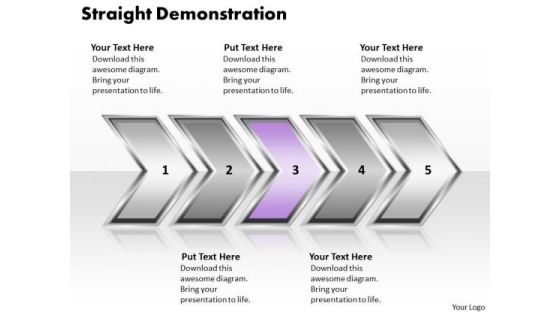
Ppt Straight Demonstration Of Process Using Circular Arrows PowerPoint 2010 Templates
PPT straight demonstration of process using circular arrows powerpoint 2010 Templates-Analyze the six success factors of your business with this linear business chart for Microsoft PowerPoint presentations. This diagram helps you to analyze all the connected ideas and also can be used to show six aspects of an issue. It is a useful captivating tool enables you to define your message in your Marketing PPT presentations. You can apply other 3D Styles and shapes to the slide to enhance your presentations.-PPT straight demonstration of process using circular arrows powerpoint 2010 Templates-Aim, Arrow, Arrowheads, Badge, Border, Click, Connection, Curve, Design, Direction, Download, Element, Fuchsia, Icon, Illustration, Indicator, Internet, Magenta, Mark, Object, Orientation, Pointer, Shadow, Shape, Sign
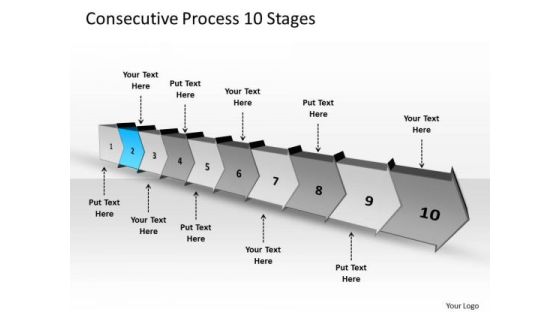
Consecutive Process 10 Stages Creating Flowchart PowerPoint Templates
We present our consecutive process 10 stages creating flowchart PowerPoint templates. Use our Arrows PowerPoint Templates because; you have the ideas to develop the teams vision of where they need to be in the future. Use our Business PowerPoint Templates because, you have played a stellar role and have a few ideas. Use our Shapes PowerPoint Templates because, prove how they mesh to motivate the company team and provide the steam to activate the composite machine. Use our Finance PowerPoint Templates because, our presentation designs are for those on the go. Use our Process and Flows PowerPoint Templates because, they are indicators of the path you have in mind. Use these PowerPoint slides for presentations relating to abstract arrow blank business chart circular circulation concept conceptual consecutive design diagram executive flow icon idea illustration management model numbers organization procedure process. The prominent colors used in the PowerPoint template are Blue, Gray, and Black

 Home
Home