Gauge Chart

Cloud Performance Tracking Dashboard Managing Complexity Of Multiple Cloud Platforms Download PDF
This slide covers the key performance indicators for tracking performance of the cloud such as violations break down, sources, rules and severity.Presenting this PowerPoint presentation, titled Cloud Performance Tracking Dashboard Managing Complexity Of Multiple Cloud Platforms Download PDF, with topics curated by our researchers after extensive research. This editable presentation is available for immediate download and provides attractive features when used. Download now and captivate your audience. Presenting this Cloud Performance Tracking Dashboard Managing Complexity Of Multiple Cloud Platforms Download PDF. Our researchers have carefully researched and created these slides with all aspects taken into consideration. This is a completely customizable Cloud Performance Tracking Dashboard Managing Complexity Of Multiple Cloud Platforms Download PDF that is available for immediate downloading. Download now and make an impact on your audience. Highlight the attractive features available with our PPTs.

Ecommerce KPI Dashboard With Pand L Statement Download PDF
This slide showcases ecommerce key performance indicators KPI dashboard with financial statement. It provides information about total sales, orders, net profit, net profit margin, average order value, channels, etc. This Ecommerce KPI Dashboard With Pand L Statement Download PDF from Slidegeeks makes it easy to present information on your topic with precision. It provides customization options, so you can make changes to the colors, design, graphics, or any other component to create a unique layout. It is also available for immediate download, so you can begin using it right away. Slidegeeks has done good research to ensure that you have everything you need to make your presentation stand out. Make a name out there for a brilliant performance.

KPI Dashboard To Analyze Performance Of Healthcare Financial Department Summary PDF
The following slide showcases key performance indicator KPI dashboard which can be used to analyze the financial performance of hospital. The metrics covered in the slide are net profit margin, income and expenses, etc. Do you have an important presentation coming up Are you looking for something that will make your presentation stand out from the rest Look no further than KPI Dashboard To Analyze Performance Of Healthcare Financial Department Summary PDF. With our professional designs, you can trust that your presentation will pop and make delivering it a smooth process. And with Slidegeeks, you can trust that your presentation will be unique and memorable. So why wait Grab KPI Dashboard To Analyze Performance Of Healthcare Financial Department Summary PDF today and make your presentation stand out from the rest.
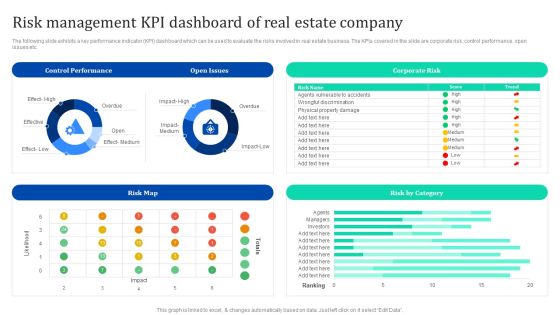
Risk Management Kpi Dashboard Of Real Estate Company Enhancing Process Improvement By Regularly Inspiration PDF
The following slide exhibits a key performance indicator KPI dashboard which can be used to evaluate the risks involved in real estate business. The KPIs covered in the slide are corporate risk, control performance, open issues etc. This Risk Management Kpi Dashboard Of Real Estate Company Enhancing Process Improvement By Regularly Inspiration PDF from Slidegeeks makes it easy to present information on your topic with precision. It provides customization options, so you can make changes to the colors, design, graphics, or any other component to create a unique layout. It is also available for immediate download, so you can begin using it right away. Slidegeeks has done good research to ensure that you have everything you need to make your presentation stand out. Make a name out there for a brilliant performance.
Strategies To Maintain Transportation Shipping And Logistics Tracking Dashboard With Shipments Ppt Infographics Information PDF
This slide covers Key performance indicators to track the automation system of the company. This dashboard includes Logistics Efficiency Status, delivery time accuracy etc. Presenting this PowerPoint presentation, titled Strategies To Maintain Transportation Shipping And Logistics Tracking Dashboard With Shipments Ppt Infographics Information PDF, with topics curated by our researchers after extensive research. This editable presentation is available for immediate download and provides attractive features when used. Download now and captivate your audience. Presenting this Strategies To Maintain Transportation Shipping And Logistics Tracking Dashboard With Shipments Ppt Infographics Information PDF. Our researchers have carefully researched and created these slides with all aspects taken into consideration. This is a completely customizable Strategies To Maintain Transportation Shipping And Logistics Tracking Dashboard With Shipments Ppt Infographics Information PDF that is available for immediate downloading. Download now and make an impact on your audience. Highlight the attractive features available with our PPTs.
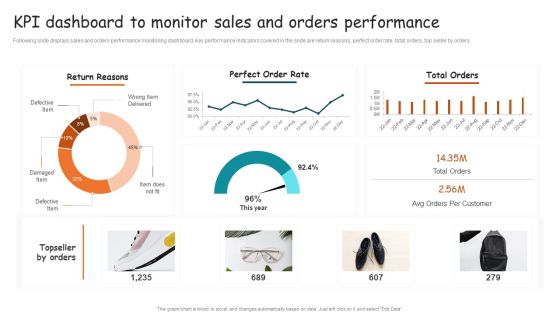
Guide For Brand Kpi Dashboard To Monitor Sales And Orders Performance Brochure PDF
Following slide displays sales and orders performance monitoring dashboard. Key performance indicators covered in the slide are return reasons, perfect order rate, total orders, top seller by orders. Do you have an important presentation coming up Are you looking for something that will make your presentation stand out from the rest Look no further than Guide For Brand Kpi Dashboard To Monitor Sales And Orders Performance Brochure PDF. With our professional designs, you can trust that your presentation will pop and make delivering it a smooth process. And with Slidegeeks, you can trust that your presentation will be unique and memorable. So why wait Grab Guide For Brand Kpi Dashboard To Monitor Sales And Orders Performance Brochure PDF today and make your presentation stand out from the rest.
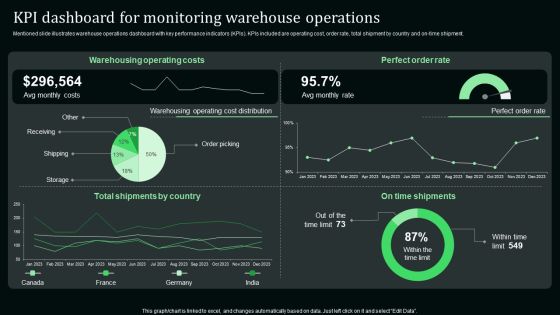
Kpi Dashboard For Monitoring Warehouse Operations Stand Out Digital Supply Chain Tactics Enhancing Information PDF
Mentioned slide illustrates warehouse operations dashboard with key performance indicators KPIs. KPIs included are operating cost, order rate, total shipment by country and on-time shipment.Presenting this PowerPoint presentation, titled Kpi Dashboard For Monitoring Warehouse Operations Stand Out Digital Supply Chain Tactics Enhancing Information PDF, with topics curated by our researchers after extensive research. This editable presentation is available for immediate download and provides attractive features when used. Download now and captivate your audience. Presenting this Kpi Dashboard For Monitoring Warehouse Operations Stand Out Digital Supply Chain Tactics Enhancing Information PDF. Our researchers have carefully researched and created these slides with all aspects taken into consideration. This is a completely customizable Kpi Dashboard For Monitoring Warehouse Operations Stand Out Digital Supply Chain Tactics Enhancing Information PDF that is available for immediate downloading. Download now and make an impact on your audience. Highlight the attractive features available with our PPTs.

Kpi Dashboard To Measure Effectiveness Of Youtube Marketing Slides PDF
The following slide outlines key performance indicator KPI dashboard which will assist the marketer to track YouTube marketing campaign performance. The key metrics covered in the slide are subscribers gained and lost, likes, dislikes, comments, shares etc. Do you have an important presentation coming up Are you looking for something that will make your presentation stand out from the rest Look no further than Kpi Dashboard To Measure Effectiveness Of Youtube Marketing Slides PDF. With our professional designs, you can trust that your presentation will pop and make delivering it a smooth process. And with Slidegeeks, you can trust that your presentation will be unique and memorable. So why wait Grab Kpi Dashboard To Measure Effectiveness Of Youtube Marketing Slides PDF today and make your presentation stand out from the rest.

Retail Business Optimization Through Operational Excellence Strategy Determining Back Order Rate Slides PDF
Following slide illustrates information stats about back order rate and rate of return in the year 2020. Here the graph indicates that back order rate get exceeded to 4.8 percent from the target value in 2020. Do you have an important presentation coming up Are you looking for something that will make your presentation stand out from the rest Look no further than Retail Business Optimization Through Operational Excellence Strategy Determining Back Order Rate Slides PDF. With our professional designs, you can trust that your presentation will pop and make delivering it a smooth process. And with Slidegeeks, you can trust that your presentation will be unique and memorable. So why wait Grab Retail Business Optimization Through Operational Excellence Strategy Determining Back Order Rate Slides PDF today and make your presentation stand out from the rest.
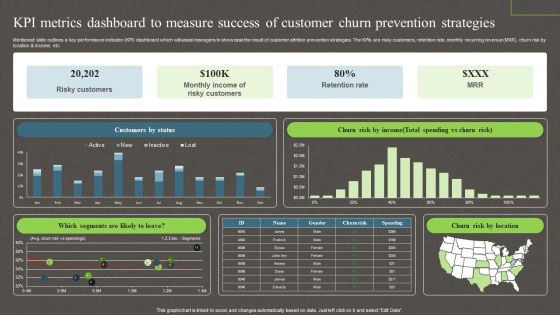
Kpi Metrics Dashboard To Measure Success Of Customer Churn Prevention Strategies Ppt PowerPoint Presentation File Model PDF
Mentioned slide outlines a key performance indicator KPI dashboard which will assist managers to showcase the result of customer attrition prevention strategies. The KPIs are risky customers, retention rate, monthly recurring revenue MRR, churn risk by location and income, etc. This Kpi Metrics Dashboard To Measure Success Of Customer Churn Prevention Strategies Ppt PowerPoint Presentation File Model PDF from Slidegeeks makes it easy to present information on your topic with precision. It provides customization options, so you can make changes to the colors, design, graphics, or any other component to create a unique layout. It is also available for immediate download, so you can begin using it right away. Slidegeeks has done good research to ensure that you have everything you need to make your presentation stand out. Make a name out there for a brilliant performance.

Definitive Guide To Conduct Digital Marketing Inspection Dashboard To Assess Social Posts Content Quality Summary PDF
This slide indicates the Dashboard to Assess Social Posts Content Quality. It provides information regarding the top published articles, story turnaround time, average number of comments per article and digital subscribers gained. Take your projects to the next level with our ultimate collection of Definitive Guide To Conduct Digital Marketing Inspection Dashboard To Assess Social Posts Content Quality Summary PDF. Slidegeeks has designed a range of layouts that are perfect for representing task or activity duration, keeping track of all your deadlines at a glance. Tailor these designs to your exact needs and give them a truly corporate look with your own brand colors they will make your projects stand out from the rest.

Retail Business Operation Management To Optimize Customer Experience Determining Back Order Rate Rules PDF
Following slide illustrates information stats about back order rate and rate of return in the year 2023. Here the graph indicates that back order rate get exceeded to 4.8percent from the target value in 2023. Do you have an important presentation coming up Are you looking for something that will make your presentation stand out from the rest Look no further than Retail Business Operation Management To Optimize Customer Experience Determining Back Order Rate Rules PDF. With our professional designs, you can trust that your presentation will pop and make delivering it a smooth process. And with Slidegeeks, you can trust that your presentation will be unique and memorable. So why wait Grab Retail Business Operation Management To Optimize Customer Experience Determining Back Order Rate Rules PDF today and make your presentation stand out from the rest.

Assessing Impact Of Sales Risk Management With KPI Dashboard Ideas PDF
The following slide highlights some key performance indicators KPIs to measure the influence of executing sales risk management strategies on revenue performance. It includes elements such as target attainment rate, gross profit, annual growth rate etc. Presenting this PowerPoint presentation, titled Assessing Impact Of Sales Risk Management With KPI Dashboard Ideas PDF, with topics curated by our researchers after extensive research. This editable presentation is available for immediate download and provides attractive features when used. Download now and captivate your audience. Presenting this Assessing Impact Of Sales Risk Management With KPI Dashboard Ideas PDF. Our researchers have carefully researched and created these slides with all aspects taken into consideration. This is a completely customizable Assessing Impact Of Sales Risk Management With KPI Dashboard Ideas PDF that is available for immediate downloading. Download now and make an impact on your audience. Highlight the attractive features available with our PPTs.

Ecommerce Photo Editing Services Fundraising Deck Financial Performance Demonstration PDF
The following slide outlines the yearly revenue of our company. The graphical representation covers information about annual sales from 2019-2022 that indicates upward growth. This Ecommerce Photo Editing Services Fundraising Deck Financial Performance Demonstration PDF from Slidegeeks makes it easy to present information on your topic with precision. It provides customization options, so you can make changes to the colors, design, graphics, or any other component to create a unique layout. It is also available for immediate download, so you can begin using it right away. Slidegeeks has done good research to ensure that you have everything you need to make your presentation stand out. Make a name out there for a brilliant performance.

Assessing Impact Of Sales Risk Management With Kpi Dashboard Formats PDF
The following slide highlights some key performance indicators KPIs to measure the influence of executing sales risk management strategies on revenue performance. It includes elements such as target attainment rate, gross profit, annual growth rate etc. Presenting this PowerPoint presentation, titled Assessing Impact Of Sales Risk Management With Kpi Dashboard Formats PDF, with topics curated by our researchers after extensive research. This editable presentation is available for immediate download and provides attractive features when used. Download now and captivate your audience. Presenting this Assessing Impact Of Sales Risk Management With Kpi Dashboard Formats PDF. Our researchers have carefully researched and created these slides with all aspects taken into consideration. This is a completely customizable Assessing Impact Of Sales Risk Management With Kpi Dashboard Formats PDF that is available for immediate downloading. Download now and make an impact on your audience. Highlight the attractive features available with our PPTs.

Assessing Impact Of Sales Risk Management With KPI Dashboard Guidelines PDF
The following slide highlights some key performance indicators KPIs to measure the influence of executing sales risk management strategies on revenue performance. It includes elements such as target attainment rate, gross profit, annual growth rate etc. Presenting this PowerPoint presentation, titled Assessing Impact Of Sales Risk Management With KPI Dashboard Guidelines PDF, with topics curated by our researchers after extensive research. This editable presentation is available for immediate download and provides attractive features when used. Download now and captivate your audience. Presenting this Assessing Impact Of Sales Risk Management With KPI Dashboard Guidelines PDF. Our researchers have carefully researched and created these slides with all aspects taken into consideration. This is a completely customizable Assessing Impact Of Sales Risk Management With KPI Dashboard Guidelines PDF that is available for immediate downloading. Download now and make an impact on your audience. Highlight the attractive features available with our PPTs.

Implementing Sales Volatility Management Techniques Key Metrics To Assess Effectiveness Of Sales Designs PDF
The following slide highlights some key performance indicators to measure the effectiveness of sales risk evaluation on revenue performance. It includes elements such as opportunities, win rate, average time to win, sales velocity along with key insights etc. Do you have an important presentation coming up Are you looking for something that will make your presentation stand out from the rest Look no further than Implementing Sales Volatility Management Techniques Key Metrics To Assess Effectiveness Of Sales Designs PDF. With our professional designs, you can trust that your presentation will pop and make delivering it a smooth process. And with Slidegeeks, you can trust that your presentation will be unique and memorable. So why wait Grab Implementing Sales Volatility Management Techniques Key Metrics To Assess Effectiveness Of Sales Designs PDF today and make your presentation stand out from the rest.
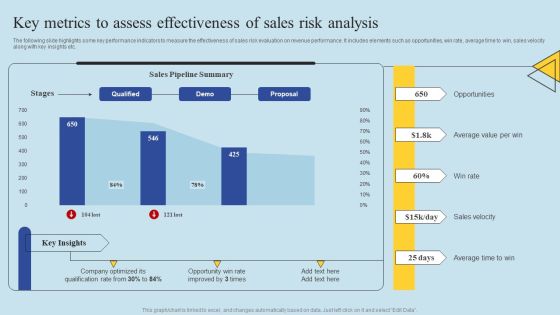
Determining Risks In Sales Administration Procedure Key Metrics To Assess Effectiveness Of Sales Pictures PDF
The following slide highlights some key performance indicators to measure the effectiveness of sales risk evaluation on revenue performance. It includes elements such as opportunities, win rate, average time to win, sales velocity along with key insights etc. This Determining Risks In Sales Administration Procedure Key Metrics To Assess Effectiveness Of Sales Pictures PDF from Slidegeeks makes it easy to present information on your topic with precision. It provides customization options, so you can make changes to the colors, design, graphics, or any other component to create a unique layout. It is also available for immediate download, so you can begin using it right away. Slidegeeks has done good research to ensure that you have everything you need to make your presentation stand out. Make a name out there for a brilliant performance.

Dashboard To Analyze Flexible Working Strategies Impact On Employees Performance Infographics PDF
The following slide delineates a key performance indicator KPI dashboard through which managers can evaluate the success of a flexible working policy on workforce performance. The major KPIs are absenteeism rate, overall labor effectiveness etc. Presenting this PowerPoint presentation, titled Dashboard To Analyze Flexible Working Strategies Impact On Employees Performance Infographics PDF, with topics curated by our researchers after extensive research. This editable presentation is available for immediate download and provides attractive features when used. Download now and captivate your audience. Presenting this Dashboard To Analyze Flexible Working Strategies Impact On Employees Performance Infographics PDF. Our researchers have carefully researched and created these slides with all aspects taken into consideration. This is a completely customizable Dashboard To Analyze Flexible Working Strategies Impact On Employees Performance Infographics PDF that is available for immediate downloading. Download now and make an impact on your audience. Highlight the attractive features available with our PPTs.

Guide To Healthcare Services Administration KPI Metrics Dashboard To Measure Effectiveness Healthcare Information PDF
The following slide showcases key performance indicator KPI metrics dashboard which can be used to evaluate the success rate of healthcare recruitment. It covers information about technical and non-technical hiring, recruitment costs, current hiring pipeline etc. This Guide To Healthcare Services Administration KPI Metrics Dashboard To Measure Effectiveness Healthcare Information PDF from Slidegeeks makes it easy to present information on your topic with precision. It provides customization options, so you can make changes to the colors, design, graphics, or any other component to create a unique layout. It is also available for immediate download, so you can begin using it right away. Slidegeeks has done good research to ensure that you have everything you need to make your presentation stand out. Make a name out there for a brilliant performance.

Implementing Cyber Security Incident Enterprise Cyber Risk Dashboard Professional PDF
This slide represents the key metrics dashboard representing details related to management of cyber security incidents by an enterprise. It includes key performance indicators such as risk analysis progress, risk rating breakdown etc. Do you have an important presentation coming up Are you looking for something that will make your presentation stand out from the rest Look no further than Implementing Cyber Security Incident Enterprise Cyber Risk Dashboard Professional PDF. With our professional designs, you can trust that your presentation will pop and make delivering it a smooth process. And with Slidegeeks, you can trust that your presentation will be unique and memorable. So why wait Grab Implementing Cyber Security Incident Enterprise Cyber Risk Dashboard Professional PDF today and make your presentation stand out from the rest.
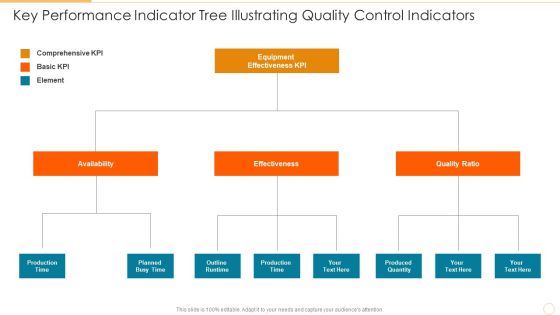
Key Performance Indicator Tree Illustrating Quality Control Indicators Information PDF
Presenting key performance indicator tree illustrating quality control indicators information pdf to dispense important information. This template comprises three stages. It also presents valuable insights into the topics including availability, effectiveness, quality ratio. This is a completely customizable PowerPoint theme that can be put to use immediately. So, download it and address the topic impactfully.

Arrow Diagram Indicate The Tasks Circular Flow Layout Process PowerPoint Slides
We present our arrow diagram indicate the tasks Circular Flow Layout Process PowerPoint Slides.Download and present our Business PowerPoint Templates because your thoughts are pointed and sharp as arrows. Present our Ring Charts PowerPoint Templates because it Draws the universal impact to highlight the similarities with your organizational structure and plans. Download our Marketing PowerPoint Templates because networking is an imperative in todays world. You need to access the views of others. Similarly you need to give access to them of your abilities. Use our Shapes PowerPoint Templates because different people with differing ideas and priorities perform together to score. Download our Process and Flows PowerPoint Templates because you have a great plan to put the pieces together, getting all the various contributors to gel for a successful completion.Use these PowerPoint slides for presentations relating to Arrows, choice, connect, design, direction, flows, four, info graph, instruction, layout, manual, marketing, modern, one, option, order, page, paper, pointing, process, product, promotion, sequence, simple, special, step, symbol. The prominent colors used in the PowerPoint template are Purple, Blue, Black. Presenters tell us our arrow diagram indicate the tasks Circular Flow Layout Process PowerPoint Slides are Majestic. Professionals tell us our info PowerPoint templates and PPT Slides are Breathtaking. PowerPoint presentation experts tell us our arrow diagram indicate the tasks Circular Flow Layout Process PowerPoint Slides are Clever. The feedback we get is that our info PowerPoint templates and PPT Slides are Nifty. Use our arrow diagram indicate the tasks Circular Flow Layout Process PowerPoint Slides are One-of-a-kind. Use our four PowerPoint templates and PPT Slides are readymade to fit into any presentation structure.
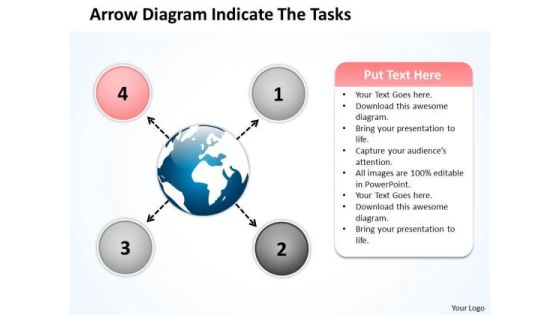
Arrow Diagram Indicate The Tasks Circle Circular Flow Layout Process PowerPoint Slides
We present our arrow diagram indicate the tasks circle Circular Flow Layout Process PowerPoint Slides.Download our Business PowerPoint Templates because this diagram helps you to show goal also clearly etched in your mind. Use our Ring Charts PowerPoint Templates because you have the ideas to develop the teams vision of where they need to be in the future. Download our Marketing PowerPoint Templates because networking is an imperative in todays world. You need to access the views of others. Similarly you need to give access to them of your abilities. Download and present our Shapes PowerPoint Templates because this slide shows each path to the smallest detail. Download our Process and Flows PowerPoint Templates because this Layout helps you to expand your plans to overcome obstacles and reassure the team that they shall continue to roll along merrily.Use these PowerPoint slides for presentations relating to Arrows, choice, connect, design, direction, flows, four, info graph, instruction, layout, manual, marketing, modern, one, option, order, page, paper, pointing, process, product, promotion, sequence, simple, special, step, symbol. The prominent colors used in the PowerPoint template are Pink, Blue, White. Presenters tell us our arrow diagram indicate the tasks circle Circular Flow Layout Process PowerPoint Slides will help you be quick off the draw. Just enter your specific text and see your points hit home. Professionals tell us our info PowerPoint templates and PPT Slides provide you with a vast range of viable options. Select the appropriate ones and just fill in your text. PowerPoint presentation experts tell us our arrow diagram indicate the tasks circle Circular Flow Layout Process PowerPoint Slides are Dazzling. The feedback we get is that our connect PowerPoint templates and PPT Slides will make you look like a winner. Use our arrow diagram indicate the tasks circle Circular Flow Layout Process PowerPoint Slides are Detailed. Use our four PowerPoint templates and PPT Slides are Spectacular.
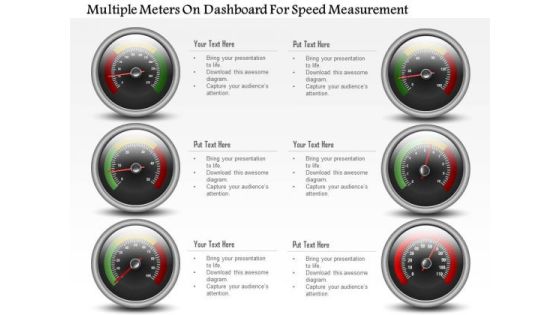
Business Diagram Multiple Meters On Dashboard For Speed Measurement PowerPoint Slide
This business diagram has been designed with multiple meters on dashboard. This slide can be used for business planning and progress. Use this diagram for your business and success milestones related presentations.

Key Performance Indicator Tree Indicating Fixed And Variable Costs Diagrams PDF
Persuade your audience using this key performance indicator tree indicating fixed and variable costs diagrams pdf. This PPT design covers four stages, thus making it a great tool to use. It also caters to a variety of topics including costs, revenue, profit. Download this PPT design now to present a convincing pitch that not only emphasizes the topic but also showcases your presentation skills.

Templates Download Statistics Business Plan For Small PowerPoint Slides
We present our templates download statistics business plan for small PowerPoint Slides.Download our Process and Flows PowerPoint Templates because Our PowerPoint Templates and Slides will give you great value for your money. Be assured of finding the best projection to highlight your words. Present our Circle Charts PowerPoint Templates because You should Press the right buttons with our PowerPoint Templates and Slides. They will take your ideas down the perfect channel. Download our Shapes PowerPoint Templates because It will get your audience in sync. Download our Business PowerPoint Templates because You will get more than you ever bargained for. Download and present our Marketing PowerPoint Templates because Our PowerPoint Templates and Slides are focused like a searchlight beam. They highlight your ideas for your target audience.Use these PowerPoint slides for presentations relating to Infographic, graph, chart, data, icon, diagram, progress, bar, line, download, button, pie, search, time, statistics, percent, segment, cloud, business, concept, sign,loading, symbol, template, circle, graphic, full, element, report, level, black, shape, computer, modern, status, visualization, round, section, web,design, statistics, growth, colorful, info, stats, information, indicator. The prominent colors used in the PowerPoint template are Green, Gray, Black.
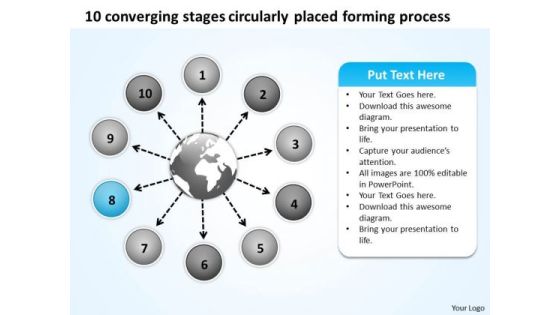
Stages Circularly Placed Forming Process Flow Diagram PowerPoint Slides
We present our stages circularly placed forming process Flow Diagram PowerPoint Slides.Download our Arrows PowerPoint Templates because they are the indicators of the path you have in mind. Download and present our Process and Flows PowerPoint Templates because this template helps you to bring your audiences to the table. Download and present our Business PowerPoint Templates because your ideas too are pinpointedly focused on you goals. Present our Shapes PowerPoint Templates because this is An innovative slide design depicting driving home the relevance of a steady rhythm. Use our Circle Charts PowerPoint Templates because it Creates a winner with your passion and dream.Use these PowerPoint slides for presentations relating to Arrow, Business, Chart, Circle, Design, Diagram, Direction, Document, Market, Marketing, Multiple, Navigation, Network, Options, Plan, Presentation, Process, Results, Shiny, Sphere, Statistics, Structure, Template, Three, Vector, Website, Wheel. The prominent colors used in the PowerPoint template are Blue light, White, Gray. People tell us our stages circularly placed forming process Flow Diagram PowerPoint Slides are Striking. People tell us our Diagram PowerPoint templates and PPT Slides are Pretty. The feedback we get is that our stages circularly placed forming process Flow Diagram PowerPoint Slides are Ritzy. Presenters tell us our Design PowerPoint templates and PPT Slides are Fabulous. Customers tell us our stages circularly placed forming process Flow Diagram PowerPoint Slides are designed by professionals The feedback we get is that our Document PowerPoint templates and PPT Slides are Reminiscent.
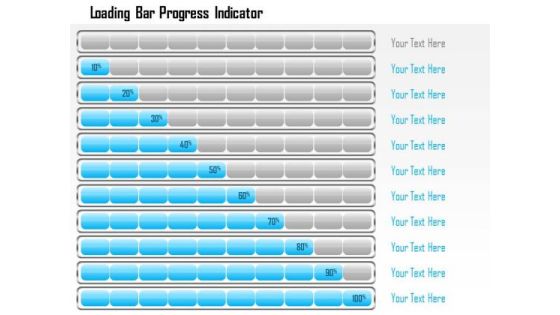
Business Framework Loading Bar Progress Indicator PowerPoint Presentation
This business diagram displays bar progress indicators. This business slide contains the concept of business growth shown in multiple levels. Use this diagram to present and compare data in an impressive manner.
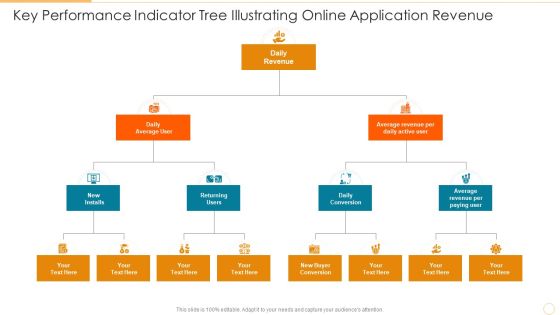
Key Performance Indicator Tree Illustrating Online Application Revenue Download PDF
Presenting key performance indicator tree illustrating online application revenue download pdf to dispense important information. This template comprises three stages. It also presents valuable insights into the topics including daily conversion, returning users, daily revenue. This is a completely customizable PowerPoint theme that can be put to use immediately. So, download it and address the topic impactfully.
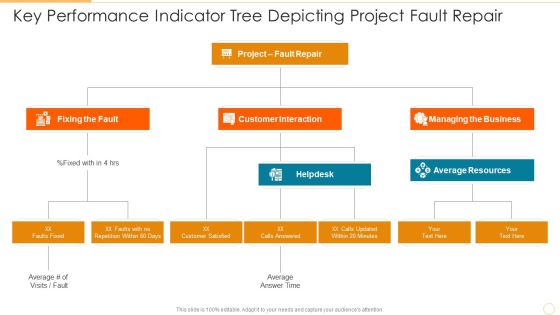
Key Performance Indicator Tree Depicting Project Fault Repair Diagrams PDF
Presenting key performance indicator tree depicting project fault repair diagrams pdf to dispense important information. This template comprises three stages. It also presents valuable insights into the topics including customer interaction, managing the business, fixing the fault. This is a completely customizable PowerPoint theme that can be put to use immediately. So, download it and address the topic impactfully.

Business Framework How To Measure Key Performance Indicator PowerPoint Presentation
This Power Point diagram slide has been crafted with graphic of flower petal diagram. This PPT slide contains the concept of measuring the key performance and indicate it. Use this PPT slide for your management related presentation.
Project Key Performance Indicator Tree Illustrating Customer Satisfaction Icons PDF
Persuade your audience using this project key performance indicator tree illustrating customer satisfaction icons pdf. This PPT design covers four stages, thus making it a great tool to use. It also caters to a variety of topics including total customer complaints, total customer notifications, customer satisfaction project. Download this PPT design now to present a convincing pitch that not only emphasizes the topic but also showcases your presentation skills.
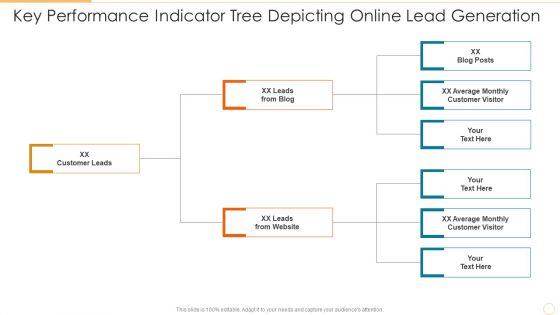
Key Performance Indicator Tree Depicting Online Lead Generation Information PDF
Persuade your audience using this key performance indicator tree depicting online lead generation information pdf. This PPT design covers three stages, thus making it a great tool to use. It also caters to a variety of topics including customer leads, leads from blog, leads from website. Download this PPT design now to present a convincing pitch that not only emphasizes the topic but also showcases your presentation skills.

Key Performance Indicator Tree For Application Performance Management Background PDF
Persuade your audience using this key performance indicator tree for application performance management background pdf. This PPT design covers six stages, thus making it a great tool to use. It also caters to a variety of topics including collaboration platforms, competency development, knowledge management programmers. Download this PPT design now to present a convincing pitch that not only emphasizes the topic but also showcases your presentation skills.
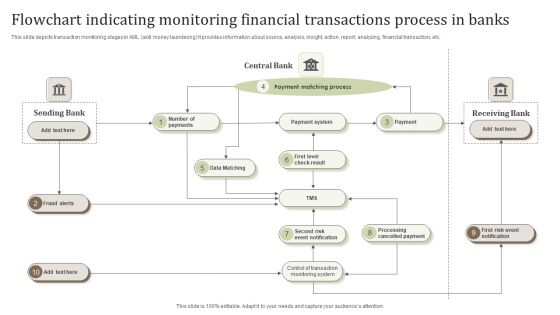
Flowchart Indicating Monitoring Financial Transactions Process In Banks Pictures PDF
This slide depicts transaction monitoring stages in AML anti money laundering It provides information about source, analysis, insight, action, report, analyzing, financial transaction, etc.Persuade your audience using this Flowchart Indicating Monitoring Financial Transactions Process In Banks Pictures PDF. This PPT design covers one stage, thus making it a great tool to use. It also caters to a variety of topics including Payment Matching Process, Cancelled Payment, Cancelled Payment. Download this PPT design now to present a convincing pitch that not only emphasizes the topic but also showcases your presentation skills.

Ppt Background 3d Illustration Of 5 Phase Diagram Partnership Transaction 6 Image
We present our PPT Background 3d illustration of 5 phase diagram partnership transaction 6 Image. Use our Arrows PowerPoint Templates because, It is a step by step process with levels rising at every stage. Use our Circle Charts PowerPoint Templates because, You have it all down to a T. Use our Shapes PowerPoint Templates because, Illustrate your ideas and imprint them in the minds of your team with this template. Use our Business PowerPoint Templates because; Break it all down to Key Result Areas. Use our Process and Flows PowerPoint Templates because, they are indicators of the path you have in mind. Use these PowerPoint slides for presentations relating to background, blog, business, chain, communication, connection, constructive, contact, design, diagonal, dialog, digital, flow, global, interaction, internet, line, linear, network, partner, pointer, reaction, social, stream, structure, system, team,. The prominent colors used in the PowerPoint template are Pink, Gray, and Black

3d Arrow Dilemma Of Puzzle Process 7 Stages Preparing Business Plan PowerPoint Slides
We present our 3d arrow dilemma of puzzle process 7 stages preparing business plan PowerPoint Slides.Use our Symbol PowerPoint Templates because you can Educate your listeners on the means to keep it ticking over. Download and present our Flow charts PowerPoint Templates because they are the indicators of the path you have in mind. Present our Arrows PowerPoint Templates because your brain is always churning out ideas like cogs in a wheel. Download our Puzzles or Jigsaws PowerPoint Templates because it gives you really bright ideas. Use our Business PowerPoint Templates because a brainwave has occurred to you after review. You know just how to push the graph skyward.Use these PowerPoint slides for presentations relating to 3d, Puzzle, Process, Arrow, Arrows, Block, Business, Chart, Design, Development, Diagram, Direction, Element, Flow, Flowchart, Graph, Linear, Management, Organization, Process, Program, Section, Sign, Solution, Symbol. The prominent colors used in the PowerPoint template are Yellow, Gray, Black. Professionals tell us our 3d arrow dilemma of puzzle process 7 stages preparing business plan PowerPoint Slides are Reminiscent. We assure you our Design PowerPoint templates and PPT Slides are Fancy. People tell us our 3d arrow dilemma of puzzle process 7 stages preparing business plan PowerPoint Slides are effectively colour coded to prioritise your plans They automatically highlight the sequence of events you desire. Customers tell us our Block PowerPoint templates and PPT Slides are Classic. Use our 3d arrow dilemma of puzzle process 7 stages preparing business plan PowerPoint Slides are One-of-a-kind. We assure you our Block PowerPoint templates and PPT Slides are Majestic.
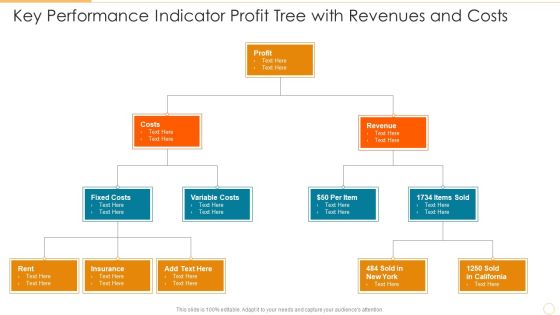
Key Performance Indicator Profit Tree With Revenues And Costs Template PDF
Presenting key performance indicator profit tree with revenues and costs template pdf to dispense important information. This template comprises three stages. It also presents valuable insights into the topics including costs, profit, revenue. This is a completely customizable PowerPoint theme that can be put to use immediately. So, download it and address the topic impactfully.

Organizational Key Performance Indicator Tree Depicting Market And Company Revenue Graphics PDF
Presenting organizational key performance indicator tree depicting market and company revenue graphics pdf to dispense important information. This template comprises three stages. It also presents valuable insights into the topics including total market revenue, company revenue, increase market share. This is a completely customizable PowerPoint theme that can be put to use immediately. So, download it and address the topic impactfully.
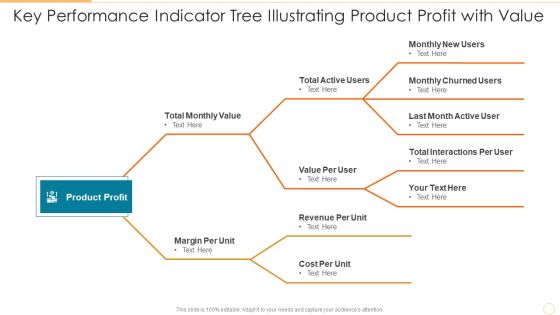
Key Performance Indicator Tree Illustrating Product Profit With Value Brochure PDF
Persuade your audience using this key performance indicator tree illustrating product profit with value brochure pdf. This PPT design covers three stages, thus making it a great tool to use. It also caters to a variety of topics including value per user, revenue per unit, cost per unit. Download this PPT design now to present a convincing pitch that not only emphasizes the topic but also showcases your presentation skills.
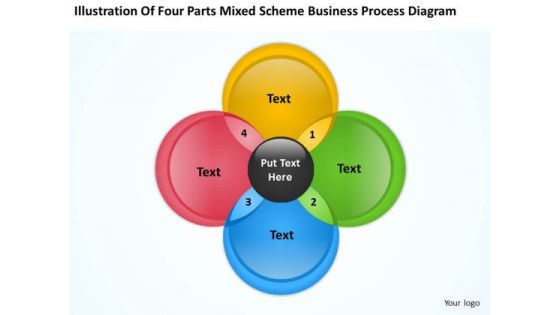
Mixed Scheme Business Process Diagram Creating Plan Step By PowerPoint Templates
We present our mixed scheme business process diagram creating plan step by PowerPoint templates.Download our Process and Flows PowerPoint Templates because Our PowerPoint Templates and Slides will give good value for money. They also have respect for the value of your time. Use our Flow Charts PowerPoint Templates because Our PowerPoint Templates and Slides will help you be quick off the draw. Just enter your specific text and see your points hit home. Download and present our Shapes PowerPoint Templates because Our PowerPoint Templates and Slides will generate and maintain the level of interest you desire. They will create the impression you want to imprint on your audience. Use our Business PowerPoint Templates because Our PowerPoint Templates and Slides will help you be quick off the draw. Just enter your specific text and see your points hit home. Use our Marketing PowerPoint Templates because These PowerPoint Templates and Slides will give the updraft to your ideas. See them soar to great heights with ease.Use these PowerPoint slides for presentations relating to Flow, process, schema, loop, turn, step, business, concept, vector, life, success, spectrum, rotation, recycling, diagram, circle, ring, graphic, propeller,pointer, idea, development, management, wheel, cycle, circulation, illustration, circular, system, strategy, round, research, range, iterative, center, direction, spiral,lifecycle, motion, method, quality, control, act, movement, blender, nature, mix, indicator. The prominent colors used in the PowerPoint template are Black, Yellow, Green.
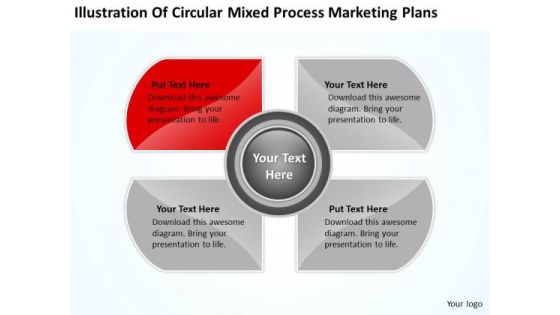
Circular Mixed Process Marketing Plans Ppt Laundromat Business PowerPoint Templates
We present our circular mixed process marketing plans ppt laundromat business PowerPoint templates.Download our Process and Flows PowerPoint Templates because our PowerPoint Templates and Slides will give your ideas the shape. Use our Flow Charts PowerPoint Templates because Our PowerPoint Templates and Slides are effectively colour coded to prioritise your plans They automatically highlight the sequence of events you desire. Download and present our Business PowerPoint Templates because It will get your audience in sync. Present our Marketing PowerPoint Templates because Our PowerPoint Templates and Slides will generate and maintain the level of interest you desire. They will create the impression you want to imprint on your audience. Use our Shapes PowerPoint Templates because you should once Tap the ingenuity of our PowerPoint Templates and Slides. They are programmed to succeed.Use these PowerPoint slides for presentations relating to Flow, process, step, business, concept, vector, success, diagram, circle, graphic, idea, development, management, illustration, circular, system, strategy, round, research, center, direction, method, quality, mix, indicator. The prominent colors used in the PowerPoint template are Red, Gray, White.

Mixed Process Marketing Plans Ppt Business Template Free PowerPoint Slides
We present our mixed process marketing plans ppt business template free PowerPoint Slides.Download our Process and Flows PowerPoint Templates because Our PowerPoint Templates and Slides will let you Leave a lasting impression to your audiences. They possess an inherent longstanding recall factor. Download our Flow Charts PowerPoint Templates because You have the co-ordinates for your destination of success. Let our PowerPoint Templates and Slides map out your journey. Present our Business PowerPoint Templates because our PowerPoint Templates and Slides are the string of your bow. Fire of your ideas and conquer the podium. Download and present our Marketing PowerPoint Templates because Our PowerPoint Templates and Slides are innately eco-friendly. Their high recall value negate the need for paper handouts. Use our Shapes PowerPoint Templates because Our PowerPoint Templates and Slides are designed to help you succeed. They have all the ingredients you need.Use these PowerPoint slides for presentations relating to Flow, process, step, business, concept, vector, success, diagram, circle, graphic, idea, development, management, illustration, circular, system, strategy, round, research, center, direction, method, quality, mix, indicator. The prominent colors used in the PowerPoint template are Blue, Gray, White.

Circular Mixed Process Marketing Plans Ppt Business Software Download PowerPoint Templates
We present our circular mixed process marketing plans ppt business software download PowerPoint templates.Present our Process and Flows PowerPoint Templates because Our PowerPoint Templates and Slides ensures Effective communication. They help you put across your views with precision and clarity. Use our Flow Charts PowerPoint Templates because you can Break through with our PowerPoint Templates and Slides. Bring down the mental barriers of your audience. Download our Business PowerPoint Templates because Our PowerPoint Templates and Slides will let you meet your Deadlines. Present our Marketing PowerPoint Templates because They will bring a lot to the table. Their alluring flavours will make your audience salivate. Download our Shapes PowerPoint Templates because Our PowerPoint Templates and Slides will let you Hit the target. Go the full distance with ease and elan.Use these PowerPoint slides for presentations relating to Flow, process, step, business, concept, vector, success, diagram, circle, graphic, idea, development, management, illustration, circular, system, strategy, round, research, center, direction, method, quality, mix, indicator. The prominent colors used in the PowerPoint template are Yellow, Gray, White.

Process Marketing Plans Ppt How To Start Business Writing PowerPoint Templates
We present our process marketing plans ppt how to start business writing PowerPoint templates.Use our Process and Flows PowerPoint Templates because It can Bubble and burst with your ideas. Present our Flow Charts PowerPoint Templates because Our PowerPoint Templates and Slides will fulfill your every need. Use them and effectively satisfy the desires of your audience. Present our Business PowerPoint Templates because Our PowerPoint Templates and Slides will let you Leave a lasting impression to your audiences. They possess an inherent longstanding recall factor. Present our Marketing PowerPoint Templates because It will Strengthen your hand with your thoughts. They have all the aces you need to win the day. Present our Shapes PowerPoint Templates because You can Hit the nail on the head with our PowerPoint Templates and Slides. Embed your ideas in the minds of your audience.Use these PowerPoint slides for presentations relating to Flow, process, step, business, concept, vector, success, diagram, circle, graphic, idea, development, management, illustration, circular, system, strategy, round, research, center, direction, method, quality, mix, indicator. The prominent colors used in the PowerPoint template are Green, Gray, White.

11 Diverging Arrows Multilple Concepts Diagram Circular Network PowerPoint Slides
We present our 11 diverging arrows multilple concepts diagram Circular Network PowerPoint Slides.Download and present our Signs PowerPoint Templates because our template will help pinpoint their viability. Download and present our Future PowerPoint Templates because the Venn graphic comprising interlinking circles geometrically demonstate how various functions operating independantly, to a large extent, are essentially interdependant. Download our Ring Charts PowerPoint Templates because they are Designed to attract the attention of your audience. Download our Business PowerPoint Templates because you are sure you have the right people for your plans. Download and present our Marketing PowerPoint Templates because customer satisfaction is a mantra of the marketplace. Building a loyal client base is an essential element of your business.Use these PowerPoint slides for presentations relating to Direction, flow, gradient, green,illustration, indicator, isolated, link, loop,mix, motion, movement, multicolored,orange, paint, pattern, pointer, purple,rainbow, range, recycling, rob, ring, rotation, round, sign, six, spectrum, spin, symbol,. The prominent colors used in the PowerPoint template are Green lime , Gray, Black. You can be sure our 11 diverging arrows multilple concepts diagram Circular Network PowerPoint Slides are Second to none. Professionals tell us our isolated PowerPoint templates and PPT Slides are Endearing. PowerPoint presentation experts tell us our 11 diverging arrows multilple concepts diagram Circular Network PowerPoint Slides are Beautiful. You can be sure our indicator PowerPoint templates and PPT Slides are Bold. You can be sure our 11 diverging arrows multilple concepts diagram Circular Network PowerPoint Slides are Appealing. The feedback we get is that our link PowerPoint templates and PPT Slides are Colorful.
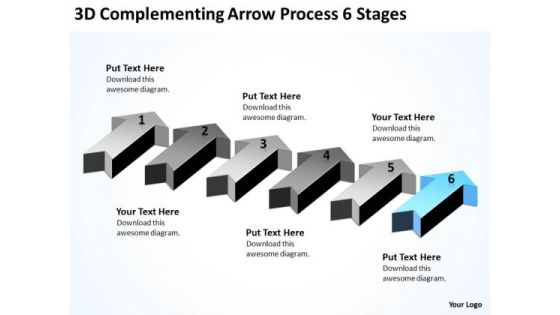
Advantage Of Parallel Processing 3d Complementing Arrow 6 Stages Ppt PowerPoint Slides
We present our advantage of parallel processing 3d complementing arrow 6 stages ppt PowerPoint Slides.Download and present our Arrows PowerPoint Templates because Our PowerPoint Templates and Slides ensures Effective communication. They help you put across your views with precision and clarity. Download our Flow Charts PowerPoint Templates because Our PowerPoint Templates and Slides are created with admirable insight. Use them and give your group a sense of your logical mind. Use our Marketing PowerPoint Templates because Our PowerPoint Templates and Slides are created with admirable insight. Use them and give your group a sense of your logical mind. Use our Business PowerPoint Templates because It will Strengthen your hand with your thoughts. They have all the aces you need to win the day. Download and present our Process and Flows PowerPoint Templates because Our PowerPoint Templates and Slides are conceived by a dedicated team. Use them and give form to your wondrous ideas.Use these PowerPoint slides for presentations relating to Arrow, completed, completion, concept, confirmation,design, flow, four, graphic, illustration, indication, indicator, information, layout, measurement, modern, number, one, order, phase, pointer, process, progress, purple, reflection, scale, send, set, shape, sign, two, violet, web, web design, websites, work flow. The prominent colors used in the PowerPoint template are Blue light, Black, Gray. The feedback we get is that our advantage of parallel processing 3d complementing arrow 6 stages ppt PowerPoint Slides are visually appealing. Professionals tell us our four PowerPoint templates and PPT Slides will save the presenter time. Use our advantage of parallel processing 3d complementing arrow 6 stages ppt PowerPoint Slides are visually appealing. Presenters tell us our confirmation PowerPoint templates and PPT Slides effectively help you save your valuable time. You can be sure our advantage of parallel processing 3d complementing arrow 6 stages ppt PowerPoint Slides will impress their bosses and teams. PowerPoint presentation experts tell us our design PowerPoint templates and PPT Slides are visually appealing.
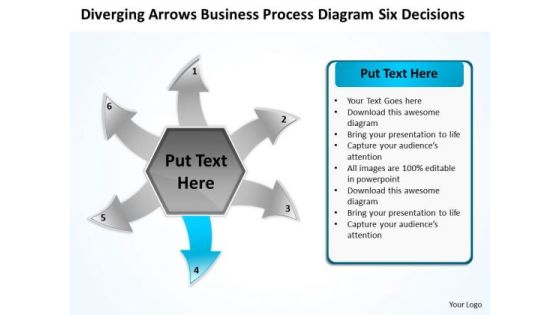
Business PowerPoint Theme Process Diagram Six Decisions Cycle Flow Network Slide
We present our business powerpoint theme process diagram six decisions Cycle Flow Network Slide.Download our Arrows PowerPoint Templates because they are the indicators of the path you have in mind. Download and present our Flow Charts PowerPoint Templates because These PowerPoint Templates and Slides will give the updraft to your ideas. See them soar to great heights with ease. Download and present our Process and Flows PowerPoint Templates because this slide shows each path to the smallest detail. Download our Business PowerPoint Templates because the majestic tiger lord of all it surveys.It exudes power even when it is in repose. Present our Marketing PowerPoint Templates because Our PowerPoint Templates and Slides are conceived by a dedicated team. Use them and give form to your wondrous ideas.Use these PowerPoint slides for presentations relating to Abstract, arrow, background, buttons,circle, clean, communication, concept,conceptual, design, diagram, direction,elements, exchange, flow, flowchart, graph,graphic, icon, illustration, internet, precise, process, sign, symbol, arrows, flows, process, business. The prominent colors used in the PowerPoint template are Blue , White, Black. Use our business powerpoint theme process diagram six decisions Cycle Flow Network Slide are Attractive. Professionals tell us our buttons PowerPoint templates and PPT Slides are Adorable. Customers tell us our business powerpoint theme process diagram six decisions Cycle Flow Network Slide are Whimsical. Presenters tell us our concept PowerPoint templates and PPT Slides are Ritzy. You can be sure our business powerpoint theme process diagram six decisions Cycle Flow Network Slide will impress their bosses and teams. PowerPoint presentation experts tell us our conceptual PowerPoint templates and PPT Slides are Vintage.
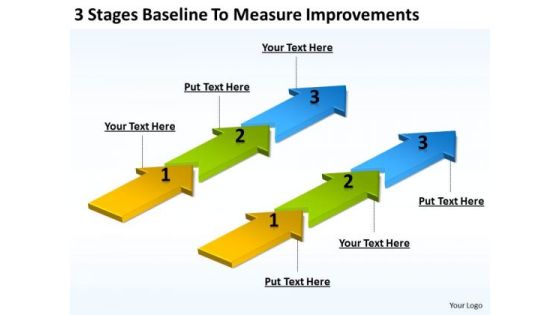
Arrows For Ppt Baseline To Measure Improvements PowerPoint Templates Backgrounds Slides
We present our arrows for ppt baseline to measure improvements PowerPoint templates backgrounds slides.Download our Flow charts PowerPoint Templates because Our PowerPoint Templates and Slides will let you Hit the target. Go the full distance with ease and elan. Use our Marketing PowerPoint Templates because It will mark the footprints of your journey. Illustrate how they will lead you to your desired destination. Present our Shapes PowerPoint Templates because They will Put your wonderful verbal artistry on display. Our PowerPoint Templates and Slides will provide you the necessary glam and glitter. Present our Arrows PowerPoint Templates because Our PowerPoint Templates and Slides will help you be quick off the draw. Just enter your specific text and see your points hit home. Download and present our Process and Flows PowerPoint Templates because Our PowerPoint Templates and Slides will embellish your thoughts. See them provide the desired motivation to your team.Use these PowerPoint slides for presentations relating to Arrow, Banner, Bar, Collection, Completion, Concept, Confirmation, Design, Flow, Graph, Graphic, Illustration, Indication, Information, Instruction, Interface, Internet, Layout, Measurement, Modern, Number, Order, Phase, Pointer, Process, Progress, Reflection, Scale, Shape, Stage, Status, Step, Template, Two, Vector, Web, Web Design, Web Design Elements, Websites, Work Flow. The prominent colors used in the PowerPoint template are Green, Blue, Yellow. Customers tell us our arrows for ppt baseline to measure improvements PowerPoint templates backgrounds slides are the best it can get when it comes to presenting. We assure you our Collection PowerPoint templates and PPT Slides are visually appealing. Use our arrows for ppt baseline to measure improvements PowerPoint templates backgrounds slides look good visually. You can be sure our Flow PowerPoint templates and PPT Slides are second to none. PowerPoint presentation experts tell us our arrows for ppt baseline to measure improvements PowerPoint templates backgrounds slides are readymade to fit into any presentation structure. The feedback we get is that our Design PowerPoint templates and PPT Slides effectively help you save your valuable time.

Illustration Of Colorful Diverging 8 Arrows Circular Flow Process PowerPoint Slides
We present our illustration of colorful diverging 8 arrows Circular Flow Process PowerPoint Slides.Use our Circle Charts PowerPoint Templates because the ideas and plans are on your finger tips. Use our Arrows PowerPoint Templates because this diagram has the unique ability to drive home your ideas and show how they mesh to guarantee success. Use our Process and Flows PowerPoint Templates because some opportunities are bound to be highly profitable for you to follow up. Download and present our Business PowerPoint Templates because watch the excitement levels rise as they realise their worth. Download and present our Shapes PowerPoint Templates because it Shines the light on your thoughts and motivates your team to improve the quality of celebration for all around you.Use these PowerPoint slides for presentations relating to Arrow, arrowheads, blue, button,cerulean, circle, circulation, cobalt,colorful, cyan, cycle, element,download, emblem, gray,shadow, green,icon, indicator, interface, internet, label,link, load, marker, motion, movement,navigationpanel, next, orientation, pagesite, pink, pointer, previous, process, red,reload, rotation, stained, sign, symbol,. The prominent colors used in the PowerPoint template are Yellow, Gray, Black. Customers tell us our illustration of colorful diverging 8 arrows Circular Flow Process PowerPoint Slides are Luxurious. Customers tell us our circle PowerPoint templates and PPT Slides are Nifty. Customers tell us our illustration of colorful diverging 8 arrows Circular Flow Process PowerPoint Slides are Pleasant. People tell us our cerulean PowerPoint templates and PPT Slides are Glamorous. Customers tell us our illustration of colorful diverging 8 arrows Circular Flow Process PowerPoint Slides are Fun. Customers tell us our blue PowerPoint templates and PPT Slides will make you look like a winner.
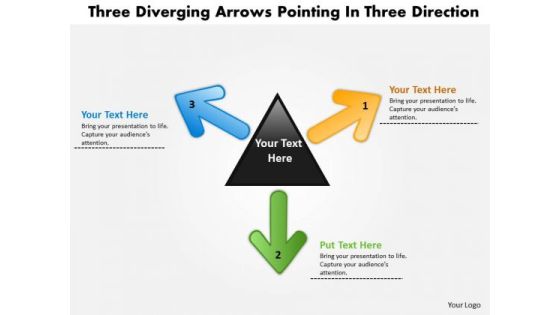
Three Diverging Arrows Pointing Direction Cycle Network PowerPoint Slides
We present our three diverging arrows pointing direction Cycle Network PowerPoint Slides.Download our Arrows PowerPoint Templates because getting it done may not be enough. Present our Triangles PowerPoint Templates because it unravels each one for your audience while setting key timelines as you go along. Present our Shapes PowerPoint Templates because this emphasises on the relevance and importance of all milestones along the way. Present our Business PowerPoint Templates because you have had a great year or so business wise. It is time to celebrate the efforts of your team. Present our Flow Charts PowerPoint Templates because they are Designed to attract the attention of your audience.Use these PowerPoint slides for presentations relating to arrow, arrowheads, badge, banner, blue, button, cerulean, cobalt, colored, colorful, connection, cursor, cyan, design element, designator, directional, download, emblem, gray shadow, green, icon, indicator, interface, internet, link, load, magenta, marker, navigation panel, next, orientation, page site, pictogram, pink, pointer, red, right, satined, sign, signpost, smooth, symbol, . The prominent colors used in the PowerPoint template are Orange, Green, Blue. Presenters tell us our three diverging arrows pointing direction Cycle Network PowerPoint Slides are designed by a team of presentation professionals. You can be sure our banner PowerPoint templates and PPT Slides are Festive. Professionals tell us our three diverging arrows pointing direction Cycle Network PowerPoint Slides are Graceful. People tell us our banner PowerPoint templates and PPT Slides are Gorgeous. People tell us our three diverging arrows pointing direction Cycle Network PowerPoint Slides are Multicolored. Professionals tell us our cerulean PowerPoint templates and PPT Slides are Nifty.

Advantage Of Parallel Processing 7 Stages Arrow Data Flow Diagram PowerPoint Slides
We present our advantage of parallel processing 7 stages arrow data flow diagram PowerPoint Slides.Download and present our Flow Charts PowerPoint Templates because Our PowerPoint Templates and Slides are conceived by a dedicated team. Use them and give form to your wondrous ideas. Download and present our Process and Flows PowerPoint Templates because Our PowerPoint Templates and Slides offer you the needful to organise your thoughts. Use them to list out your views in a logical sequence. Download and present our Arrows PowerPoint Templates because You can Channelise the thoughts of your team with our PowerPoint Templates and Slides. Urge them to focus on the goals you have set. Present our Marketing PowerPoint Templates because Our PowerPoint Templates and Slides will let your words and thoughts hit bullseye everytime. Use our Business PowerPoint Templates because Our PowerPoint Templates and Slides help you pinpoint your timelines. Highlight the reasons for your deadlines with their use.Use these PowerPoint slides for presentations relating to Arrow, completed, completion, concept, confirmation,design, flow, four, graphic, illustration, indication, indicator, information, layout, measurement, modern, number, one, order, phase, pointer, process, progress, purple, reflection, scale, send, set, shape, sign, two, violet, web, web design, websites, work flow. The prominent colors used in the PowerPoint template are Yellow, Gray, Black. The feedback we get is that our advantage of parallel processing 7 stages arrow data flow diagram PowerPoint Slides have awesome images to get your point across. Professionals tell us our flow PowerPoint templates and PPT Slides are designed to make your presentations professional. Use our advantage of parallel processing 7 stages arrow data flow diagram PowerPoint Slides have awesome images to get your point across. Presenters tell us our design PowerPoint templates and PPT Slides will make the presenter successul in his career/life. You can be sure our advantage of parallel processing 7 stages arrow data flow diagram PowerPoint Slides will make you look like a winner. PowerPoint presentation experts tell us our four PowerPoint templates and PPT Slides will help them to explain complicated concepts.
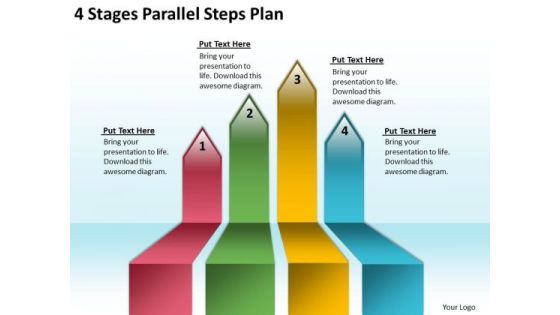
Arrows For PowerPoint Free 4 Stages Parallel Steps Plan Slides
We present our arrows for powerpoint free 4 stages parallel steps plan Slides.Use our Success PowerPoint Templates because They will bring a lot to the table. Their alluring flavours will make your audience salivate. Present our Marketing PowerPoint Templates because Our PowerPoint Templates and Slides will bullet point your ideas. See them fall into place one by one. Use our Arrows PowerPoint Templates because Our PowerPoint Templates and Slides are truly out of this world. Even the MIB duo has been keeping tabs on our team. Download and present our Flow charts PowerPoint Templates because Our PowerPoint Templates and Slides are specially created by a professional team with vast experience. They diligently strive to come up with the right vehicle for your brilliant Ideas. Download and present our Shapes PowerPoint Templates because You can Zap them with our PowerPoint Templates and Slides. See them reel under the impact.Use these PowerPoint slides for presentations relating to Arrow, Banner, Bar, Collection, Completion, Concept, Confirmation, Design, Flow, Graph, Graphic, Illustration, Indication, Information, Instruction, Interface, Internet, Layout, Measurement, Modern, Number, Order, Phase, Pointer, Process, Progress, Reflection, Scale, Shape, Stage, Status, Step, Template, Two, Vector, Web, Web Design, Web Design Elements, Websites, Work Flow. The prominent colors used in the PowerPoint template are Yellow, Red, Green. Customers tell us our arrows for powerpoint free 4 stages parallel steps plan Slides are readymade to fit into any presentation structure. We assure you our Bar PowerPoint templates and PPT Slides will save the presenter time. Use our arrows for powerpoint free 4 stages parallel steps plan Slides are topically designed to provide an attractive backdrop to any subject. You can be sure our Completion PowerPoint templates and PPT Slides will generate and maintain the level of interest you desire. They will create the impression you want to imprint on your audience. PowerPoint presentation experts tell us our arrows for powerpoint free 4 stages parallel steps plan Slides are topically designed to provide an attractive backdrop to any subject. The feedback we get is that our Confirmation PowerPoint templates and PPT Slides will generate and maintain the level of interest you desire. They will create the impression you want to imprint on your audience.
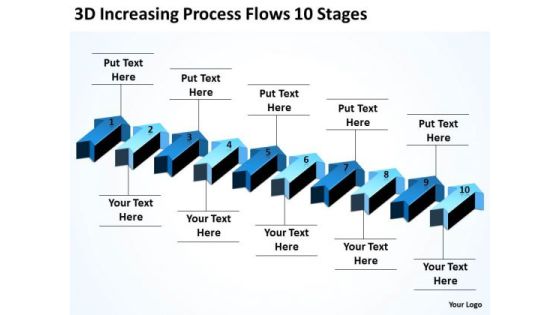
Arrows For Ppt Increasing Process Flows 10 Stages PowerPoint Templates Backgrounds Slides
We present our arrows for ppt increasing process flows 10 stages PowerPoint templates backgrounds slides.Use our Marketing PowerPoint Templates because you can Add colour to your speech with our PowerPoint Templates and Slides. Your presentation will leave your audience speechless. Download and present our Flow charts PowerPoint Templates because It will mark the footprints of your journey. Illustrate how they will lead you to your desired destination. Use our Shapes PowerPoint Templates because you should Whip up a frenzy with our PowerPoint Templates and Slides. They will fuel the excitement of your team. Download and present our Arrows PowerPoint Templates because Our PowerPoint Templates and Slides are focused like a searchlight beam. They highlight your ideas for your target audience. Download and present our Process and Flows PowerPoint Templates because You can Be the star of the show with our PowerPoint Templates and Slides. Rock the stage with your ideas.Use these PowerPoint slides for presentations relating to Arrow, Banner, Bar, Collection, Completion, Concept, Confirmation, Design, Flow, Graph, Graphic, Illustration, Indication, Information, Instruction, Interface, Internet, Layout, Measurement, Modern, Number, Order, Phase, Pointer, Process, Progress, Reflection, Scale, Shape, Stage, Status, Step, Template, Two, Vector, Web, Web Design, Web Design Elements, Websites, Work Flow. The prominent colors used in the PowerPoint template are Blue navy, Blue, Black. Customers tell us our arrows for ppt increasing process flows 10 stages PowerPoint templates backgrounds slides will help them to explain complicated concepts. We assure you our Flow PowerPoint templates and PPT Slides are readymade to fit into any presentation structure. Use our arrows for ppt increasing process flows 10 stages PowerPoint templates backgrounds slides are incredible easy to use. You can be sure our Confirmation PowerPoint templates and PPT Slides will help them to explain complicated concepts. PowerPoint presentation experts tell us our arrows for ppt increasing process flows 10 stages PowerPoint templates backgrounds slides will make the presenter look like a pro even if they are not computer savvy. The feedback we get is that our Confirmation PowerPoint templates and PPT Slides will help them to explain complicated concepts.
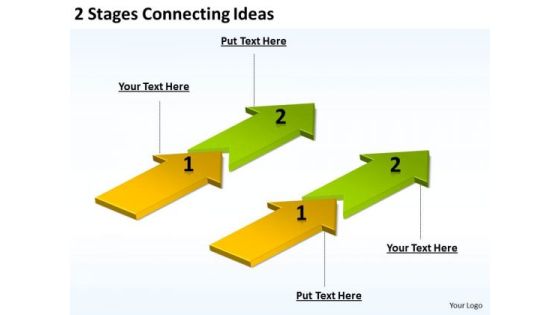
Arrows For PowerPoint 2 Stages Connecting Ideas Slides
We present our arrows for powerpoint 2 stages connecting ideas Slides.Use our Flow charts PowerPoint Templates because you can Set pulses racing with our PowerPoint Templates and Slides. They will raise the expectations of your team. Download and present our Marketing PowerPoint Templates because You can Double your output with our PowerPoint Templates and Slides. They make beating deadlines a piece of cake. Use our Shapes PowerPoint Templates because Our PowerPoint Templates and Slides are the chords of your song. String them along and provide the lilt to your views. Download our Arrows PowerPoint Templates because Our PowerPoint Templates and Slides come in all colours, shades and hues. They help highlight every nuance of your views. Download our Process and Flows PowerPoint Templates because It is Aesthetically crafted by artistic young minds. Our PowerPoint Templates and Slides are designed to display your dexterity.Use these PowerPoint slides for presentations relating to Arrow, Banner, Bar, Collection, Completion, Concept, Confirmation, Design, Flow, Graph, Graphic, Illustration, Indication, Information, Instruction, Interface, Internet, Layout, Measurement, Modern, Number, Order, Phase, Pointer, Process, Progress, Reflection, Scale, Shape, Stage, Status, Step, Template, Two, Vector, Web, Web Design, Web Design Elements, Websites, Work Flow. The prominent colors used in the PowerPoint template are Green, White, Black. Customers tell us our arrows for powerpoint 2 stages connecting ideas Slides are designed by a team of presentation professionals. We assure you our Concept PowerPoint templates and PPT Slides are readymade to fit into any presentation structure. Use our arrows for powerpoint 2 stages connecting ideas Slides will generate and maintain the level of interest you desire. They will create the impression you want to imprint on your audience. You can be sure our Concept PowerPoint templates and PPT Slides will impress their bosses and teams. PowerPoint presentation experts tell us our arrows for powerpoint 2 stages connecting ideas Slides will help them to explain complicated concepts. The feedback we get is that our Collection PowerPoint templates and PPT Slides provide you with a vast range of viable options. Select the appropriate ones and just fill in your text.
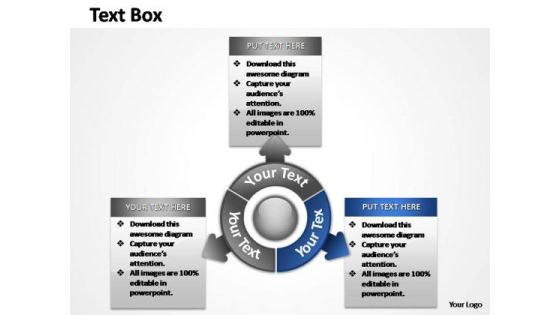
PowerPoint Theme Process Steps Ppt Presentation
Arrows Indicates the way to growth. Use this diagram for improved controls to drive your business towards the right direction
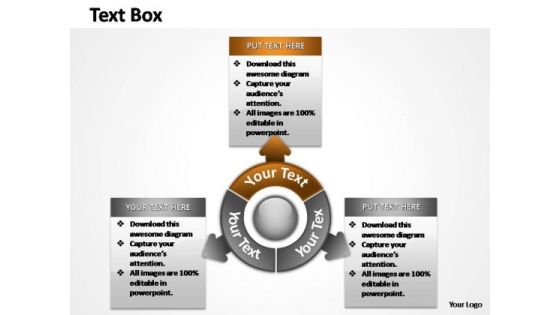
PowerPoint Slide Layout Strategy Steps Ppt Slide Designs
Arrows Indicates the way to growth. Use this diagram for improved controls to drive your business towards the right direction

Ppt Template Continous Way To Show 4 Stages Firm Process 1 Design
We present our PPT template continuous way to show 4 stages firm Process 1 design. Use our Advertising PowerPoint Templates because, they are indicators of the path you have in mind. Use our Business PowerPoint Templates because; now imprint them on the minds of your audience via our slides. Use our Shapes PowerPoint Templates because, Goal Pie Chart Template: - You have a clear vision of the cake you want. Use our Process and Flows PowerPoint Templates because, transmit your thoughts via our slides and prod your team to action. Use our Finance PowerPoint Templates because, the core of any organization is the people who work for it. Use these PowerPoint slides for presentations relating to Abstract, Algorithm, Arrow, Business, Chart, Color, Connection, Design, Development, Direction, Element, Flow, Graph, Linear, Management, Model, Organization, Plan, Process, Program, Section, Segment, Set, Sign, Solution, Strategy, Symbol, Technology. The prominent colors used in the PowerPoint template are Yellow, Blue, and Green
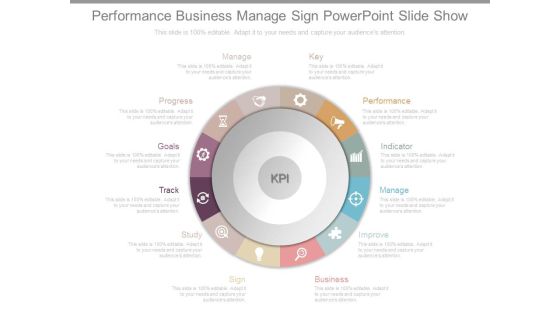
Performance Business Manage Sign Powerpoint Slide Show
This is a performance business manage sign powerpoint slide show. This is a twelve stage process. The stages in this process are key, performance, indicator, manage, improve, business, sign, study, track, goals, progress, manage, kpi.

 Home
Home