Financial Snapshot

Deploying Revitalization Strategy Enhance Product And Service Sales Product Reposition Dashboard Highlighting Brochure PDF
This slide highlights the product reposition dashboard which showcases market share in regions, emerging markets, after repositioning planned vs actual sales and product revenue by month. Do you have an important presentation coming up Are you looking for something that will make your presentation stand out from the rest Look no further than Deploying Revitalization Strategy Enhance Product And Service Sales Product Reposition Dashboard Highlighting Brochure PDF. With our professional designs, you can trust that your presentation will pop and make delivering it a smooth process. And with Slidegeeks, you can trust that your presentation will be unique and memorable. So why wait Grab Deploying Revitalization Strategy Enhance Product And Service Sales Product Reposition Dashboard Highlighting Brochure PDF today and make your presentation stand out from the rest.
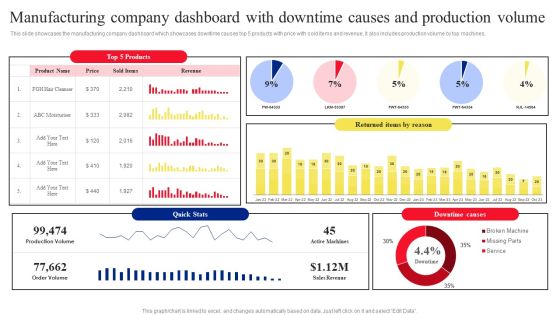
Manufacturing Company Dashboard With Downtime Causes And Production Volume Microsoft PDF
This slide showcases the manufacturing company dashboard which showcases downtime causes top 5 products with price with sold items and revenue, it also includes production volume by top machines. Explore a selection of the finest Manufacturing Company Dashboard With Downtime Causes And Production Volume Microsoft PDF here. With a plethora of professionally designed and pre made slide templates, you can quickly and easily find the right one for your upcoming presentation. You can use our Manufacturing Company Dashboard With Downtime Causes And Production Volume Microsoft PDF to effectively convey your message to a wider audience. Slidegeeks has done a lot of research before preparing these presentation templates. The content can be personalized and the slides are highly editable. Grab templates today from Slidegeeks.

Dashboard To Track Results Of Performance Marketing Ad Campaigns Ppt PowerPoint Presentation File Layouts PDF
This slide showcases dashboard that can help marketers to track and evaluate the outcomes of performance marketing ad campaigns. Its key elements are impressions, clicks, conversions, click through rate, cost per conversion, revenue per click etc. Do you have an important presentation coming up Are you looking for something that will make your presentation stand out from the rest Look no further than Dashboard To Track Results Of Performance Marketing Ad Campaigns Ppt PowerPoint Presentation File Layouts PDF. With our professional designs, you can trust that your presentation will pop and make delivering it a smooth process. And with Slidegeeks, you can trust that your presentation will be unique and memorable. So why wait Grab Dashboard To Track Results Of Performance Marketing Ad Campaigns Ppt PowerPoint Presentation File Layouts PDF today and make your presentation stand out from the rest.

Iot Integration In Manufacturing Predictive Analytics Dashboard To Track Manufacturing Operations Background PDF
This slide depicts the predictive analytics dashboard to track manufacturing operations, including production volume, order volume, active machines, sales revenue, top five products, downtime causes, production volume by top five machines, and so on. If you are looking for a format to display your unique thoughts, then the professionally designed Iot Integration In Manufacturing Predictive Analytics Dashboard To Track Manufacturing Operations Background PDF is the one for you. You can use it as a Google Slides template or a PowerPoint template. Incorporate impressive visuals, symbols, images, and other charts. Modify or reorganize the text boxes as you desire. Experiment with shade schemes and font pairings. Alter, share or cooperate with other people on your work. Download Iot Integration In Manufacturing Predictive Analytics Dashboard To Track Manufacturing Operations Background PDF and find out how to give a successful presentation. Present a perfect display to your team and make your presentation unforgettable.
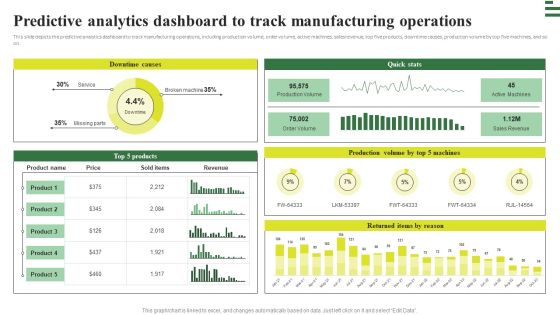
Transforming Manufacturing With Automation Predictive Analytics Dashboard To Track Diagrams PDF
This slide depicts the predictive analytics dashboard to track manufacturing operations, including production volume, order volume, active machines, sales revenue, top five products, downtime causes, production volume by top five machines, and so on. Get a simple yet stunning designed Transforming Manufacturing With Automation Predictive Analytics Dashboard To Track Diagrams PDF. It is the best one to establish the tone in your meetings. It is an excellent way to make your presentations highly effective. So, download this PPT today from Slidegeeks and see the positive impacts. Our easy to edit Transforming Manufacturing With Automation Predictive Analytics Dashboard To Track Diagrams PDF can be your go to option for all upcoming conferences and meetings. So, what are you waiting for Grab this template today.

Best Techniques For Agile Project Cost Assessment Dashboard To Track Cost Associated Formats PDF
This slide provides information regarding dashboard to track cost associated with project development in terms of total revenue, tasks by status, total vs actual project progress, etc. Do you have an important presentation coming up Are you looking for something that will make your presentation stand out from the rest Look no further than Best Techniques For Agile Project Cost Assessment Dashboard To Track Cost Associated Formats PDF. With our professional designs, you can trust that your presentation will pop and make delivering it a smooth process. And with Slidegeeks, you can trust that your presentation will be unique and memorable. So why wait Grab Best Techniques For Agile Project Cost Assessment Dashboard To Track Cost Associated Formats PDF today and make your presentation stand out from the rest

Key Activities For Human Capital Optimization In Organization Brochure PDF
Persuade your audience using this key activities for human capital optimization in organization brochure pdf. This PPT design covers four stages, thus making it a great tool to use. It also caters to a variety of topics including dashboard, evaluating, technical. Download this PPT design now to present a convincing pitch that not only emphasizes the topic but also showcases your presentation skills.

Stock Photo Business Development Strategy Template Send Mails On Internet Clipart Images
Get The Doers Into Action. Activate Them With Our Stock Photo Business Development Strategy Template Send Mails On Internet Clipart Images Powerpoint Templates. Put Your Money On Our business Powerpoint Templates. Your Ideas Will Rake In The Dollars.

Application Life Cycle Analysis Capital Assets Key Metrices For Asset Maintenance Guidelines PDF
Presenting this set of slides with name application life cycle analysis capital assets key metrices for asset maintenance guidelines pdf. This is a five stage process. The stages in this process are inventory, maintenance, budget, cost. This is a completely editable PowerPoint presentation and is available for immediate download. Download now and impress your audience.

Application Life Cycle Analysis Capital Assets Key Metrices For Asset Procurement Professional PDF
Presenting this set of slides with name application life cycle analysis capital assets key metrices for asset procurement professional pdf. This is a six stage process. The stages in this process are procurement, cost, administrative, lifecycle. This is a completely editable PowerPoint presentation and is available for immediate download. Download now and impress your audience.

Beauty Retail Company Revenue Allocation Pictures PDF
Showcasing this set of slides titled Beauty Retail Company Revenue Allocation Pictures PDF. The topics addressed in these templates are Beauty Retail, Company Revenue Allocation. All the content presented in this PPT design is completely editable. Download it and make adjustments in color, background, font etc. as per your unique business setting.

Stock Photo Golden Chess King Graphic PowerPoint Template
Get the doers into action. Activate them with our stock photo golden chess king graphic powerpoint template. Put your money on our Chess PowerPoint Templates. Your ideas will rake in the dollars. Put in a dollop of our Success PowerPoint Templates. Give your thoughts a distinctive flavour.
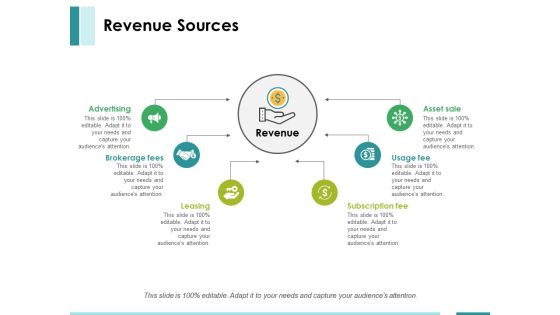
Revenue Sources Ppt PowerPoint Presentation Pictures Template
This is a revenue sources ppt powerpoint presentation pictures template. This is a six stage process. The stages in this process are advertising, asset sale, usage fee, leasing, subscription fee.
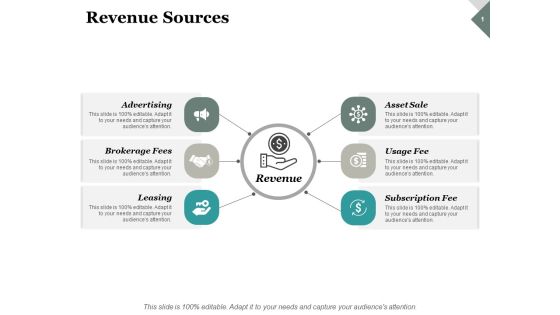
Revenue Sources Ppt PowerPoint Presentation Pictures Sample
This is a revenue sources ppt powerpoint presentation pictures sample. This is a six stage process. The stages in this process are advertising, leasing, asset sale, brokerage fees, subscription fees.
Dashboard To Track Results Of Performance Marketing Ad Campaigns Formats PDF
This slide showcases dashboard that can help marketers to track and evaluate the outcomes of performance marketing ad campaigns. Its key elements are impressions, clicks, conversions, click through rate, cost per conversion, revenue per click etc. Retrieve professionally designed Dashboard To Track Results Of Performance Marketing Ad Campaigns Formats PDF to effectively convey your message and captivate your listeners. Save time by selecting pre-made slideshows that are appropriate for various topics, from business to educational purposes. These themes come in many different styles, from creative to corporate, and all of them are easily adjustable and can be edited quickly. Access them as PowerPoint templates or as Google Slides themes. You do not have to go on a hunt for the perfect presentation because Slidegeeks got you covered from everywhere.
Digital Sales Metrics Showing Enhancement Icons PDF
The following slide represents statistics of online sales key performance indicators KPIs which can assist marketing manager to review their performance and take necessary steps. It include different metrics such as add to cart rate, conversion rate, and revenue per session. Showcasing this set of slides titled Digital Sales Metrics Showing Enhancement Icons PDF. The topics addressed in these templates are Quarterly Online Sales Metrics, Targeted Right Customers, Offered Product Recommendations. All the content presented in this PPT design is completely editable. Download it and make adjustments in color, background, font etc. as per your unique business setting.
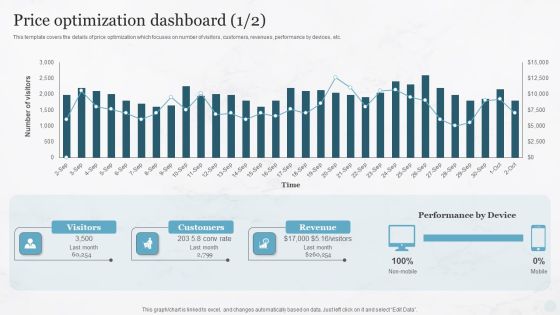
Price Optimization Dashboard Pricing Strategies For New Product In Market Infographics PDF
This template covers the details of price optimization which focuses on number of visitors, customers, revenues, performance by devices, etc.Find highly impressive Price Optimization Dashboard Pricing Strategies For New Product In Market Infographics PDF on Slidegeeks to deliver a meaningful presentation. You can save an ample amount of time using these presentation templates. No need to worry to prepare everything from scratch because Slidegeeks experts have already done a huge research and work for you. You need to download Price Optimization Dashboard Pricing Strategies For New Product In Market Infographics PDF for your upcoming presentation. All the presentation templates are 100precent editable and you can change the color and personalize the content accordingly. Download now.
Techniques To Boost Brand Awareness Dashboard For Tracking Brand Awareness Advertisement Rules PDF
This slide showcases dashboard that can help organization to track results of online advertisement components are ad Its key components are ad impressions, click through rate, cost per conversion, revenue per click, impressions, new users and sessions. Present like a pro with Techniques To Boost Brand Awareness Dashboard For Tracking Brand Awareness Advertisement Rules PDF Create beautiful presentations together with your team, using our easy-to-use presentation slides. Share your ideas in real-time and make changes on the fly by downloading our templates. So whether youre in the office, on the go, or in a remote location, you can stay in sync with your team and present your ideas with confidence. With Slidegeeks presentation got a whole lot easier. Grab these presentations today.
Playbook For Advancing Technology Managing It Services Spending Tracking Dashboard Clipart PDF
This slide provides information regarding the management of the digital services performance and IT spending tracking dashboard in terms of ROI, spend vs. budget, IT costs software, hardware, personnel and goals, IT spending in terms of revenues, etc. Are you in need of a template that can accommodate all of your creative concepts This one is crafted professionally and can be altered to fit any style. Use it with Google Slides or PowerPoint. Include striking photographs, symbols, depictions, and other visuals. Fill, move around, or remove text boxes as desired. Test out color palettes and font mixtures. Edit and save your work, or work with colleagues. Download Playbook For Advancing Technology Managing It Services Spending Tracking Dashboard Clipart PDF and observe how to make your presentation outstanding. Give an impeccable presentation to your group and make your presentation unforgettable.
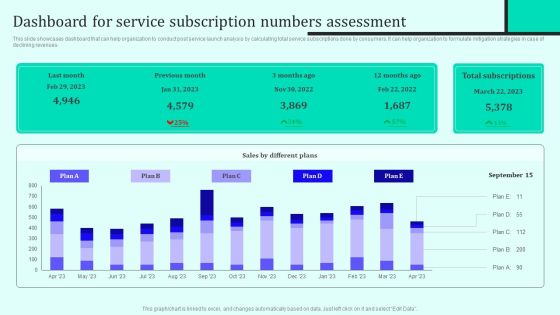
Implementing New Sales And Marketing Process For Services Dashboard For Service Subscription Diagrams PDF
This slide showcases dashboard that can help organization to conduct post service launch analysis by calculating total service subscriptions done by consumers. It can help organization to formulate mitigation strategies in case of declining revenues. Boost your pitch with our creative Implementing New Sales And Marketing Process For Services Dashboard For Service Subscription Diagrams PDF. Deliver an awe inspiring pitch that will mesmerize everyone. Using these presentation templates you will surely catch everyones attention. You can browse the ppts collection on our website. We have researchers who are experts at creating the right content for the templates. So you do not have to invest time in any additional work. Just grab the template now and use them.
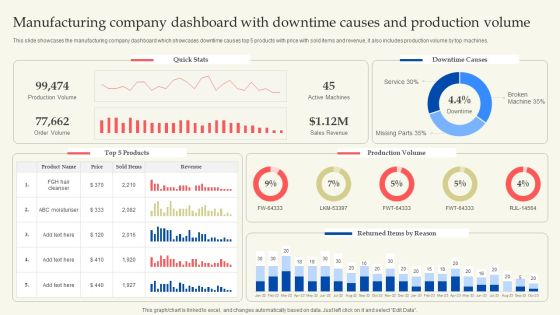
Manufacturing Company Dashboard With Downtime Causes And Production Volume Themes PDF
This slide showcases the manufacturing company dashboard which showcases downtime causes top 5 products with price with sold items and revenue, it also includes production volume by top machines. This Manufacturing Company Dashboard With Downtime Causes And Production Volume Themes PDF from Slidegeeks makes it easy to present information on your topic with precision. It provides customization options, so you can make changes to the colors, design, graphics, or any other component to create a unique layout. It is also available for immediate download, so you can begin using it right away. Slidegeeks has done good research to ensure that you have everything you need to make your presentation stand out. Make a name out there for a brilliant performance.
Maximizing Brand Growth With Umbrella Branding Activities Product Branding Performance Tracking Dashboard Elements PDF
This slide provides information regarding product branding performance tracking dashboard in terms of revenues, new customers, customer satisfaction rate. Are you in need of a template that can accommodate all of your creative concepts This one is crafted professionally and can be altered to fit any style. Use it with Google Slides or PowerPoint. Include striking photographs, symbols, depictions, and other visuals. Fill, move around, or remove text boxes as desired. Test out color palettes and font mixtures. Edit and save your work, or work with colleagues. Download Maximizing Brand Growth With Umbrella Branding Activities Product Branding Performance Tracking Dashboard Elements PDF and observe how to make your presentation outstanding. Give an impeccable presentation to your group and make your presentation unforgettable.

Dashboard To Track Results Of Performance Marketing Ad Campaigns Ppt PowerPoint Presentation File Ideas PDF
This slide showcases dashboard that can help marketers to track and evaluate the outcomes of performance marketing ad campaigns. Its key elements are impressions, clicks, conversions, click through rate, cost per conversion, revenue per click etc Coming up with a presentation necessitates that the majority of the effort goes into the content and the message you intend to convey. The visuals of a PowerPoint presentation can only be effective if it supplements and supports the story that is being told. Keeping this in mind our experts created Dashboard To Track Results Of Performance Marketing Ad Campaigns Ppt PowerPoint Presentation File Ideas PDF to reduce the time that goes into designing the presentation. This way, you can concentrate on the message while our designers take care of providing you with the right template for the situation.
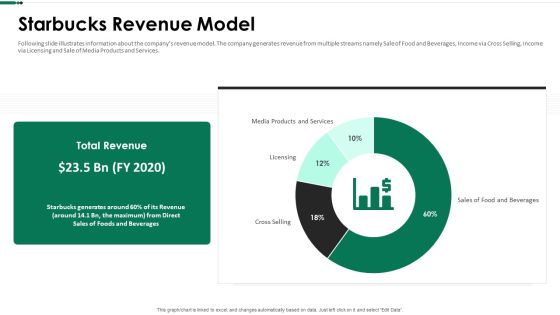
Starbucks Revenue Model Ppt Ideas Picture PDF
Following slide illustrates information about the companys revenue model. The company generates revenue from multiple streams namely Sale of Food and Beverages, Income via Cross Selling, Income via Licensing and Sale of Media Products and Services. Deliver an awe inspiring pitch with this creative starbucks revenue model ppt ideas picture pdf bundle. Topics like media products and services, sales of food and beverages, licensing, cross selling can be discussed with this completely editable template. It is available for immediate download depending on the needs and requirements of the user.

Stock Photo Pot Full With Gold And Green Hat PowerPoint Slide
This background image shows pot full with gold and green hat. Use this awesome image to make attractive presentations. Add this image to your presentation to visually support your content.
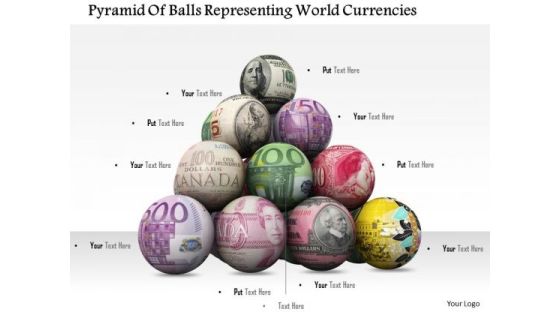
Stock Photo Global Currencies On Ball In Pyramid Shape PowerPoint Slide
Use this image of global currencies on balls in finance and business related topics. You can download this image of 3d pyramid of balls with global currencies design to make awesome presentations for global business.
Stock Photo Currencies Symbol In Front Of Desktop Screen PowerPoint Slide
This image slide displays currencies symbol in front of desktop. This image slide depicts finance and technology. Use this image slide, in your presentation to express views on finance and accounting. This image slide will help you make professional presentations.

Stock Photo Stack Of Red White Poker Chips For Gambling PowerPoint Slide
This unique power point slide has been crafted with red white poker chips. This image depicts the concept of success in game of gambling. Add this image in game and gambling related presentation and displays success concept visually.

Stock Photo 3d Us Map With Growth Arrow And Us Map PowerPoint Slide
This image displays American map with business graph in background. This image slide contains the concept of American economy, business growth and reports. Use this amazing slide to make professional presentations.
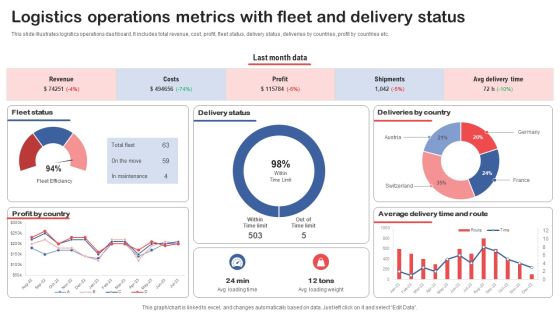
Logistics Operations Metrics With Fleet And Delivery Status Slides PDF
This slide illustrates logistics operations dashboard. It includes total revenue, cost, profit, fleet status, delivery status, deliveries by countries, profit by countries etc. Pitch your topic with ease and precision using this Logistics Operations Metrics With Fleet And Delivery Status Slides PDF. This layout presents information on Fleet Status, Delivery Status, Deliveries By Country. It is also available for immediate download and adjustment. So, changes can be made in the color, design, graphics or any other component to create a unique layout.

Data Driven Insurance Sales Procedure Boosting Revenue Sample PDF
The following slide highlights insurance sales cycle based on data for predictive analysis and real-time insights. It boost company sales. It includes components such as integrate front and back office, customer centric sales and improve renewal rates. Persuade your audience using this Data Driven Insurance Sales Procedure Boosting Revenue Sample PDF. This PPT design covers three stages, thus making it a great tool to use. It also caters to a variety of topics including Customer Centric Sales, Improve Renewal Rates, Revenue. Download this PPT design now to present a convincing pitch that not only emphasizes the topic but also showcases your presentation skills

Actual Vs Budgeted Gross And Net Revenue Comparison Report Sample PDF
This slide covers a profitability dashboard for analyzing gross margin and net profit metrics. It includes evaluation charts such as actual vs budgeted gross profit, net profit, trends, variance analysis table for the selected month and year. Pitch your topic with ease and precision using this Actual Vs Budgeted Gross And Net Revenue Comparison Report Sample PDF. This layout presents information on Gross Profit, Net Profit, Budget. It is also available for immediate download and adjustment. So, changes can be made in the color, design, graphics or any other component to create a unique layout.

KYC Transaction Monitoring System Business Security Suspicious Activity Reporting Process Flow Summary PDF
This slide showcases process flow of suspicious activity reporting SAR. It provides information about transaction alert, purpose, patterns, customer behavior, client lifestyle, negative news, adverse media, sanctions, anti money laundering AML, etc. Get a simple yet stunning designed KYC Transaction Monitoring System Business Security Suspicious Activity Reporting Process Flow Summary PDF. It is the best one to establish the tone in your meetings. It is an excellent way to make your presentations highly effective. So, download this PPT today from Slidegeeks and see the positive impacts. Our easy to edit KYC Transaction Monitoring System Business Security Suspicious Activity Reporting Process Flow Summary PDF can be your go to option for all upcoming conferences and meetings. So, what are you waiting for Grab this template today.
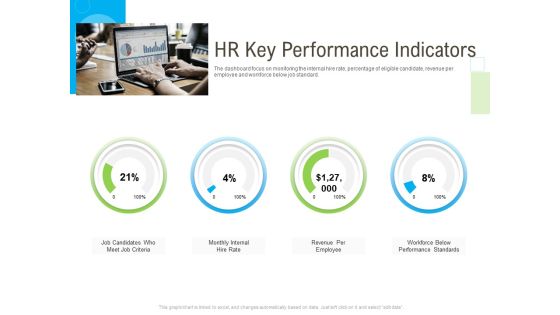
Rapid Innovation In HR Technology Space HR Key Performance Indicators Slides PDF
Deliver an awe inspiring pitch with this creative rapid innovation in hr technology space hr key performance indicators slides pdf bundle. Topics like criteria, workforce, performance, revenue, internal can be discussed with this completely editable template. It is available for immediate download depending on the needs and requirements of the user.
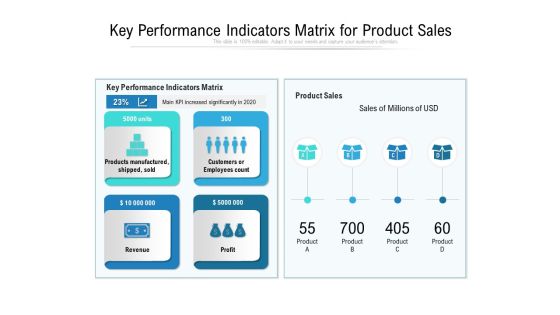
Key Performance Indicators Matrix For Product Sales Ppt PowerPoint Presentation File Clipart PDF
Presenting key performance indicators matrix for product sales ppt powerpoint presentation file clipart pdf to dispense important information. This template comprises four stages. It also presents valuable insights into the topics including manufactured, revenue, performance. This is a completely customizable PowerPoint theme that can be put to use immediately. So, download it and address the topic impactfully.

Ways To Save Money Ppt PowerPoint Presentation Pictures Graphics Download
This is a megaphone for business promotion ppt powerpoint presentation visual aids infographics. This is a stage process. The stages in this process are support, assistance, hand holding.
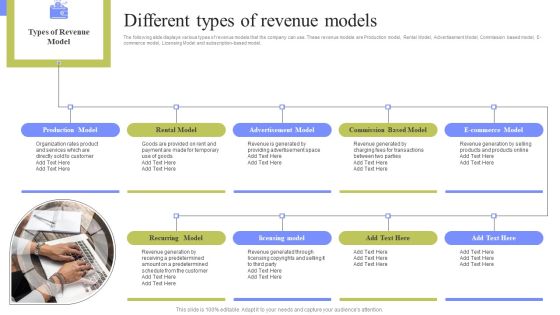
Periodic Revenue Model Different Types Of Revenue Models Summary PDF
The following slide displays various types of revenue models that the company can use. These revenue models are Production model, Rental Model, Advertisement Model, Commission based model, E-commerce model, Licensing Model and subscription-based model. Slidegeeks is here to make your presentations a breeze with Periodic Revenue Model Different Types Of Revenue Models Summary PDF With our easy to use and customizable templates, you can focus on delivering your ideas rather than worrying about formatting. With a variety of designs to choose from, you are sure to find one that suits your needs. And with animations and unique photos, illustrations, and fonts, you can make your presentation pop. So whether you are giving a sales pitch or presenting to the board, make sure to check out Slidegeeks first.
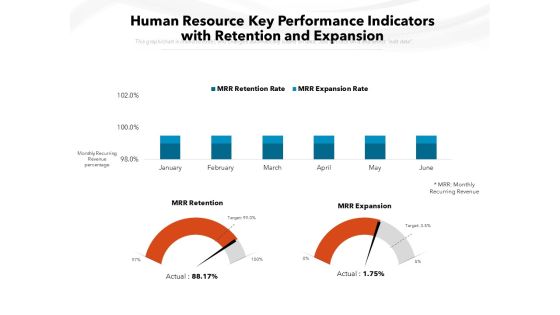
Human Resource Key Performance Indicators With Retention And Expansion Ppt PowerPoint Presentation File Background Designs PDF
Showcasing this set of slides titled human resource key performance indicators with retention and expansion ppt powerpoint presentation file background designs pdf. The topics addressed in these templates are revenue, retention, expansion. All the content presented in this PPT design is completely editable. Download it and make adjustments in color, background, font etc. as per your unique business setting.

Data Lake Development With Azure Cloud Software Use Cases Of Centralized Repository Data Lake Icons PDF
This slide depicts the use cases of data lakes such as data in place analytics, machine learning model training and archival and historical data storage. Presenting Data Lake Development With Azure Cloud Software Use Cases Of Centralized Repository Data Lake Icons PDF to provide visual cues and insights. Share and navigate important information on five stages that need your due attention. This template can be used to pitch topics like Business Metrics, Economic, Analysis. In addtion, this PPT design contains high resolution images, graphics, etc, that are easily editable and available for immediate download.

Formulating Branding Strategy To Enhance Revenue And Sales Kpis To Measure The Success Rate Of Advertising Icons PDF
The following slide outlines multiple key performance indicators used by the marketer to evaluate the effectiveness of an online advertisement campaign. The KPIs are likes, comments, shares, clickthrough rate CTR, open rate, bounce rate, article views, audience engagement rate and subscriber growth. Do you have to make sure that everyone on your team knows about any specific topic I yes, then you should give Formulating Branding Strategy To Enhance Revenue And Sales Kpis To Measure The Success Rate Of Advertising Icons PDF a try. Our experts have put a lot of knowledge and effort into creating this impeccable Formulating Branding Strategy To Enhance Revenue And Sales Kpis To Measure The Success Rate Of Advertising Icons PDF. You can use this template for your upcoming presentations, as the slides are perfect to represent even the tiniest detail. You can download these templates from the Slidegeeks website and these are easy to edit. So grab these today.

Data Monetization Approach To Drive Business Growth Assessing Data Monetization Revenue Model And Suitability Pictures PDF
This slide covers details about analysis of different monetization revenue model and crucial success factors associated to such models. Firm can choose the monetization model based on its suitability. This Data Monetization Approach To Drive Business Growth Assessing Data Monetization Revenue Model And Suitability Pictures PDF from Slidegeeks makes it easy to present information on your topic with precision. It provides customization options, so you can make changes to the colors, design, graphics, or any other component to create a unique layout. It is also available for immediate download, so you can begin using it right away. Slidegeeks has done good research to ensure that you have everything you need to make your presentation stand out. Make a name out there for a brilliant performance.

Customer Goods Production Company Materiality Matrix Assessment With Economic Icons PDF
This slide highlights the materiality matrix assessment which includes climate products, consumer health and safety, anti corruption, learning and development, human rights and product packaging and labelling. Slidegeeks is here to make your presentations a breeze with Customer Goods Production Company Materiality Matrix Assessment With Economic Icons PDF With our easy-to-use and customizable templates, you can focus on delivering your ideas rather than worrying about formatting. With a variety of designs to choose from, youre sure to find one that suits your needs. And with animations and unique photos, illustrations, and fonts, you can make your presentation pop. So whether youre giving a sales pitch or presenting to the board, make sure to check out Slidegeeks first.

Analyzing The Economic Detailed Components In An Operational Feasibility Study Designs PDF
This slide shows the detailed elements that are included in an operational feasibility study for the project such as how adequate are the current procedures and practices, will the project tool be cost effective and is the tool flexible enough for its usage. Slidegeeks is here to make your presentations a breeze with Analyzing The Economic Detailed Components In An Operational Feasibility Study Designs PDF With our easy-to-use and customizable templates, you can focus on delivering your ideas rather than worrying about formatting. With a variety of designs to choose from, youre sure to find one that suits your needs. And with animations and unique photos, illustrations, and fonts, you can make your presentation pop. So whether youre giving a sales pitch or presenting to the board, make sure to check out Slidegeeks first.
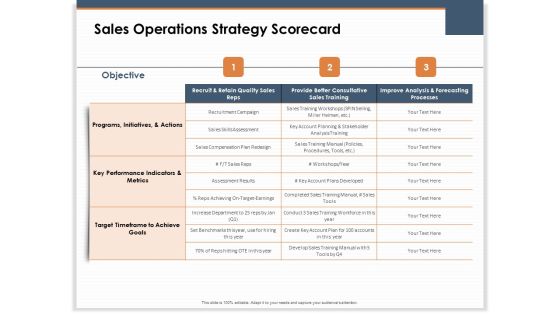
Main Revenues Progress Levers For Each Firm And Sector Sales Operations Strategy Scorecard Introduction PDF
Presenting this set of slides with name main revenues progress levers for each firm and sector sales operations strategy scorecard introduction pdf. The topics discussed in these slides are objective, programs, initiatives, and actions, key performance indicators and metrics, target timeframe to achieve goals. This is a completely editable PowerPoint presentation and is available for immediate download. Download now and impress your audience.
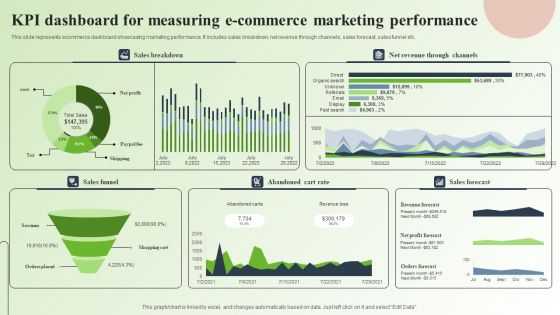
Strategic Guide For Mastering E Commerce Marketing Kpi Dashboard For Measuring E Commerce Marketing Performance Infographics PDF
This slide represents ecommerce dashboard showcasing marketing performance. It includes sales breakdown, net revenue through channels, sales forecast, sales funnel etc. Slidegeeks is here to make your presentations a breeze with Strategic Guide For Mastering E Commerce Marketing Kpi Dashboard For Measuring E Commerce Marketing Performance Infographics PDF With our easy to use and customizable templates, you can focus on delivering your ideas rather than worrying about formatting. With a variety of designs to choose from, you are sure to find one that suits your needs. And with animations and unique photos, illustrations, and fonts, you can make your presentation pop. So whether you are giving a sales pitch or presenting to the board, make sure to check out Slidegeeks first.

Software Implementation Technique Key Performance Indicators Highlighting Current Problems Elements PDF
This slide represents the key performance indicators to track the problems faced by organization and draw effective strategies to tackle the problems. It includes key performance indicators of decline in organizational sales and customer engagement rate. Make sure to capture your audiences attention in your business displays with our gratis customizable Software Implementation Technique Key Performance Indicators Highlighting Current Problems Elements PDF. These are great for business strategies, office conferences, capital raising or task suggestions. If you desire to acquire more customers for your tech business and ensure they stay satisfied, create your own sales presentation with these plain slides.

Ecommerce Operations Management Metrics To Measure Performance Professional PDF
This slide showcases essential metrics of e-commerce to make informed decisions. Major key performance indicators covered are website traffic, shopping cart abandonment rate, revenue per visitor and on time delivery rate. Presenting Ecommerce Operations Management Metrics To Measure Performance Professional PDF to dispense important information. This template comprises one stage. It also presents valuable insights into the topics including Abandonment Rate, Industry Benchmark, Performance. This is a completely customizable PowerPoint theme that can be put to use immediately. So, download it and address the topic impactfully.
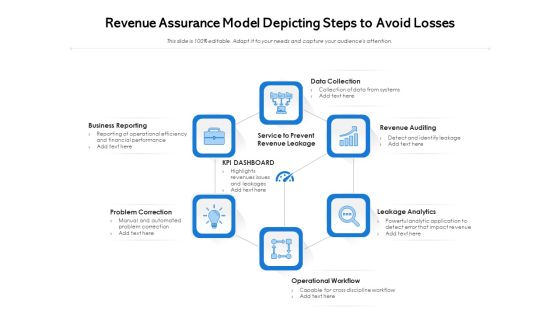
Revenue Assurance Model Depicting Steps To Avoid Losses Ppt PowerPoint Presentation Model Deck PDF
Presenting revenue assurance model depicting steps to avoid losses ppt powerpoint presentation model deck pdf to dispense important information. This template comprises six stages. It also presents valuable insights into the topics including data collection, revenue auditing, leakage analytics, operational workflow, problem correction, business reporting, service to prevent revenue leakage. This is a completely customizable PowerPoint theme that can be put to use immediately. So, download it and address the topic impactfully.

Guide For Marketing Analytics To Improve Decisions Present And Previous Marketing Data Analysis Rules PDF
The following slide showcases comparative analysis of yearly performance to compare past results with current and determine success and failure factors. It includes elements such as revenue, sales, conversions, page views, net income, number of units sole etc. Formulating a presentation can take up a lot of effort and time, so the content and message should always be the primary focus. The visuals of the PowerPoint can enhance the presenters message, so our Guide For Marketing Analytics To Improve Decisions Present And Previous Marketing Data Analysis Rules PDF was created to help save time. Instead of worrying about the design, the presenter can concentrate on the message while our designers work on creating the ideal templates for whatever situation is needed. Slidegeeks has experts for everything from amazing designs to valuable content, we have put everything into Guide For Marketing Analytics To Improve Decisions Present And Previous Marketing Data Analysis Rules PDF
Revenue Split By Product Segment Template Ppt PowerPoint Presentation Icon Graphics Download
This is a revenue split by product segment template ppt powerpoint presentation icon graphics download. This is a four stage process. The stages in this process are table, business, marketing, data, management.

Stock Photo Euro Symbol On Missing Puzzle Piece PowerPoint Slide
This image slide contains graphic of euro symbol on missing puzzle piece. This layout helps you to portray concepts related to finance, money, and business strategy. Streamline the flow of information across the board.
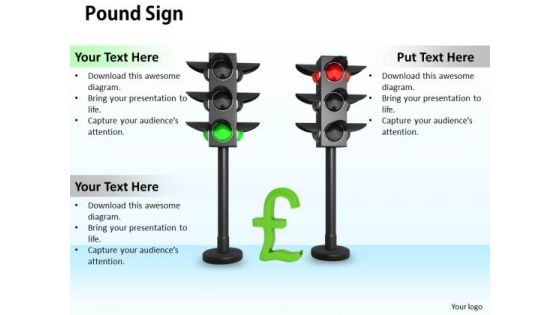
Stock Photo Pound Sign In Traffic Lights PowerPoint Slide
Use this image in money and finance related topics. To define this concept we have used graphic of pound symbol in traffic lights. Use this image in your business related presentations to explain the concept in visual manner.
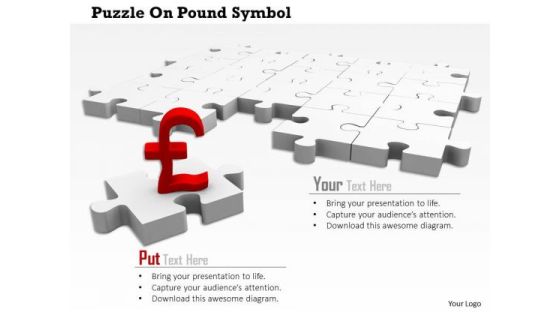
Stock Photo Pound Symbol On Missing Puzzle Piece PowerPoint Slide
Use this image in money and finance related topics. To define this concept we have used graphic of pound symbol on missing puzzle piece. Use this image in your business related presentations to explain the concept in visual manner.

Stock Photo Red Yen Symbol On Puzzle Piece PowerPoint Slide
Use this image in money and finance related topics. To define this concept we have used graphic of yen symbol on puzzle piece. Use this image in your business related presentations to explain the concept in visual manner.

Stock Photo Rupee Symbol On Missing Puzzle Piece PowerPoint Slide
Use this image in money and finance related topics. To define this concept we have used graphic of rupee symbol on missing puzzle piece. Use this image in your business related presentations to explain the concept in visual manner.

Upselling And Cross Selling Strategies To Boost Revenue Pictures PDF
The following slide outlines different upselling and cross-selling techniques through which companies can increase product sales, improve customer satisfaction, and enhance brand loyalty. The techniques mentioned in slide are bundle deals, highlight benefits, limited time offers, social proof, customized recommendations, and financing options. Make sure to capture your audiences attention in your business displays with our gratis customizable Upselling And Cross Selling Strategies To Boost Revenue Pictures PDF. These are great for business strategies, office conferences, capital raising or task suggestions. If you desire to acquire more customers for your tech business and ensure they stay satisfied, create your own sales presentation with these plain slides.

Stock Photo Piggy With Folder And Dollar Symbol PowerPoint Slide
Explain the concept of saving money with this unique image. To define this concept we have used graphic of piggy banks with folder and dollar symbol. Use this image in your business related presentations to explain the concept in visual manner.

Kpis To Measure Success Of Market Expansion Efforts Portrait PDF
This slide illustrates major key performing indicators that are used by marketers and top managers to track the effectiveness and success of market development efforts. The key performance indicators market share, revenue growth, distribution channel effectiveness rate, customer retention rate, return on investment. Showcasing this set of slides titled Kpis To Measure Success Of Market Expansion Efforts Portrait PDF. The topics addressed in these templates are Revenue Growth, Market Share, Return On Investment. All the content presented in this PPT design is completely editable. Download it and make adjustments in color, background, font etc. as per your unique business setting.

Agriculture Budgeting Kpis For Effective Management Professional PDF
This slide consists of major key performing indicators that can be used for effective planning and farm budgeting. Major key performance indicators are gross revenue, cost of goods sold, operating expenses, etc. Pitch your topic with ease and precision using this Agriculture Budgeting Kpis For Effective Management Professional PDF. This layout presents information on Gross Revenue, Operating Expenses, Net Income. It is also available for immediate download and adjustment. So, changes can be made in the color, design, graphics or any other component to create a unique layout.

Airtable Capital Funding Pitch Deck Competitive Analysis Icons PDF
This slide covers competitive analysis of cloud database platform for creating and sharing relation data and build up teams to ease workflows. It involves major companies along with its revenue. Boost your pitch with our creative Airtable Capital Funding Pitch Deck Competitive Analysis Icons PDF. Deliver an awe-inspiring pitch that will mesmerize everyone. Using these presentation templates you will surely catch everyones attention. You can browse the ppts collection on our website. We have researchers who are experts at creating the right content for the templates. So you do not have to invest time in any additional work. Just grab the template now and use them.
 Home
Home