Financial Snapshot

Key Performance Indicators Of XYZ Logistics Company With Future Targets Ppt Summary Good PDF
The slide shows the key Performance Indicator KPIs which will help the company to track the success rate of implemented strategies. Some of the KPIs are On Time Shipping, Customer Back Order Rate, Inventory Turnover Ratio, Number Of Shipments, Average Cycle Time in Days On Time Delivery etc. Deliver an awe inspiring pitch with this creative key performance indicators of xyz logistics company with future targets ppt summary good pdf bundle. Topics like company revenue, on time shipping, on time delivery, transportation costs, inventory turnover ratio, average cycle time can be discussed with this completely editable template. It is available for immediate download depending on the needs and requirements of the user.
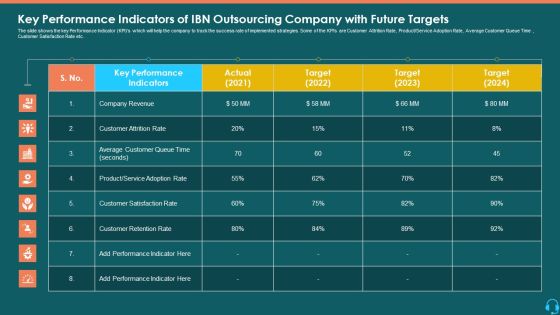
Key Performance Indicators Of IBN Outsourcing Company With Future Targets Template PDF
The slide shows the key Performance Indicator KPIs which will help the company to track the success rate of implemented strategies. Some of the KPIs are Customer Attrition Rate, Product or Service Adoption Rate, Average Customer Queue Time, Customer Satisfaction Rate etc. Deliver an awe-inspiring pitch with this creative key performance indicators of ibn outsourcing company with future targets template pdf bundle. Topics like company revenue, customer retention rate, customer satisfaction rate can be discussed with this completely editable template. It is available for immediate download depending on the needs and requirements of the user.
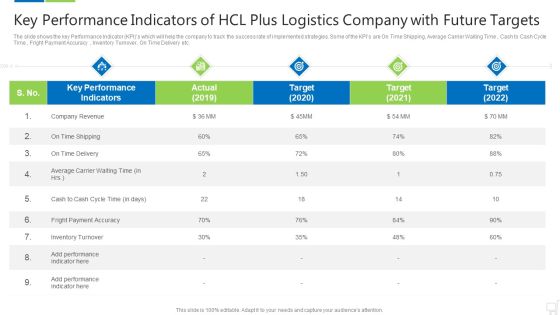
Key Performance Indicators Of Hcl Plus Logistics Company With Future Targets Brochure PDF
The slide shows the key Performance Indicator KPIs which will help the company to track the success rate of implemented strategies. Some of the KPIs are On Time Shipping, Average Carrier Waiting Time, Cash to Cash Cycle Time, Fright Payment Accuracy, Inventory Turnover, On Time Delivery etc. Deliver an awe inspiring pitch with this creative key performance indicators of hcl plus logistics company with future targets brochure pdf bundle. Topics like company revenue, average carrier waiting time, fright payment accuracy can be discussed with this completely editable template. It is available for immediate download depending on the needs and requirements of the user.
Initiatives To Produce Effective Concept For Logistic Firm Key Performance Indicators Icons PDF
The slide shows the key Performance Indicator KPIs which will help the company to track the success rate of implemented strategies. Some of the KPIs are On Time Shipping, Average Carrier Waiting Time , Cash to Cash Cycle Time , Fright Payment Accuracy , Inventory Turnover, On Time Delivery etc. Deliver an awe inspiring pitch with this creative initiatives to produce effective concept for logistic firm key performance indicators icons pdf bundle. Topics like payment, inventory turnover, revenue, target can be discussed with this completely editable template. It is available for immediate download depending on the needs and requirements of the user.

Stock Photo Stacks Of Dollar Coins PowerPoint Slide
This image contains stack of dollar coins. Use this image in finance and money related topics. Pass your ideas through this image slide in relation to profit growth. It will amplify your brilliance.

Stock Photo American Banknotes Falling From Hat PowerPoint Slide
Use this professional image in finance and money related topics. This image depicts graphics of American bank notes falling from a hat. Make an outstanding presentation with this unique image slide.

Boosting Yearly Business Revenue Quarterly Sales Goals With Key Metrics Demonstration PDF
This slide can be used by sales managers to represents sales goals per quarter using various metrics. It includes metrics such as sales growth, customer acquisition cost, sales cycle length, customer churn rate, average revenue per unit, etc. Do you have an important presentation coming up Are you looking for something that will make your presentation stand out from the rest Look no further than Boosting Yearly Business Revenue Quarterly Sales Goals With Key Metrics Demonstration PDF. With our professional designs, you can trust that your presentation will pop and make delivering it a smooth process. And with Slidegeeks, you can trust that your presentation will be unique and memorable. So why wait Grab Boosting Yearly Business Revenue Quarterly Sales Goals With Key Metrics Demonstration PDF today and make your presentation stand out from the rest.
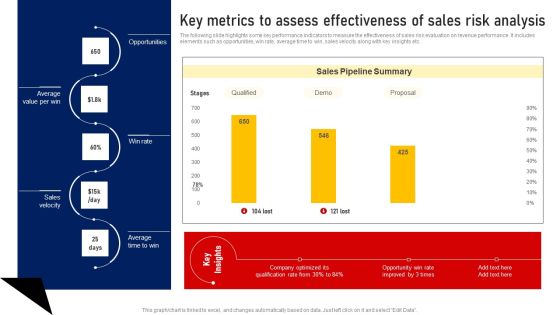
Performing Sales Risk Analysis Procedure Key Metrics To Assess Effectiveness Of Sales Risk Analysis Brochure PDF
The following slide highlights some key performance indicators to measure the effectiveness of sales risk evaluation on revenue performance. It includes elements such as opportunities, win rate, average time to win, sales velocity along with key insights etc. Get a simple yet stunning designed Performing Sales Risk Analysis Procedure Key Metrics To Assess Effectiveness Of Sales Risk Analysis Brochure PDF. It is the best one to establish the tone in your meetings. It is an excellent way to make your presentations highly effective. So, download this PPT today from Slidegeeks and see the positive impacts. Our easy to edit Performing Sales Risk Analysis Procedure Key Metrics To Assess Effectiveness Of Sales Risk Analysis Brochure PDF can be your go to option for all upcoming conferences and meetings. So, what are you waiting for Grab this template today.

Cios Guide To Optimize Determine IT Department Cost Management Dashboard Ideas PDF
This slide provides information regarding IT department cost management dashboard including KPIs such as return on investment of IT department, spend vs. budget, IT cost breakdown and IT costs vs. revenues. Find highly impressive Cios Guide To Optimize Determine IT Department Cost Management Dashboard Ideas PDF on Slidegeeks to deliver a meaningful presentation. You can save an ample amount of time using these presentation templates. No need to worry to prepare everything from scratch because Slidegeeks experts have already done a huge research and work for you. You need to download Cios Guide To Optimize Determine IT Department Cost Management Dashboard Ideas PDF for your upcoming presentation. All the presentation templates are 100 percent editable and you can change the color and personalize the content accordingly. Download now.

IT Cost Reduction Strategies Determine IT Department Cost Management Dashboard Guidelines PDF
This slide provides information regarding IT department cost management dashboard including KPIs such as return on investment of IT department, spend vs. budget, IT cost breakdown and IT costs vs. revenues. Get a simple yet stunning designed IT Cost Reduction Strategies Determine IT Department Cost Management Dashboard Guidelines PDF. It is the best one to establish the tone in your meetings. It is an excellent way to make your presentations highly effective. So, download this PPT today from Slidegeeks and see the positive impacts. Our easy-to-edit IT Cost Reduction Strategies Determine IT Department Cost Management Dashboard Guidelines PDF can be your go-to option for all upcoming conferences and meetings. So, what are you waiting for Grab this template today.

Comprehensive Sports Event Marketing Plan Sports Event Marketing KPI Dashboard Introduction PDF
This slide represents KPI dashboard to measure and monitor the performance of sports event marketing. It includes details related to KPIs such as revenue, attendance etc. in last 5 games. Do you have to make sure that everyone on your team knows about any specific topic I yes, then you should give Comprehensive Sports Event Marketing Plan Sports Event Marketing KPI Dashboard Introduction PDF a try. Our experts have put a lot of knowledge and effort into creating this impeccable Comprehensive Sports Event Marketing Plan Sports Event Marketing KPI Dashboard Introduction PDF. You can use this template for your upcoming presentations, as the slides are perfect to represent even the tiniest detail. You can download these templates from the Slidegeeks website and these are easy to edit. So grab these today
Improving Buyer Journey Through Strategic Customer Engagement Social Media Engagement Tracking Dashboard Structure PDF
This slide showcases a dashboard highlighting the customer engagement through social sites. it includes KPIs such as total website traffics, site revenue, fans count and followers Find highly impressive Improving Buyer Journey Through Strategic Customer Engagement Social Media Engagement Tracking Dashboard Structure PDF on Slidegeeks to deliver a meaningful presentation. You can save an ample amount of time using these presentation templates. No need to worry to prepare everything from scratch because Slidegeeks experts have already done a huge research and work for you. You need to download Improving Buyer Journey Through Strategic Customer Engagement Social Media Engagement Tracking Dashboard Structure PDF for your upcoming presentation. All the presentation templates are 100 percent editable and you can change the color and personalize the content accordingly. Download now

Marketing Analytics Measurement Procedure With Success Rate Guidelines PDF
This slide showcases performance indicators of marketing required by organizations to analyze data to reach a end goals. Key metrics included are attributing social and content to revenue, aligning business goal and marketing, conversion of leads to revenue and data collection and analysis. Showcasing this set of slides titled Marketing Analytics Measurement Procedure With Success Rate Guidelines PDF. The topics addressed in these templates areMarketing Analytics Measurement, Procedure With Success Rate. All the content presented in this PPT design is completely editable. Download it and make adjustments in color, background, font etc. as per your unique business setting.

Streamlining Manufacturing Processes With Workflow Automation Business Management Workflow Automation Dashboard Portrait PDF
This slide presents the graphical representation of business management dashboard via workflow automation software. It includes annual revenue analysis, annual profit analysis, quotation, estimated income, monthly project revenue, upcoming event schedule, etc. Slidegeeks is one of the best resources for PowerPoint templates. You can download easily and regulate Streamlining Manufacturing Processes With Workflow Automation Business Management Workflow Automation Dashboard Portrait PDF for your personal presentations from our wonderful collection. A few clicks is all it takes to discover and get the most relevant and appropriate templates. Use our Templates to add a unique zing and appeal to your presentation and meetings. All the slides are easy to edit and you can use them even for advertisement purposes.
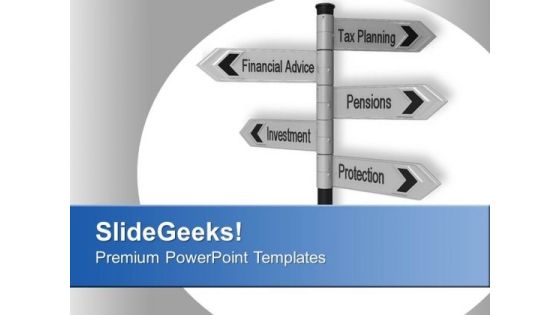
Tax Planning Finance Protection Signpost PowerPoint Templates Ppt Backgrounds For Slides 0213
We present our Tax Planning Finance Protection Signpost PowerPoint Templates PPT Backgrounds For Slides 0213.Download and present our Finance PowerPoint Templates because Our PowerPoint Templates and Slides will Activate the energies of your audience. Get their creative juices flowing with your words. Use our Business PowerPoint Templates because Our PowerPoint Templates and Slides will let your words and thoughts hit bullseye everytime. Download and present our Arrows PowerPoint Templates because You can Connect the dots. Fan expectations as the whole picture emerges. Use our Signs PowerPoint Templates because Our PowerPoint Templates and Slides are aesthetically designed to attract attention. We gaurantee that they will grab all the eyeballs you need. Use our Marketing PowerPoint Templates because Our PowerPoint Templates and Slides will let Your superior ideas hit the target always and everytime.Use these PowerPoint slides for presentations relating to Signpost with pension and planning finance, finance, business, arrows, signs, marketing. The prominent colors used in the PowerPoint template are Gray, Black, Blue.
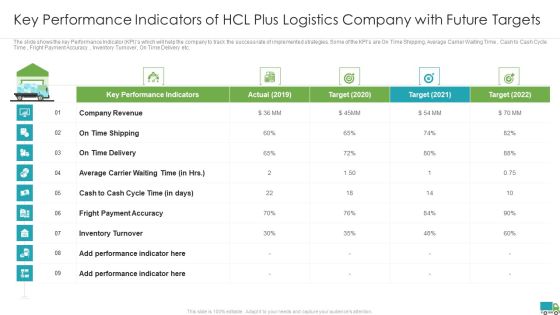
Generating Logistics Value Business Key Performance Indicators Of Hcl Plus Logistics Company With Future Sample PDF
The slide shows the key Performance Indicator KPIs which will help the company to track the success rate of implemented strategies. Some of the KPIs are On Time Shipping, Average Carrier Waiting Time, Cash to Cash Cycle Time, Fright Payment Accuracy, Inventory Turnover, On Time Delivery etc. Deliver and pitch your topic in the best possible manner with this generating logistics value business hcl plus logistics company business details with surplus funds elements pdf. Use them to share invaluable insights on company revenue, fright payment accuracy, inventory turnover and impress your audience. This template can be altered and modified as per your expectations. So, grab it now.

Customer Relationship Management And Daily Payments Dashboard With Top Reviews Professional PDF
This slide illustrates graphical representation of customer relationship management figures. It includes revenue, daily payments graph and top products etc. Showcasing this set of slides titled Customer Relationship Management And Daily Payments Dashboard With Top Reviews Professional PDF. The topics addressed in these templates are Quality Product, Services, Revenue. All the content presented in this PPT design is completely editable. Download it and make adjustments in color, background, font etc. as per your unique business setting.

Health IT System Business Performance Dashboard Ppt Summary File Formats PDF
This Slide provides a detailed overview of health information system market analysis. It covers region wise annual growth insights. Showcasing this set of slides titled health it system business performance dashboard ppt summary file formats pdf. The topics addressed in these templates are market contributes, cloud segment, revenue contributing. All the content presented in this PPT design is completely editable. Download it and make adjustments in color, background, font etc. as per your unique business setting.

CRM Data Analysis Revenue Customer Relationship Management CRM Infographics PDF
Deliver an awe inspiring pitch with this creative crm data analysis revenue customer relationship management crm infographics pdf bundle. Topics like expected revenue, source can be discussed with this completely editable template. It is available for immediate download depending on the needs and requirements of the user.

Top Customers And Revenue Ppt PowerPoint Presentation Summary Deck
This is a top customers and revenue ppt powerpoint presentation summary deck. This is a three stage process. The stages in this process are customer, table, revenue, management, planning.
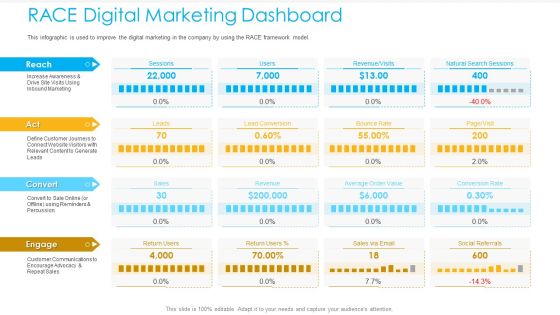
Unified Business To Consumer Marketing Strategy RACE Digital Marketing Dashboard Template PDF
This infographic is used to improve the digital marketing in the company by using the RACE framework model.Deliver and pitch your topic in the best possible manner with this unified business to consumer marketing strategy race digital marketing dashboard template pdf. Use them to share invaluable insights on sessions, lead conversion, revenue or visits, natural search sessions, bounce rate and impress your audience. This template can be altered and modified as per your expectations. So, grab it now.
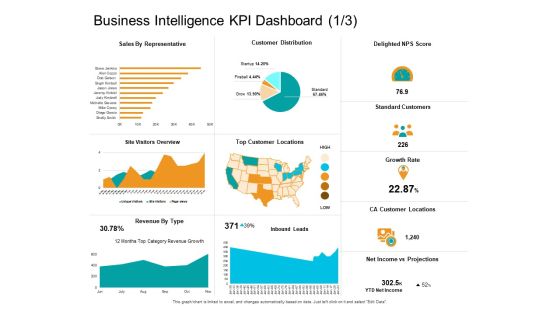
Facts Assessment Business Intelligence KPI Dashboard Expenses Ppt PowerPoint Presentation Layouts Background Images PDF
Presenting this set of slides with name facts assessment business intelligence kpi dashboard expenses ppt powerpoint presentation layouts background images pdf. The topics discussed in these slides are sales representative, delighted nps score, standard customers, growth rate, ca customer locations, net income vs projections, revenue type, top customer locations, customer distribution. This is a completely editable PowerPoint presentation and is available for immediate download. Download now and impress your audience.

Firm Productivity Administration Business Intelligence KPI Dashboard Score Ppt PowerPoint Presentation Infographic Template Display PDF
Presenting this set of slides with name firm productivity administration business intelligence kpi dashboard score ppt powerpoint presentation infographic template display pdf. The topics discussed in these slides are sales representative, delighted nps score, standard customers, growth rate, ca customer locations, net income vs projections, revenue type, top customer locations, customer distribution. This is a completely editable PowerPoint presentation and is available for immediate download. Download now and impress your audience.
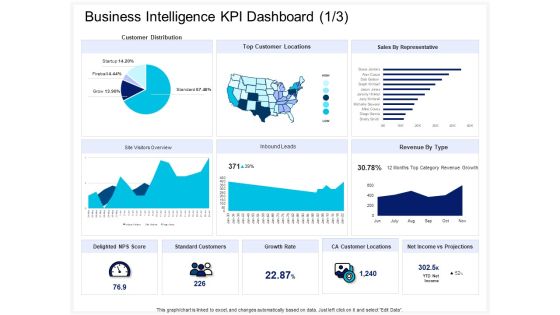
Enterprise Problem Solving And Intellect Business Intelligence KPI Dashboard Growth Ppt PowerPoint Presentation Model Images PDF
Presenting this set of slides with name enterprise problem solving and intellect business intelligence kpi dashboard growth ppt powerpoint presentation model images pdf. The topics discussed in these slides are sales representative, delighted nps score, standard customers, growth rate, ca customer locations, net income vs projections, revenue type, top customer locations, customer distribution. This is a completely editable PowerPoint presentation and is available for immediate download. Download now and impress your audience.

Administrative Regulation Business Management Dashboards Sales Ppt PowerPoint Presentation Inspiration Layouts PDF
Deliver an awe-inspiring pitch with this creative administrative regulation business management dashboards sales ppt powerpoint presentation inspiration layouts pdf bundle. Topics like top ten products by profit margin, revenue and sales last 12 months, customers by regione, customers signups, sales by product category can be discussed with this completely editable template. It is available for immediate download depending on the needs and requirements of the user.

B2C Marketing Initiatives Strategies For Business RACE Digital Marketing Dashboard Ppt Infographic Template Objects PDF
This infographic is used to improve the digital marketing in the company by using the RACE framework model. Deliver an awe inspiring pitch with this creative B2C marketing initiatives strategies for business RACE digital marketing dashboard ppt infographic template objects pdf bundle. Topics like revenue, customer communications, inbound marketing, social referrals, conversion rate can be discussed with this completely editable template. It is available for immediate download depending on the needs and requirements of the user.

Customer Credit Reporting Company Outline Revenue By Business Activity And Regions Background PDF
This slide highlights the Experian company revenue which includes the revenue by business activity B2B Data, B2B decisioning and consumer services and revenue by regions North America, Latin America, UK, Ireland and EMEA. Welcome to our selection of the Customer Credit Reporting Company Outline Revenue By Business Activity And Regions Background PDF. These are designed to help you showcase your creativity and bring your sphere to life. Planning and Innovation are essential for any business that is just starting out. This collection contains the designs that you need for your everyday presentations. All of our PowerPoints are 100 percent editable, so you can customize them to suit your needs. This multi purpose template can be used in various situations. Grab these presentation templates today.

Key Performance Indicators Of NSS Electronic Manufacturing Company With Future Targets Professional PDF
The slide shows the key Performance Indicator KPIs which will help the company to track the success rate of implemented strategies. Some of the KPIs are Company Revenue, Labor Shortage Rate, Production Volumes , Company Productivity, Capacity Utilization, On Standard Operating Efficiency etc. Presenting key performance indicators of nss electronic manufacturing company with future targets professional pdf to provide visual cues and insights. Share and navigate important information on three stages that need your due attention. This template can be used to pitch topics like company revenue, labor shortage rate, company productivity, capacity utilization, target. In addtion, this PPT design contains high resolution images, graphics, etc, that are easily editable and available for immediate download.

Quarterly Sales Revenue By Product Ppt PowerPoint Presentation Background Designs
This is a quarterly sales revenue by product ppt powerpoint presentation background designs. This is a four stage process. The stages in this process are business, strategy, marketing, analysis, growth strategy.
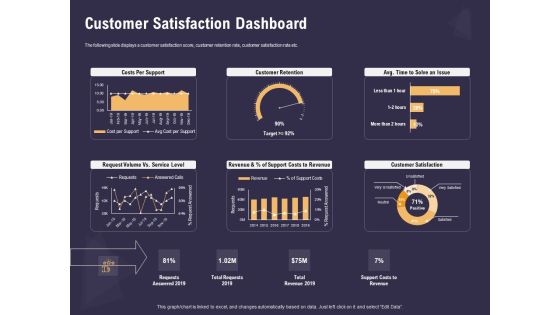
Effective Workforce Management Customer Satisfaction Dashboard Ppt PowerPoint Presentation Show Influencers PDF
Presenting this set of slides with name effective workforce management customer satisfaction dashboard ppt powerpoint presentation show influencers pdf. The topics discussed in these slides are costs per support, customer retention, avg time to solve an issue, request volume vs service level, revenue of support costs to revenue, customer satisfaction. This is a completely editable PowerPoint presentation and is available for immediate download. Download now and impress your audience.
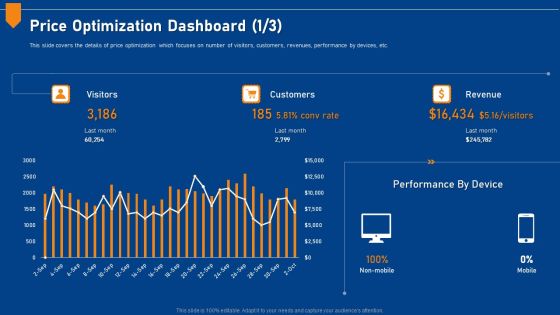
Evaluating Price Efficiency In Organization Price Optimization Dashboard Customers Microsoft PDF
This slide covers the details of price optimization which focuses on number of visitors, customers, revenues, performance by devices, etc. Deliver and pitch your topic in the best possible manner with this evaluating price efficiency in organization price optimization dashboard customers microsoft pdf. Use them to share invaluable insights on visitors, customers, revenue and impress your audience. This template can be altered and modified as per your expectations. So, grab it now.
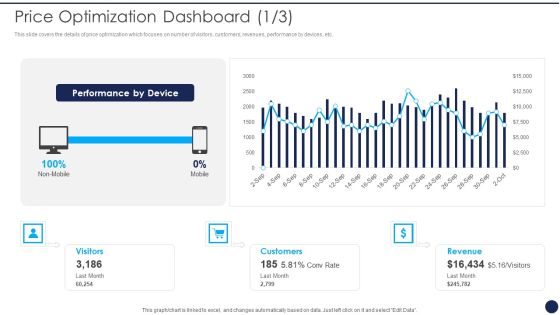
Product Pricing Strategies Analysis Price Optimization Dashboard Ppt File Background Image PDF
This slide covers the details of price optimization which focuses on number of visitors, customers, revenues, performance by devices, etc. Deliver an awe inspiring pitch with this creative Product Pricing Strategies Analysis Price Optimization Dashboard Ppt File Background Image PDF bundle. Topics like Visitors Customers Revenue, Performance By Device can be discussed with this completely editable template. It is available for immediate download depending on the needs and requirements of the user.
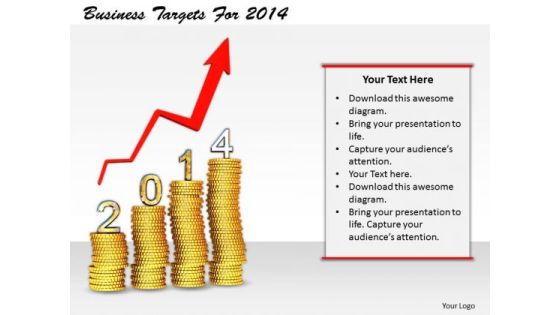
Stock Photo Business Management Strategy Targets For 2014 Image
Anticipate Contingencies With Our stock photo business management strategy targets for 2014 image. Draw Up Foolproof Answers For Any Eventuality. With Our arrows You Will Land On Your Feet. Your Efforts Will Achieve Favorable Results.
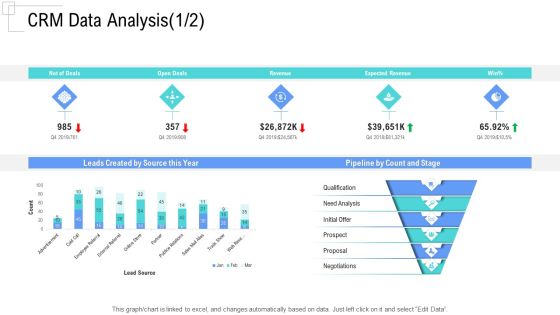
Managing Customer Experience CRM Data Analysis Revenue Designs PDF
This graph or chart is linked to excel, and changes automatically based on data. Just left click on it and select Edit Data.Deliver an awe-inspiring pitch with this creative managing customer experience crm data analysis revenue designs pdf bundle. Topics like leads created by source this year, pipeline by count and stage, qualification, need analysis, initial offer can be discussed with this completely editable template. It is available for immediate download depending on the needs and requirements of the user.
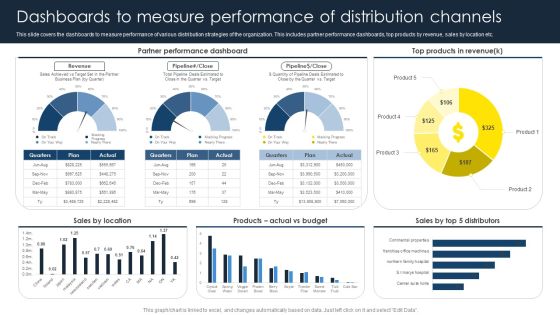
Optimize Business Sales Dashboards To Measure Performance Of Distribution Summary PDF
This slide covers the dashboards to measure performance of various distribution strategies of the organization. This includes partner performance dashboards, top products by revenue, sales by location etc. The best PPT templates are a great way to save time, energy, and resources. Slidegeeks have 100 percent editable powerpoint slides making them incredibly versatile. With these quality presentation templates, you can create a captivating and memorable presentation by combining visually appealing slides and effectively communicating your message. Download Optimize Business Sales Dashboards To Measure Performance Of Distribution Summary PDF from Slidegeeks and deliver a wonderful presentation.

Business Growth Strategy And Revenue Model Ppt PowerPoint Presentation Complete Deck With Slides
This is a business growth strategy and revenue model ppt powerpoint presentation complete deck with slides. This is a one stage process. The stages in this process are business, dashboard, elevator, marketing, process.
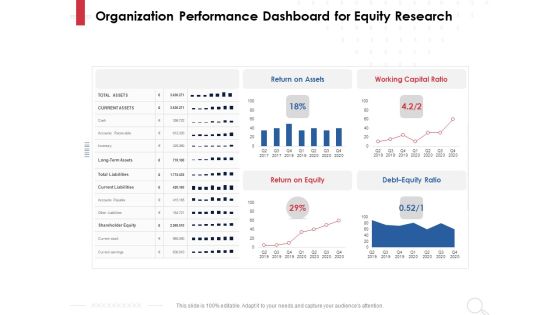
Equity Analysis Project Organization Performance Dashboard For Equity Research Ppt PowerPoint Presentation Styles Slide Portrait PDF
Presenting this set of slides with name equity analysis project organization performance dashboard for equity research ppt powerpoint presentation styles slide portrait pdf. The topics discussed in these slides are return equity, return assets, working capital ratio, debt equity ratio. This is a completely editable PowerPoint presentation and is available for immediate download. Download now and impress your audience.
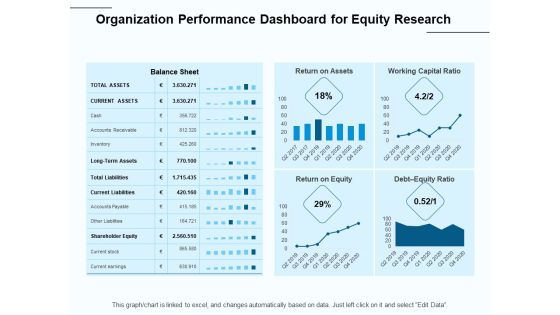
Fund Investment Advisory Statement Organization Performance Dashboard For Equity Research Demonstration PDF
Presenting this set of slides with name fund investment advisory statement organization performance dashboard for equity research demonstration pdf. The topics discussed in these slides are assets, equity, working capital ratio, liabilities, accounts payable. This is a completely editable PowerPoint presentation and is available for immediate download. Download now and impress your audience.

Liquidity And Profitability Ratio Analysis Dashboard Ppt PowerPoint Presentation Portfolio Infographic Template PDF
Presenting this set of slides with name liquidity and profitability ratio analysis dashboard ppt powerpoint presentation portfolio infographic template pdf. The topics discussed in these slides are liquidity ratios, profitability ratios, capital structure ratios, debt equity ratios. This is a completely editable PowerPoint presentation and is available for immediate download. Download now and impress your audience.

Stock Market Research Report Organization Performance Dashboard For Equity Research Slides PDF
Deliver an awe-inspiring pitch with this creative stock market research report organization performance dashboard for equity research slides pdf bundle. Topics like balance sheet, return on assets, working capital ratio, return on equity, debt equity ratio can be discussed with this completely editable template. It is available for immediate download depending on the needs and requirements of the user.

Content And Permission Marketing Tactics For Enhancing Business Revenues Analyzing Key Marketing Metrics Themes PDF
Slidegeeks is one of the best resources for PowerPoint templates. You can download easily and regulate Content And Permission Marketing Tactics For Enhancing Business Revenues Analyzing Key Marketing Metrics Themes PDF for your personal presentations from our wonderful collection. A few clicks is all it takes to discover and get the most relevant and appropriate templates. Use our Templates to add a unique zing and appeal to your presentation and meetings. All the slides are easy to edit and you can use them even for advertisement purposes.

CRM Pipeline Administration Tracking Sales Pipeline And Lead Activity Dashboard Formats PDF
This slide covers information regarding dashboard associated to tracking lead activity across sales pipeline. Make sure to capture your audiences attention in your business displays with our gratis customizable CRM Pipeline Administration Tracking Sales Pipeline And Lead Activity Dashboard Formats PDF. These are great for business strategies, office conferences, capital raising or task suggestions. If you desire to acquire more customers for your tech business and ensure they stay satisfied, create your own sales presentation with these plain slides.
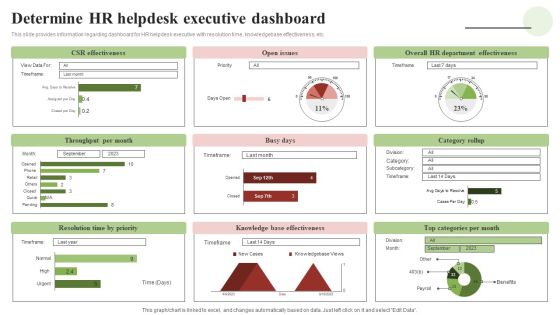
Transforming Human Resource Service Delivery Procedure Determine HR Helpdesk Executive Dashboard Background PDF
This slide provides information regarding dashboard for HR helpdesk executive with resolution time, knowledgebase effectiveness, etc. Make sure to capture your audiences attention in your business displays with our gratis customizable Transforming Human Resource Service Delivery Procedure Determine HR Helpdesk Executive Dashboard Background PDF. These are great for business strategies, office conferences, capital raising or task suggestions. If you desire to acquire more customers for your tech business and ensure they stay satisfied, create your own sales presentation with these plain slides.

Revenue Database In Blockchain Business Methodology Icon Download PDF
Presenting Revenue Database In Blockchain Business Methodology Icon Download PDF to dispense important information. This template comprises four stages. It also presents valuable insights into the topics including Revenue Database, Blockchain Business Methodology, Icon. This is a completely customizable PowerPoint theme that can be put to use immediately. So, download it and address the topic impactfully.

Quarterly Company Revenue Summary With Key Information Slides PDF
This slide displays quarterly revenue report for EdTech company from different categories of consumers. It includes various client segments such as consumers, enterprises, degrees, key business metrics, etc.
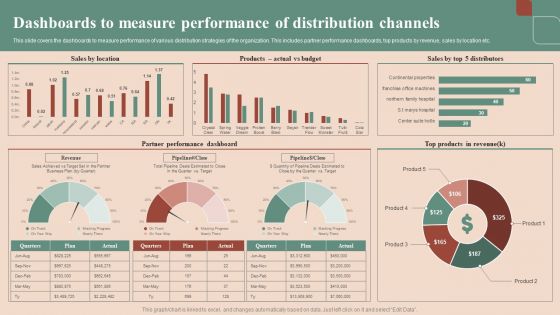
Maximizing Profit Returns With Right Distribution Source Dashboards To Measure Performance Of Distribution Channels Microsoft PDF
This slide covers the dashboards to measure performance of various distribution strategies of the organization. This includes partner performance dashboards, top products by revenue, sales by location etc. Slidegeeks is here to make your presentations a breeze with Maximizing Profit Returns With Right Distribution Source Dashboards To Measure Performance Of Distribution Channels Microsoft PDF With our easy-to-use and customizable templates, you can focus on delivering your ideas rather than worrying about formatting. With a variety of designs to choose from, youre sure to find one that suits your needs. And with animations and unique photos, illustrations, and fonts, you can make your presentation pop. So whether youre giving a sales pitch or presenting to the board, make sure to check out Slidegeeks first.

Business Process Outsourcing Company Profile Call Center Business Model Portrait PDF
This slide highlights the business model of call center company which includes target market, revenue stream, customer relationship, cost structures , products, key activities and channels. Deliver and pitch your topic in the best possible manner with this Business Process Outsourcing Company Profile Call Center Business Model Portrait PDF. Use them to share invaluable insights on Revenue Stream, Customer Relationship, Target Market, Cost Structure, Customer Segments and impress your audience. This template can be altered and modified as per your expectations. So, grab it now.
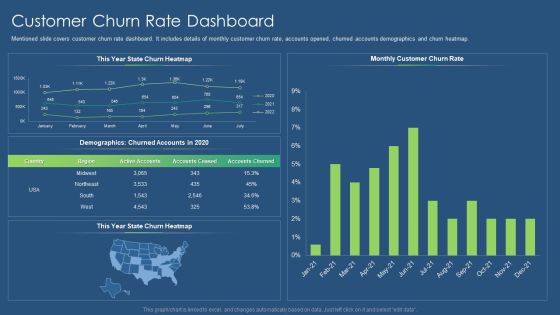
Sustainability Calculation With KPI Customer Churn Rate Dashboard Mockup PDF Mockup PDF
Mentioned slide covers cash flow dashboard. It shows detailed cash flow status in a 12 months format and working capital with accounts receivable and payable details. Deliver and pitch your topic in the best possible manner with this sustainability calculation with kpi cash flow dashboard liquidity ratio inspiration pdf. Use them to share invaluable insights on cash flow dashboard and impress your audience. This template can be altered and modified as per your expectations. So, grab it now.

Revenue Split By Product Segment Template Ppt PowerPoint Presentation Graphics
This is a revenue split by product segment template ppt powerpoint presentation graphics. This is a four stage process. The stages in this process are product, business, marketing, planning, process.
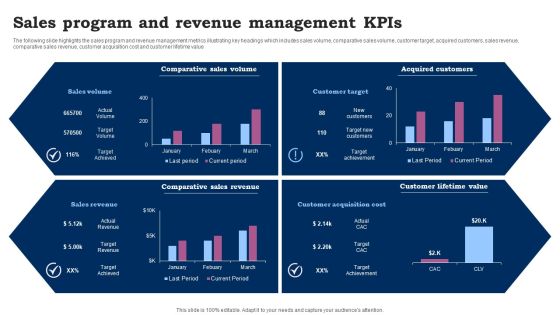
Sales Program And Revenue Management Kpis Ppt Outline Slide Download PDF
The following slide highlights the sales program and revenue management metrics illustrating key headings which includes sales volume, comparative sales volume, customer target, acquired customers, sales revenue, comparative sales revenue, customer acquisition cost and customer lifetime value. Showcasing this set of slides titled Sales Program And Revenue Management Kpis Ppt Outline Slide Download PDF. The topics addressed in these templates are Comparative Sales Volume, Acquired Customers, Comparative Sales Revenue. All the content presented in this PPT design is completely editable. Download it and make adjustments in color, background, font etc. as per your unique business setting.
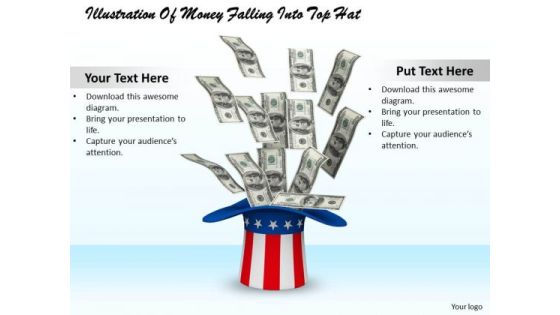
Stock Photo Illustration Of Money Falling Into Top Hat PowerPoint Slide
Use this professional image in finance and money related topics. This image depicts graphics of American bank notes falling in top hat. Make an outstanding presentation with this unique image slide.

Dashboard Of Japan Country Profile Statistics Ppt Styles Infographic Template PDF
Presenting Dashboard Of Japan Country Profile Statistics Ppt Styles Infographic Template PDF to dispense important information. This template comprises one stages. It also presents valuable insights into the topics including Share Global GDP, Ghg Emissions, Per Capital. This is a completely customizable PowerPoint theme that can be put to use immediately. So, download it and address the topic impactfully.

Data Center Infrastructure Management IT What Is Data Center Consolidation Information PDF
This slide depicts the data center consolidation and how it would be beneficial for companies in saving money through operational expenses and facility costs. Deliver an awe inspiring pitch with this creative data center infrastructure management it what is data center consolidation information pdf bundle. Topics like costs, performance, economic, data centers can be discussed with this completely editable template. It is available for immediate download depending on the needs and requirements of the user.
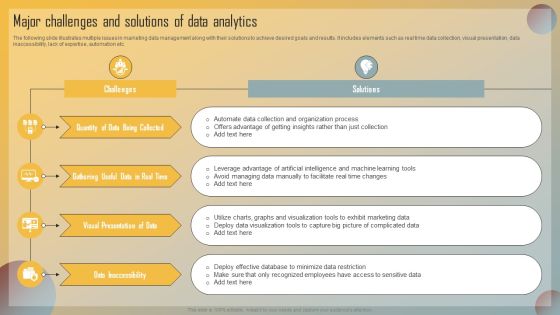
Guide For Marketing Analytics To Improve Decisions Major Challenges And Solutions Of Data Analytics Formats PDF
The following slide illustrates multiple issues in marketing data management along with their solutions to achieve desired goals and results. It includes elements such as real time data collection, visual presentation, data inaccessibility, lack of expertise, automation etc. Make sure to capture your audiences attention in your business displays with our gratis customizable Guide For Marketing Analytics To Improve Decisions Major Challenges And Solutions Of Data Analytics Formats PDF. These are great for business strategies, office conferences, capital raising or task suggestions. If you desire to acquire more customers for your tech business and ensure they stay satisfied, create your own sales presentation with these plain slides.

Consumption Based Pricing Model Key Metrices For Revenue Model Elements PDF
The purpose of the following slide is to compare various revenue models based on different metrices such as annual recurring revenue, average revenue per unit, customer conversion rate, customer net profitability and customer churn rate. This modern and well arranged Consumption Based Pricing Model Key Metrices For Forecasting In Recurring Revenue Model Clipart PDF provides lots of creative possibilities. It is very simple to customize and edit with the Powerpoint Software. Just drag and drop your pictures into the shapes. All facets of this template can be edited with Powerpoint no extra software is necessary. Add your own material, put your images in the places assigned for them, adjust the colors, and then you can show your slides to the world, with an animated slide included.

Saas Continuous Income Generation Model For Software Startup Key Metrices For Revenue Model Introduction PDF
The purpose of the following slide is to compare various revenue models based on different metrices such as Annual recurring revenue, Average revenue per unit, customer conversion rate, customer net profitability and customer churn rate. This modern and well arranged Saas Continuous Income Generation Model For Software Startup Key Metrices For Revenue Model Introduction PDF provides lots of creative possibilities. It is very simple to customize and edit with the Powerpoint Software. Just drag and drop your pictures into the shapes. All facets of this template can be edited with Powerpoint no extra software is necessary. Add your own material, put your images in the places assigned for them, adjust the colors, and then you can show your slides to the world, with an animated slide included.
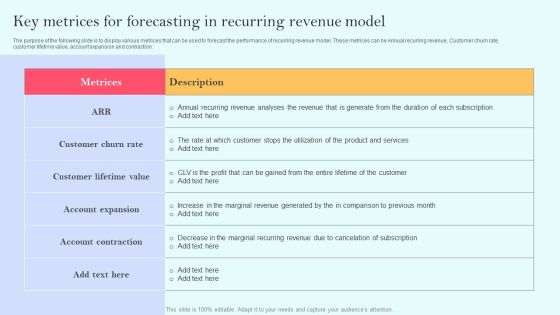
Recurring Income Generation Model Key Metrices For Forecasting In Recurring Revenue Model Summary PDF
The purpose of the following slide is to display various metrices that can be used to forecast the performance of recurring revenue model. These metrices can be Annual recurring revenue, Customer churn rate, customer lifetime value, account expansion and contraction. This modern and well arranged Recurring Income Generation Model Key Metrices For Forecasting In Recurring Revenue Model Summary PDF provides lots of creative possibilities. It is very simple to customize and edit with the Powerpoint Software. Just drag and drop your pictures into the shapes. All facets of this template can be edited with Powerpoint no extra software is necessary. Add your own material, put your images in the places assigned for them, adjust the colors, and then you can show your slides to the world, with an animated slide included.

Key Performance Indicator To Track The Performance Of Oil And Gas Company Ppt Ideas Graphics Design PDF
The slide provides the key performance indicators KPIs that might help to track the performance of oil and gas companies. Major KPIs include revenue, crude oil and natural gas production, number of rigs, workforce etc. Deliver an awe inspiring pitch with this creative key performance indicator to track the performance of oil and gas company ppt ideas graphics design pdf bundle. Topics like key performance indicator to track the performance of oil and gas company can be discussed with this completely editable template. It is available for immediate download depending on the needs and requirements of the user.
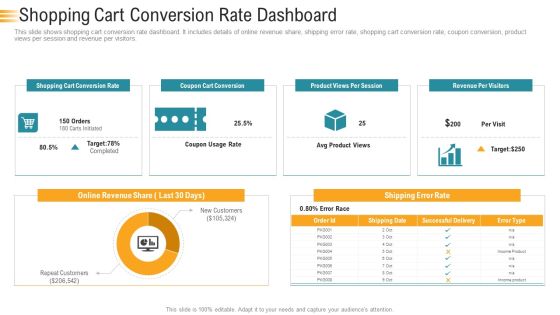
Establishing An Efficient Integrated Marketing Communication Process Shopping Cart Conversion Rate Dashboard Ideas PDF
This slide shows shopping cart conversion rate dashboard. It includes details of online revenue share, shipping error rate, shopping cart conversion rate, coupon conversion, product views per session and revenue per visitors. Deliver an awe inspiring pitch with this creative establishing an efficient integrated marketing communication process shopping cart conversion rate dashboard ideas pdf bundle. Topics like shopping cart conversion rate dashboard can be discussed with this completely editable template. It is available for immediate download depending on the needs and requirements of the user.

Business Restructuring Process Dashboard To Determine Sales Profit And Conversions Inspiration PDF
This slide focuses on dashboard to determine sales profits and conversions that also includes revenues, profits, number of orders placed, total customers, procured items that will help company to measure the overall business performance. There are so many reasons you need a Business Restructuring Process Dashboard To Determine Sales Profit And Conversions Inspiration PDF. The first reason is you cant spend time making everything from scratch, Thus, Slidegeeks has made presentation templates for you too. You can easily download these templates from our website easily.
 Home
Home