Financial Snapshot

Funding Pitch To Raise Funds From PE Market Valuation Of The Company Pictures PDF
The slide provides key valuation ratios or stats EBITDA, EBIT, NOPAT and current market valuation of the company as per the discounted cash flow method. Presenting funding pitch to raise funds from pe market valuation of the company pictures pdf to provide visual cues and insights. Share and navigate important information on three stages that need your due attention. This template can be used to pitch topics like financial, stabilization, global expansion, growth, revenue. In addtion, this PPT design contains high resolution images, graphics, etc, that are easily editable and available for immediate download.

Quality Management Dashboard Ppt PowerPoint Presentation File Diagrams
This is a quality management dashboard ppt powerpoint presentation file diagrams. This is a four stage process. The stages in this process are finance, marketing, management, investment, analysis.
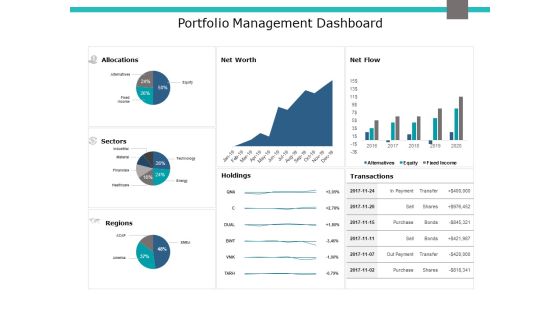
Portfolio Management Dashboard Ppt PowerPoint Presentation Gallery Example Introduction
This is a portfolio management dashboard ppt powerpoint presentation gallery example introduction. This is a three stage process. The stages in this process are area chart, finance, marketing, management, investment.

Quality Control Kpi Dashboard Ppt PowerPoint Presentation Slides Topics
This is a quality control kpi dashboard ppt powerpoint presentation slides topics. This is a four stage process. The stages in this process are finance, marketing, management, investment, analysis.

Global Business Sustainability Reporting Statistics Themes PDF
This slide highlights statistical data of global business for sustainability reporting to provide transparency on the companys contribution to sustainable development. It includes key components such as global business, top companies, globally followed corporate practices, etc. If you are looking for a format to display your unique thoughts, then the professionally designed Global Business Sustainability Reporting Statistics Themes PDF is the one for you. You can use it as a Google Slides template or a PowerPoint template. Incorporate impressive visuals, symbols, images, and other charts. Modify or reorganize the text boxes as you desire. Experiment with shade schemes and font pairings. Alter, share or cooperate with other people on your work. Download Global Business Sustainability Reporting Statistics Themes PDF and find out how to give a successful presentation. Present a perfect display to your team and make your presentation unforgettable.

Key Performance Indicators For Market Sizing Ppt PowerPoint Presentation Visuals PDF
Presenting key performance indicators for market sizing ppt powerpoint presentation visuals pdf to dispense important information. This template comprises three stages. It also presents valuable insights into the topics including tam, sam, som. This is a completely customizable PowerPoint theme that can be put to use immediately. So, download it and address the topic impactfully.

Predictive Data Model Predictive Analytics In Finding Better Customer Leads Sample PDF
This slide represents how predictive analytics can help the marketing industry find better customer leads and can be used in ad targeting, suggestive copywriting, lead prospecting, and targeted sales conversations. Slidegeeks has constructed Predictive Data Model Predictive Analytics In Finding Better Customer Leads Sample PDF after conducting extensive research and examination. These presentation templates are constantly being generated and modified based on user preferences and critiques from editors. Here, you will find the most attractive templates for a range of purposes while taking into account ratings and remarks from users regarding the content. This is an excellent jumping-off point to explore our content and will give new users an insight into our top-notch PowerPoint Templates.
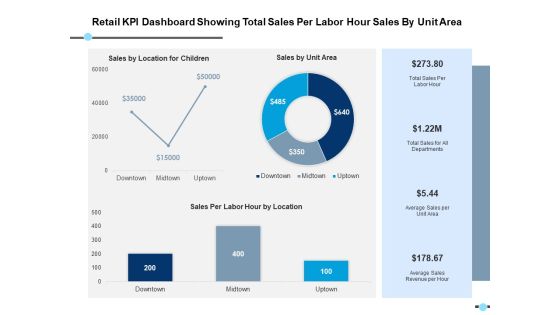
Retail Kpi Dashboard Showing Total Sales Per Labor Hour Sales By Unit Area Ppt PowerPoint Presentation Model Format
This is a retail kpi dashboard showing total sales per labor hour sales by unit area ppt powerpoint presentation model format. This is a three stage process. The stages in this process are finance, strategy, analysis, marketing.

Retail Kpi Dashboard Showing Total Sales Per Labor Hour Sales By Unit Area Ppt PowerPoint Presentation Styles Influencers
This is a retail kpi dashboard showing total sales per labor hour sales by unit area ppt powerpoint presentation styles influencers. This is a three stage process. The stages in this process are finance, marketing, management, investment, analysis.
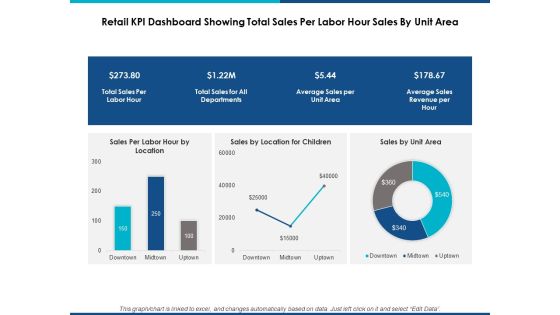
Retail Kpi Dashboard Showing Total Sales Per Labor Hour Sales By Unit Area Ppt Powerpoint Presentation Show Graphic Tips
This is a retail kpi dashboard showing total sales per labor hour sales by unit area ppt powerpoint presentation show graphic tips. This is a three stage process. The stages in this process are finance, marketing, management, investment, analysis.
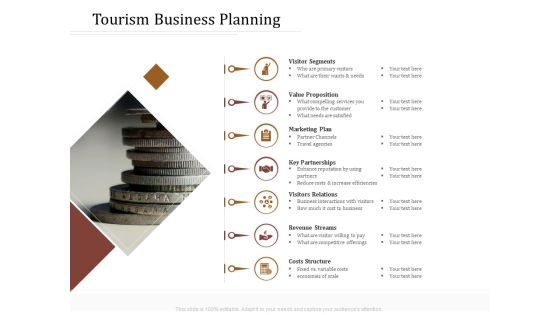
Key Metrics Hotel Administration Management Tourism Business Planning Brochure PDF
Presenting this set of slides with name key metrics hotel administration management tourism business planning brochure pdf. This is a seven stage process. The stages in this process are visitor segments, value proposition, marketing plan, revenue streams, costs structure. This is a completely editable PowerPoint presentation and is available for immediate download. Download now and impress your audience.

Pandl Kpis Tabular Form Ppt PowerPoint Presentation Pictures Visual Aids
This is a pandl kpis tabular form ppt powerpoint presentation pictures visual aids. This is a four stage process. The stages in this process are revenue, operating profit, cogs, net profit.

Big Data Analytics Tools And Techniques Ppt PowerPoint Presentation Infographic Template Good
Presenting this set of slides with name big data analytics tools and techniques ppt powerpoint presentation infographic template good. This is a one stage process. The stages in this process are big data analysis, data management, technologies segmentation. This is a completely editable PowerPoint presentation and is available for immediate download. Download now and impress your audience.

Data Driven Analytics Chart Powerpoint Presentation Templates
This is a data driven analytics chart powerpoint presentation templates. This is a five stage process. The stages in this process are category.

Decrease Cost And Income Growth Dashboard Ppt PowerPoint Presentation Inspiration Guide
This is a decrease cost and income growth dashboard ppt powerpoint presentation inspiration guide. This is a three stage process. The stages in this process are growth, increase sales, increase revenue.

Business Data Analysis Inventory And Accounts Payable Days Ppt PowerPoint Presentation Layouts Professional
This is a business data analysis inventory and accounts payable days ppt powerpoint presentation layouts professional. This is a three stage process. The stages in this process are business analytics, ba, organizations data.
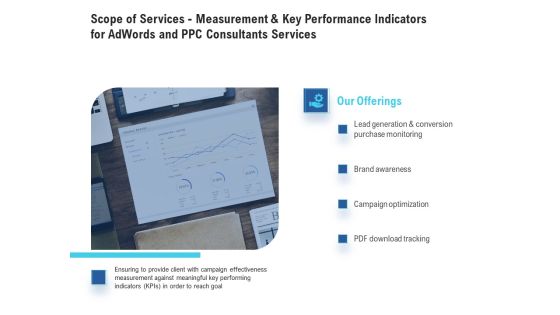
Scope Of Services - Measurement And Key Performance Indicators For Adwords And PPC Consultants Services Brochure PDF
Presenting this set of slides with name scope of services - measurement and key performance indicators for adwords and ppc consultants services brochure pdf. This is a four stage process. The stages in this process are lead generation and conversion purchase monitoring, brand awareness, campaign optimization, pdf download tracking. This is a completely editable PowerPoint presentation and is available for immediate download. Download now and impress your audience.

Balance Sheet Kpis Ppt PowerPoint Presentation File Picture
This is a balance sheet kpis ppt powerpoint presentation file picture. This is a four stage process. The stages in this process are business, marketing, finance, graph, cagr.
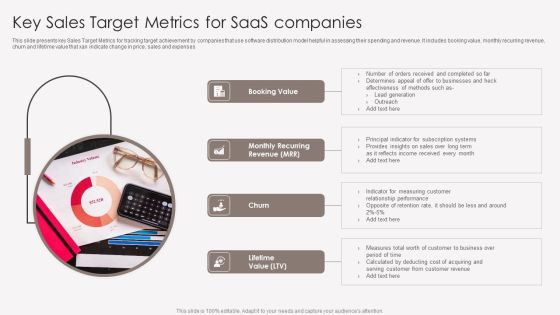
Key Sales Target Metrics For Saas Companies Portrait PDF
This slide presents key Sales Target Metrics for tracking target achievement by companies that use software distribution model helpful in assessing their spending and revenue. It includes booking value, monthly recurring revenue, churn and lifetime value that xan indicate change in price, sales and expenses. Persuade your audience using this Key Sales Target Metrics For Saas Companies Portrait PDF. This PPT design covers four stages, thus making it a great tool to use. It also caters to a variety of topics including Booking Value, Churn, Lifetime Value. Download this PPT design now to present a convincing pitch that not only emphasizes the topic but also showcases your presentation skills.

Balance Sheet Kpis Template 1 Ppt PowerPoint Presentation Pictures Grid
This is a balance sheet kpis template 1 ppt powerpoint presentation pictures grid. This is a four stage process. The stages in this process are current assets, current liabilities, total assets, total liabilities.

Cash Flow Statement Kpis Ppt PowerPoint Presentation Pictures Graphics
This is a cash flow statement kpis ppt powerpoint presentation pictures graphics. This is a four stage process. The stages in this process are business, marketing, graph, finance, strategy.

Balance Sheet Kpis Marketing Ppt PowerPoint Presentation File Pictures
This is a balance sheet kpis marketing ppt powerpoint presentation file pictures. This is a four stage process. The stages in this process are finance, marketing, management, investment, analysis.
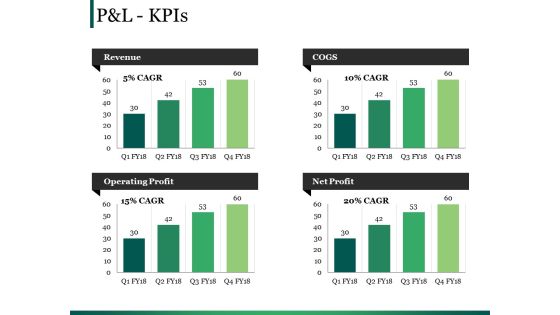
Pandl Kpis Ppt PowerPoint Presentation Outline Gallery
This is a pandl kpis ppt powerpoint presentation outline gallery. This is a four stage process. The stages in this process are revenue, cogs, operating profit, net profit.
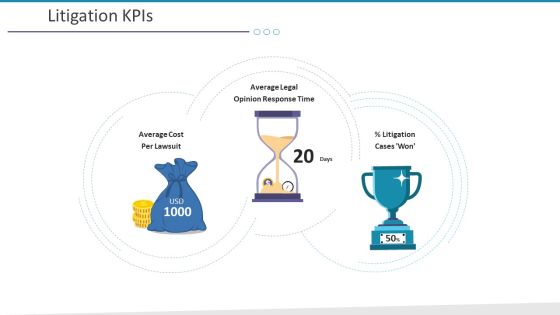
Investigation For Business Procurement Litigation Kpis Ppt Pictures Structure PDF
This is a investigation for business procurement litigation kpis ppt pictures structure pdf. template with various stages. Focus and dispense information on three stages using this creative set, that comes with editable features. It contains large content boxes to add your information on topics like average cost per lawsuit, average legal opinion response time. You can also showcase facts, figures, and other relevant content using this PPT layout. Grab it now.

Pandl Kpis Ppt PowerPoint Presentation Professional Backgrounds
This is a pandl kpis ppt powerpoint presentation professional backgrounds. This is a four stage process. The stages in this process are business, revenue, operating profit, cogs, net profit.

Commodity Adoption Metrics For Technique Development Microsoft PDF
This slide highlights various key performance indicators to identify product adoption rate for user acquisition strategy development. It includes key metrics such as net promoter score, client retention rate, active user percentage, customer lifetime value and churn rate. Presenting Commodity Adoption Metrics For Technique Development Microsoft PDF to dispense important information. This template comprises four stages. It also presents valuable insights into the topics including Build Customer, Onboarding Process, Analysis. This is a completely customizable PowerPoint theme that can be put to use immediately. So, download it and address the topic impactfully.

Social Media Marketing Data Analytics New Customers Visitors And Leads Ppt PowerPoint Presentation Professional Pictures
This is a social media marketing data analytics new customers visitors and leads ppt powerpoint presentation professional pictures. This is a two stage process. The stages in this process are business analytics, ba, organizations data.
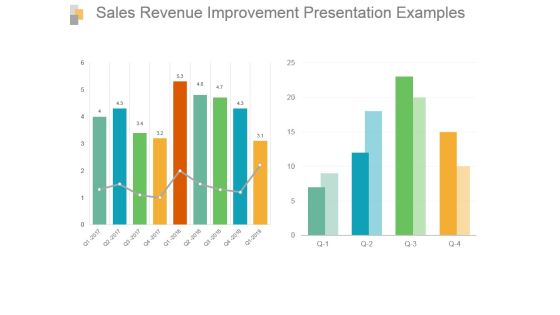
Sales Revenue Improvement Presentation Examples
This is a sales revenue improvement presentation examples. This is a two stage process. The stages in this process are bar graph, growth, sales, data, analysis.
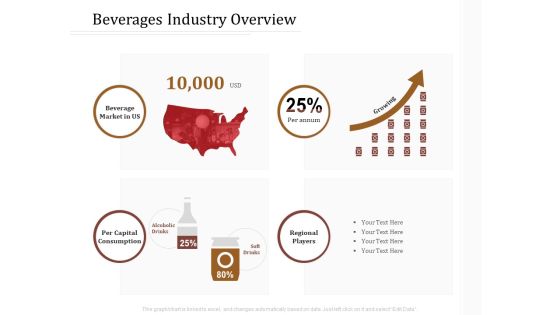
Key Metrics Hotel Administration Management Beverages Industry Overview Brochure PDF
Presenting this set of slides with name key metrics hotel administration management beverages industry overview brochure pdf. This is a four stage process. The stages in this process are beverage market, per capital consumption, regional players, per annum. This is a completely editable PowerPoint presentation and is available for immediate download. Download now and impress your audience.
Kpis For Tracking Fleet Information Effectively Icons PDF
This slide showcases factors which fleet data needs to keep track of. This template focuses on increasing uptime and improving conditions for their mobile workforce. It includes information related to vehicle performance, safety behaviour, etc. Persuade your audience using this Kpis For Tracking Fleet Information Effectively Icons PDF. This PPT design covers four stages, thus making it a great tool to use. It also caters to a variety of topics including Predictive Safety Behavior, Vehicle Performance, Inspection Maintenance. Download this PPT design now to present a convincing pitch that not only emphasizes the topic but also showcases your presentation skills.

Actual Time Transaction Monitoring Software And Strategies Suspicious Activity Reporting Process Flow Rules PDF
This slide showcases process flow of suspicious activity reporting SAR. It provides information about transaction alert, purpose, patterns, customer behavior, client lifestyle, negative news, adverse media, sanctions, anti money laundering AML, etc. This Actual Time Transaction Monitoring Software And Strategies Suspicious Activity Reporting Process Flow Rules PDF from Slidegeeks makes it easy to present information on your topic with precision. It provides customization options, so you can make changes to the colors, design, graphics, or any other component to create a unique layout. It is also available for immediate download, so you can begin using it right away. Slidegeeks has done good research to ensure that you have everything you need to make your presentation stand out. Make a name out there for a brilliant performance.
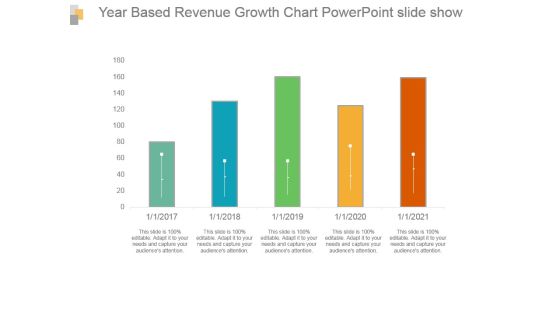
Year Based Revenue Growth Chart Powerpoint Slide Show
This is a year based revenue growth chart powerpoint slide show. This is a five stage process. The stages in this process are bar graph, growth, revenue, year, success.

Competitive Environment Analysis Ppt Images
This is a competitive environment analysis ppt images. This is a four stage process. The stages in this process are engagement, brand, monthly, weekly, x, y.

Data Safety Initiatives Communication Plan For Cyber Breaches Topics PDF
Mentioned slide portrays communication plan that company will use for effectively managing cyber breaches. Sections covered here are what to communicate, description, delivery method, frequency and responsible. Presenting data safety initiatives communication plan for cyber breaches topics pdf to provide visual cues and insights. Share and navigate important information on four stages that need your due attention. This template can be used to pitch topics like communicate, delivery method, frequency, responsible, product report. In addtion, this PPT design contains high resolution images, graphics, etc, that are easily editable and available for immediate download.

Big Data Analytics Vector Icon Ppt PowerPoint Presentation Layouts Show
Presenting this set of slides with name big data analytics vector icon ppt powerpoint presentation layouts show. This is a three stage process. The stages in this process are marketing, management, measuring results. This is a completely editable PowerPoint presentation and is available for immediate download. Download now and impress your audience.

Six Sigma Continuous Process Kpis To Measure The Growth Of Operational Strategy Rules PDF
Purpose of the following slide is to show the KPIs or key performance indicators for measuring the progress of operational strategy. These KPIs can be customer satisfaction rate, net promoter score, Downtime etc. This is a Six Sigma Continuous Process Kpis To Measure The Growth Of Operational Strategy Rules PDF template with various stages. Focus and dispense information on four stages using this creative set, that comes with editable features. It contains large content boxes to add your information on topics like Customer KPIs, Employee KPIs, Production KPIs. You can also showcase facts, figures, and other relevant content using this PPT layout. Grab it now.

Channel KPIS Ppt PowerPoint Presentation Ideas Topics
This is a channel kpis ppt powerpoint presentation ideas topics. This is a four stage process. The stages in this process are years, business, marketing, finance, graph.

Channel Kpis Ppt PowerPoint Presentation Professional Inspiration
This is a channel kpis ppt powerpoint presentation professional inspiration. This is a four stage process. The stages in this process are bar graph, marketing, finance, strategy, planning.

Kpis And Operations Metrics Presentation Powerpoint Example
This is a kpis and operations metrics presentation powerpoint example. This is a five stage process. The stages in this process are customer class, affiliate, sales by warehouse, warehouse, profit by affiliate.

Best Practices To Create Marketing Document Portrait PDF
This slide outlines tips to develop marketing reports aimed at keeping marketing activities accountable to create value for company in competitive markets. It covers five practices schedule reports, gather feedback, create templates, use valuable data, data visualization. Presenting Best Practices To Create Marketing Document Portrait PDF to dispense important information. This template comprises five stages. It also presents valuable insights into the topics including Schedule Reports, Create Templates, Data Visualization. This is a completely customizable PowerPoint theme that can be put to use immediately. So, download it and address the topic impactfully.
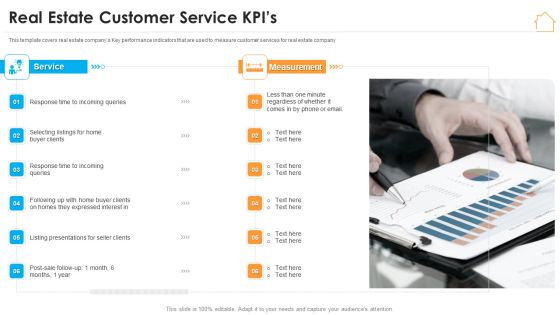
Real Estate Marketing Strategy Vendors Real Estate Customer Service Kpis Topics PDF
This template covers real estate companys Key performance indicators that are used to measure customer services for real estate company. Presenting real estate marketing strategy vendors real estate customer service kpis topics pdf to provide visual cues and insights. Share and navigate important information on six stages that need your due attention. This template can be used to pitch topics like measurement, buyer clients, service. In addtion, this PPT design contains high resolution images, graphics, etc, that are easily editable and available for immediate download.
Pandl Kpis Tabular Form Ppt PowerPoint Presentation Gallery Icon
This is a pandl kpis tabular form ppt powerpoint presentation gallery icon. This is a four stage process. The stages in this process are revenue, cogs, operating profit, net profit.
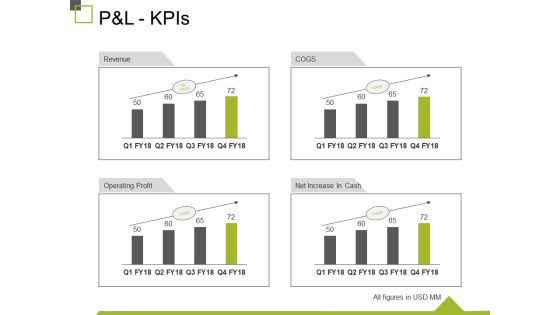
P And L Kpis Ppt PowerPoint Presentation Show Design Inspiration
This is a p and l kpis ppt powerpoint presentation show design inspiration. This is a four stage process. The stages in this process are revenue, operating profit, cogs, net increase in cash, business.
Pandl Kpis Template Ppt PowerPoint Presentation Model Icon
This is a pandl kpis template ppt powerpoint presentation model icon. This is a four stage process. The stages in this process are revenue, cogs, operating profit, net profit.
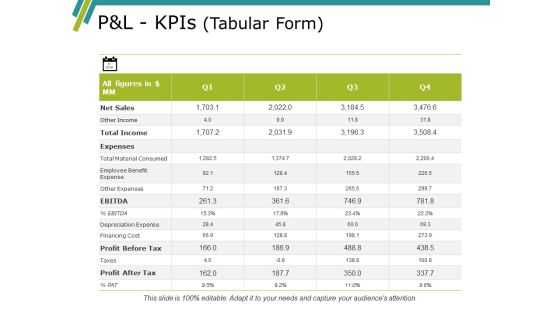
Pandl Kpis Template Ppt PowerPoint Presentation Gallery Summary
This is a pandl kpis template ppt powerpoint presentation gallery summary. This is a four stage process. The stages in this process are revenue, cogs, operating profit, net profit.
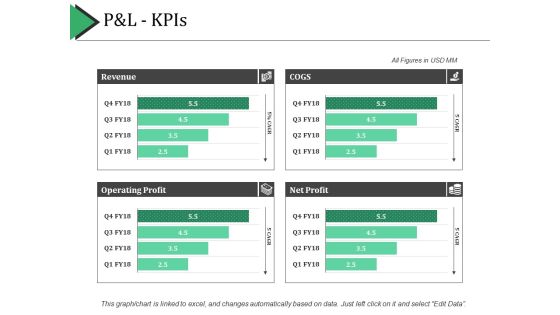
P And L Kpis Ppt PowerPoint Presentation Show Example Introduction
This is a p and l kpis ppt powerpoint presentation show example introduction. This is a four stage process. The stages in this process are revenue, cogs, net profit, operating profit.

Transforming Big Data Analytics To Knowledge Where Does Big Data Come From Ppt Gallery Styles PDF
This is a transforming big data analytics to knowledge where does big data come from ppt gallery styles pdf template with various stages. Focus and dispense information on six stages using this creative set, that comes with editable features. It contains large content boxes to add your information on topics like transactions, social media, emails, audio, log data. You can also showcase facts, figures, and other relevant content using this PPT layout. Grab it now.

Bar Plot For Data Visualization Ppt Powerpoint Presentation Pictures Guide
This is a bar plot for data visualization ppt powerpoint presentation pictures guide. This is a four stage process. The stages in this process are scatter plot, probability plots, plot diagram.

Social Networks Marketing To Improve Youtube Advertising Audience Overview Report Microsoft PDF
This slide represents statistical data representing the usage of YouTube by audience worldwide. It includes details related to potential reach of ads on YouTube, YouTube ad reach vs total population etc. Do you have an important presentation coming up Are you looking for something that will make your presentation stand out from the rest Look no further than Social Networks Marketing To Improve Youtube Advertising Audience Overview Report Microsoft PDF. With our professional designs, you can trust that your presentation will pop and make delivering it a smooth process. And with Slidegeeks, you can trust that your presentation will be unique and memorable. So why wait Grab Social Networks Marketing To Improve Youtube Advertising Audience Overview Report Microsoft PDF today and make your presentation stand out from the rest.

Cash Flow Statement Kpis Template 1 Ppt PowerPoint Presentation Pictures Microsoft
This is a cash flow statement kpis template 1 ppt powerpoint presentation pictures microsoft. This is a four stage process. The stages in this process are operations, financing activities, investing activities, net increase in cash.
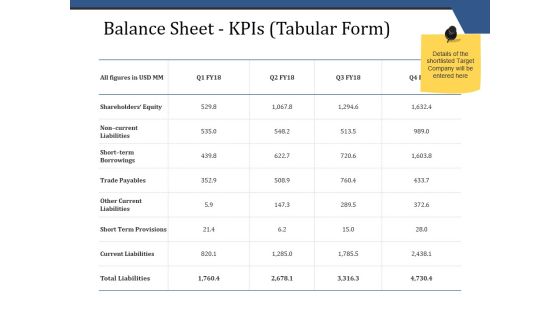
Balance Sheet Kpis Tabular Form Template 1 Ppt PowerPoint Presentation Infographics Picture
This is a balance sheet kpis tabular form template 1 ppt powerpoint presentation infographics picture. This is a four stage process. The stages in this process are business, finance, analysis, investment, strategy.

P And L Kpis Tabular Form Ppt PowerPoint Presentation Pictures Gallery
This is a p and l kpis tabular form ppt powerpoint presentation pictures gallery. This is a four stage process. The stages in this process are business, marketing, graph, strategy, finance.

Business Management Kpis Metrics Net Profit Ppt Show Structure PDF
Presenting business management kpis metrics net profit ppt show structure pdf. to provide visual cues and insights. Share and navigate important information on five stages that need your due attention. This template can be used to pitch topics like active customers sold units, total revenues, profit margin, net profit. In addtion, this PPT design contains high resolution images, graphics, etc, that are easily editable and available for immediate download.

Enterprise Tactical Planning Business Management Kpis Metrics Microsoft PDF
Presenting enterprise tactical planning business management kpis metrics microsoft pdf to provide visual cues and insights. Share and navigate important information on five stages that need your due attention. This template can be used to pitch topics like active customers, sold units, total revenues, net profit, profit margin. In addition, this PPT design contains high-resolution images, graphics, etc, that are easily editable and available for immediate download.
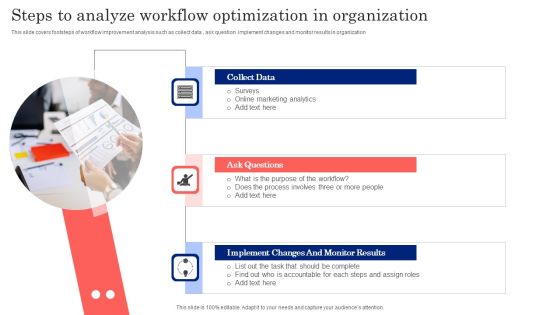
Steps To Analyze Workflow Optimization In Organization Pictures PDF
This slide covers footsteps of workflow improvement analysis such as collect data , ask question implement changes and monitor results in organization. Presenting Steps To Analyze Workflow Optimization In Organization Pictures PDF to dispense important information. This template comprises three stages. It also presents valuable insights into the topics including Collect Data, Surveys, Online Marketing Analytics. This is a completely customizable PowerPoint theme that can be put to use immediately. So, download it and address the topic impactfully.

Statistical Data Analysis Chart Of Collected Data Formats PDF
Presenting statistical data analysis chart of collected data formats pdf to dispense important information. This template comprises four stages. It also presents valuable insights into the topics including statistical data analysis chart of collected data. This is a completely customizable PowerPoint theme that can be put to use immediately. So, download it and address the topic impactfully.

Data Collection And Analysis Control Chart Ppt PowerPoint Presentation Example File
This is a data collection and analysis control chart ppt powerpoint presentation example file. This is a four stage process. The stages in this process are business, strategy, marketing, bar graph, growth strategy.

Graphical Exploratory Data Analysis Powerpoint Slides Clipart
This is a graphical exploratory data analysis powerpoint slides clipart. This is a five stage process. The stages in this process are techniques, information, predictive, focuses, business.

Identifying Key Metrics To Measure Success Of Our Marketing Efforts Download PDF
Purpose of the following slide is to identify the key metrics that the organization can use to track performance of their marketing efforts, these metrics are cost of acquisition, click through rate etc. Presenting Identifying Key Metrics To Measure Success Of Our Marketing Efforts Download PDF to provide visual cues and insights. Share and navigate important information on one stages that need your due attention. This template can be used to pitch topics like Social Media, Cost Per Acquisition, Key Marketing Metrics. In addtion, this PPT design contains high resolution images, graphics, etc, that are easily editable and available for immediate download.

Channel Kpis Ppt PowerPoint Presentation Infographic Template Topics
This is a channel kpis ppt powerpoint presentation infographic template topics. This is a four stage process. The stages in this process are business, timeline, strategy, finance, planning.

 Home
Home