Financial Snapshot

Dashboard Design And Development For Travel Diagram Background
This is a dashboard design and development for travel diagram background. This is a five stage process. The stages in this process are number of trips, sales, delayed flights, regional load, flight expense.

Team Manager Administration KPI Metrics And Dashboards Microsoft Pdf
This is a team manager administration kpi metrics and dashboards microsoft pdf. template with various stages. Focus and dispense information on two stages using this creative set, that comes with editable features. It contains large content boxes to add your information on topics like kpi metrics, dashboard metrics. You can also showcase facts, figures, and other relevant content using this PPT layout. Grab it now.

Monthly Social Media Dashboard Ppt PowerPoint Presentation Model Slide
This is a monthly social media dashboard ppt powerpoint presentation model slide. This is a four stage process. The stages in this process are sales, social events, business, finance, key social metrics.

Logistics KPI Metrics And Analytics Dashboard Ppt Slides Images PDF
Persuade your audience using this Logistics KPI Metrics And Analytics Dashboard Ppt Slides Images PDF. This PPT design covers four stages, thus making it a great tool to use. It also caters to a variety of topics including Logistics KPI, Metrics And Analytics, Dashboard. Download this PPT design now to present a convincing pitch that not only emphasizes the topic but also showcases your presentation skills.
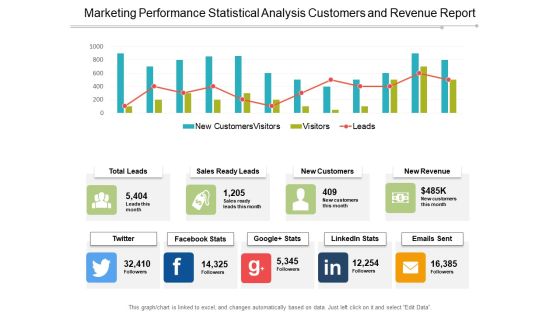
Marketing Performance Statistical Analysis Customers And Revenue Report Ppt PowerPoint Presentation Outline Shapes
This is a marketing performance statistical analysis customers and revenue report ppt powerpoint presentation outline shapes. This is a four stage process. The stages in this process are marketing analytics, marketing performance, marketing discovery.

Web Analytics Dashboard Click Through And Conversion Rate Ppt PowerPoint Presentation Professional
This is a web analytics dashboard click through and conversion rate ppt powerpoint presentation professional. This is a three stage process. The stages in this process are marketing analytics, marketing performance, marketing discovery.
Monthly Social Media Dashboard Ppt PowerPoint Presentation Icon Gallery
This is a monthly social media dashboard ppt powerpoint presentation icon gallery. This is a two stage process. The stages in this process are facebook, social traffic and conversion, referral traffic, conversions, key social metrics, pinterest, you tube.
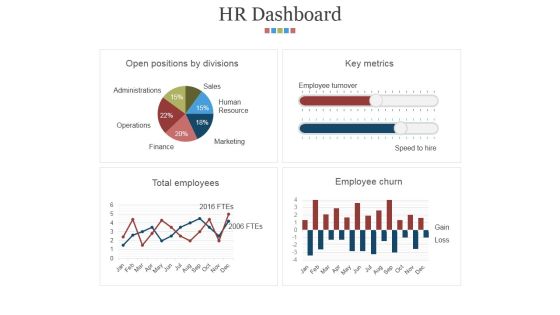
Hr Dashboard Template 2 Ppt PowerPoint Presentation Microsoft
This is a hr dashboard template 2 ppt powerpoint presentation microsoft. This is a four stage process. The stages in this process are open positions by divisions, key metrics, total employees, employee churn.
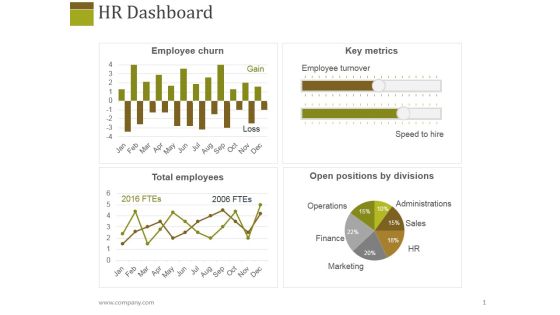
Hr Dashboard Template 1 Ppt PowerPoint Presentation Layouts Slideshow
This is a hr dashboard template 1 ppt powerpoint presentation layouts slideshow. This is a four stage process. The stages in this process are employee churn, key metrics, total employees, open positions by divisions.

Revenue Cycle Dashboard Powerpoint Images
This is a revenue cycle dashboard powerpoint images. This is a five stage process. The stages in this process are days after discharge, cash collections trend, days to bill trend by facility, days in ar by aging, managed care payer mix trend.
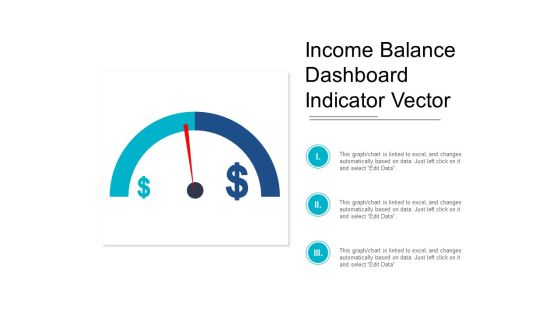
Income Balance Dashboard Indicator Vector Ppt PowerPoint Presentation Professional Diagrams
This is a income balance dashboard indicator vector ppt powerpoint presentation professional diagrams. This is a three stage process. The stages in this process are growth, increase sales, increase revenue.

Crm Dashboard Kpis Ppt PowerPoint Presentation Inspiration Brochure
This is a crm dashboard kpis ppt powerpoint presentation inspiration brochure. This is a three stage process. The stages in this process are acquisition, active subscribers, revenue.

Kpis In Shipping Perfect Order Rate And On Time Shipment Ppt PowerPoint Presentation Show Guide
This is a kpis in shipping perfect order rate and on time shipment ppt powerpoint presentation show guide. This is a six stage process. The stages in this process are logistics performance, logistics dashboard, logistics kpis.

Business Management Dashboard Powerpoint Graphics
This is a business management dashboard powerpoint graphics. This is a four stage process. The stages in this process are property system, crm system, asset system, finance system.

Business Management Dashboard Ppt Example
This is a business management dashboard ppt example. This is a three stage process. The stages in this process are sales figure, regional sales breakdown, product break.

Marketing Performance Measures Diagram Ppt Example
This is a marketing performance measures diagram ppt example. This is a four stage process. The stages in this process are low, moderate, good, maximum.
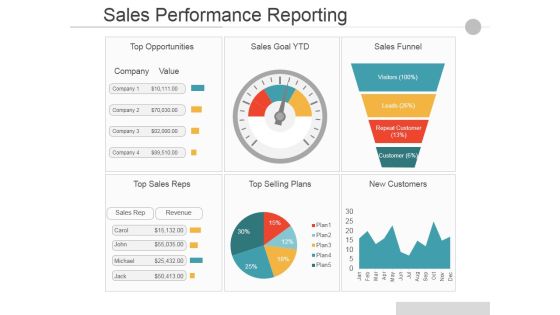
Sales Performance Reporting Ppt PowerPoint Presentation Infographics Portrait
This is a Sales Performance Reporting Ppt PowerPoint Presentation Infographics Portrait. This is a six stage process. The stages in this process are Top Opportunities, Sales Goal Ytd, Sales Funnel, Top Sales Reps, Top Selling Plans, New Customers.
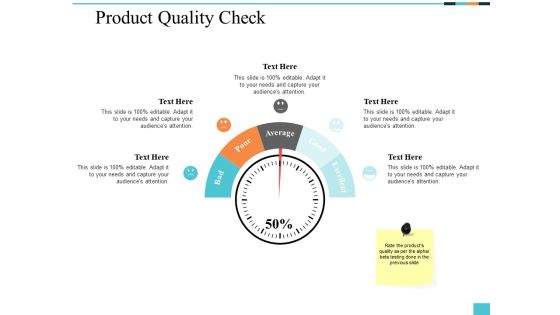
Product Quality Check Ppt PowerPoint Presentation Model Microsoft
This is a product quality check ppt powerpoint presentation model microsoft. This is a five stage process. The stages in this process are finance, marketing, management, investment, analysis.

Multiple Point Of Sale System Dashboard Depicting Restaurants Daily Performance Mockup PDF
This Slide represents point of sale system dashboard depicting restaurants daily performance which can be beneficial for eateries to manage their regular sales. It includes information about sales, expenditure, menu, customer data, bookings and reports. Persuade your audience using this Multiple Point Of Sale System Dashboard Depicting Restaurants Daily Performance Mockup PDF. This PPT design covers four stages, thus making it a great tool to use. It also caters to a variety of topics including Expenditure, Sales, Customer Data. Download this PPT design now to present a convincing pitch that not only emphasizes the topic but also showcases your presentation skills.

Performance Analysis Dashboard Icon For Email Communication Kpis Introduction PDF
Persuade your audience using this Performance Analysis Dashboard Icon For Email Communication Kpis Introduction PDF. This PPT design covers four stages, thus making it a great tool to use. It also caters to a variety of topics including Performance Analysis, Dashboard Icon, Email Communication, Kpis. Download this PPT design now to present a convincing pitch that not only emphasizes the topic but also showcases your presentation skills.

Dashboard Ppt Powerpoint Presentation Pictures Skills
This is a dashboard ppt powerpoint presentation pictures skills. This is a three stage process. The stages in this process are dashboard, business, marketing, finance.

Dashboard Ppt PowerPoint Presentation Ideas Pictures
This is a dashboard ppt powerpoint presentation ideas pictures. This is a three stage process. The stages in this process are dashboard, finance, percentage, business, management.

Crm Dashboard Intranet Dashboard Ppt PowerPoint Presentation Sample
This is a crm dashboard intranet dashboard ppt powerpoint presentation sample. This is a four stage process. The stages in this process are page views, events count, country, page views.

Crm Dashboard Intranet Dashboard Ppt PowerPoint Presentation Ideas Images
This is a crm dashboard intranet dashboard ppt powerpoint presentation ideas images. This is a four stage process. The stages in this process are page views, country, page views, events count.

Reporting Dashboard Ppt Presentation Powerpoint
This is a reporting dashboard ppt presentation powerpoint. This is a four stage process. The stages in this process are dashboard, visual analysis tools, scorecards, reports.
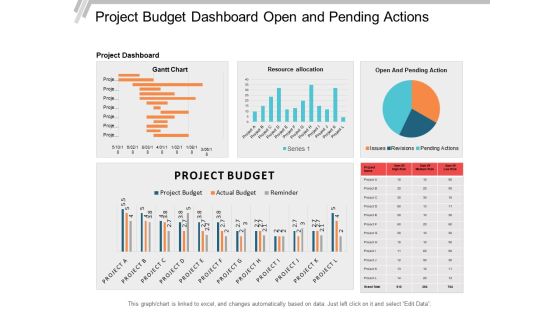
Project Budget Dashboard Open And Pending Actions Ppt PowerPoint Presentation File Templates
This is a project budget dashboard open and pending actions ppt powerpoint presentation file templates. This is a three stage process. The stages in this process are business analytics, ba, organizations data.

Dashboard Analytics Diagram Powerpoint Guide
This is a dashboard analytics diagram powerpoint guide. This is a three stage process. The stages in this process are value, analytic, reporting.

Dashboard Visualization Ppt Presentation Powerpoint
This is a dashboard visualization ppt presentation powerpoint. This is a three stage process. The stages in this process are design, category.
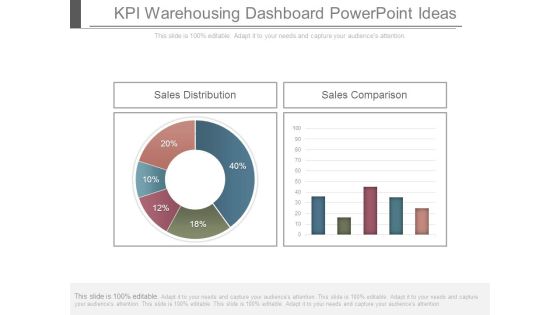
Kpi Warehousing Dashboard Powerpoint Ideas
This is a kpi warehousing dashboard powerpoint ideas. This is a two stage process. The stages in this process are sales distribution, sales comparison.
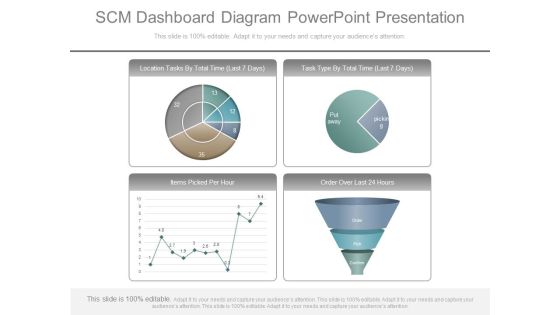
Scm Dashboard Diagram Powerpoint Presentation
This is a scm dashboard diagram powerpoint presentation. This is a four stage process. The stages in this process are location tasks by total time, task type by total time, items picked per hour, order over last.

Bank Dashboards Sample Ppt Templates
This is a bank dashboards sample ppt templates. This is a four stage process. The stages in this process are bank pipeline, loans pipeline, lead by source campaign, deposit pipeline, january, february, march, april.

Revenue Dashboard Ppt PowerPoint Presentation Professional Microsoft
This is a revenue dashboard ppt powerpoint presentation professional microsoft. This is a five stage process. The stages in this process are account industry verticals, calendar quarters, revenue thousand, thousands.
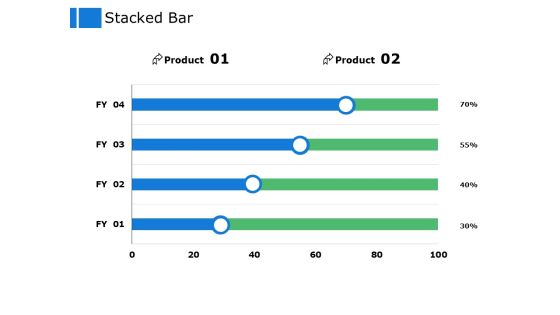
Stacked Bar Finance Ppt Powerpoint Presentation Pictures Clipart
This is a stacked bar finance ppt powerpoint presentation pictures clipart. This is a two stage process. The stages in this process are financial, marketing, analysis, investment, business.
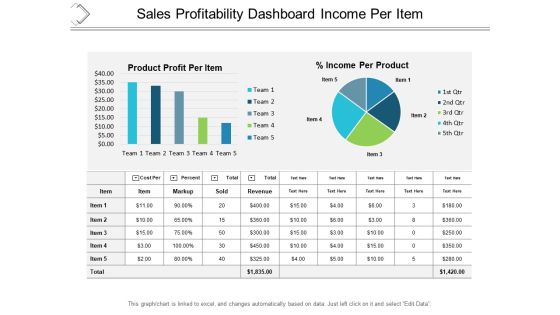
Sales Profitability Dashboard Income Per Item Ppt PowerPoint Presentation Professional Graphic Images
This is a sales profitability dashboard income per item ppt powerpoint presentation professional graphic images. This is a five stage process. The stages in this process are business analytics, ba, organizations data.

Appliances Energy And Cost Consumption Statistics Dashboard Download PDF
This graph or chart is linked to excel, and changes automatically based on data. Just left click on it and select edit data. Presenting Appliances Energy And Cost Consumption Statistics Dashboard Download PDF to dispense important information. This template comprises ten stages. It also presents valuable insights into the topics including Water Heater, Electric Vehicle, Pool Pump. This is a completely customizable PowerPoint theme that can be put to use immediately. So, download it and address the topic impactfully.

Talent Management Systems KPI Metrics And Dashboard Ppt File Vector PDF
This is a talent management systems kpi metrics and dashboard ppt file vector pdf template with various stages. Focus and dispense information on one stage using this creative set, that comes with editable features. It contains large content boxes to add your information on topics like kpi metrics and dashboard. You can also showcase facts, figures, and other relevant content using this PPT layout. Grab it now.
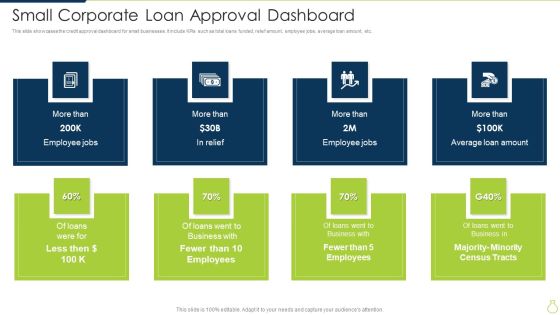
Small Corporate Loan Approval Dashboard Diagrams PDF
This slide showcases the credit approval dashboard for small businesses. It include KPIs such as total loans funded, relief amount, employee jobs, average loan amount, etc. Persuade your audience using this Small Corporate Loan Approval Dashboard Diagrams PDF. This PPT design covers eight stages, thus making it a great tool to use. It also caters to a variety of topics including Business, Loans, Census Tracts. Download this PPT design now to present a convincing pitch that not only emphasizes the topic but also showcases your presentation skills.

Sales Kpi Dashboard Graphics Example Of Ppt
This is a sales kpi dashboard graphics example of ppt. This is a five stage process. The stages in this process are cost per lead, revenue per lead, new customers, customer satisfaction, revenue per sale, cost per sale, profit per sale.

Mobile Commerce Dashboard Ppt Powerpoint Images
This is a mobile commerce dashboard ppt powerpoint images. This is a four stage process. The stages in this process are revenue by chennai, mobile vs site revenue, onsite behavior, mobile revenue and aov.

Business Intelligence Dashboard Design Ppt Powerpoint Topics
This is a business intelligence dashboard design ppt powerpoint topics. This is a four stage process. The stages in this process are sales analysis, sales forecasting, global distribution, sales by region, latin america, north america, eastern europe, western europe.
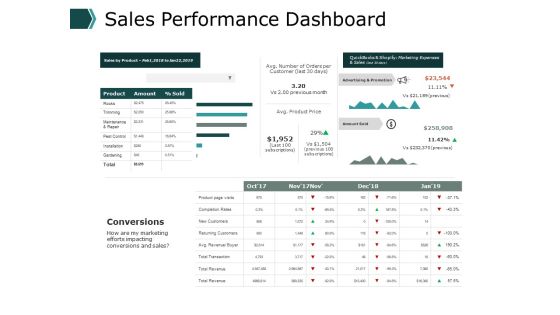
Sales Performance Dashboard Business Ppt PowerPoint Presentation Pictures Visuals
This is a sales performance dashboard business ppt powerpoint presentation pictures visuals . This is a three stage process. The stages in this process are finance, marketing, management, investment, analysis.

Kpi Dashboard Ppt Powerpoint Slide Design Templates
This is a kpi dashboard ppt powerpoint slide design templates. This is a four stage process. The stages in this process are sales, new customer, budget, resource and task.
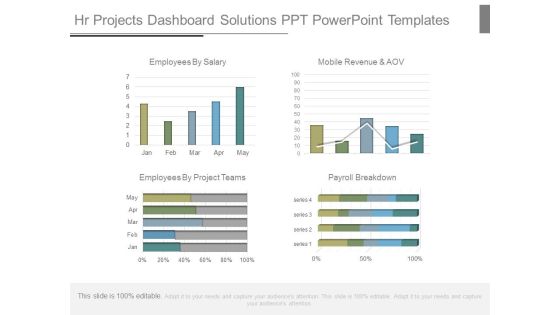
Hr Projects Dashboard Solutions Ppt Powerpoint Templates
This is a hr projects dashboard solutions ppt powerpoint templates. This is a four stage process. The stages in this process are employees by salary, mobile revenue and aov, employees by project teams, payroll breakdown, jan, feb, mar, apr, may, series.
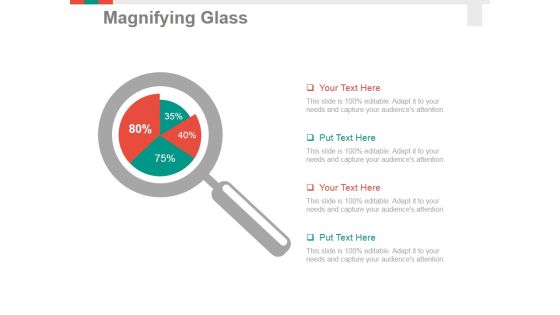
Magnifying Glass Ppt PowerPoint Presentation Pictures Graphics Design
This is a magnifying glass ppt powerpoint presentation pictures graphics design. This is a four stage process. The stages in this process are magnifier, search, marketing, analysis, business.
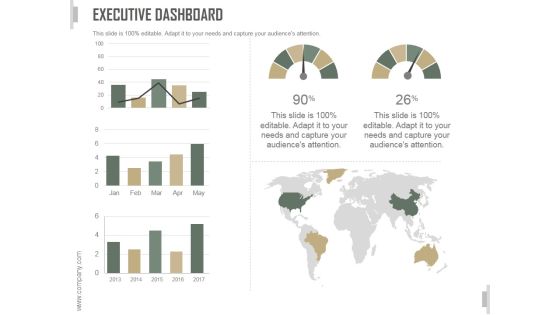
Executive Dashboard Ppt PowerPoint Presentation Examples
This is a executive dashboard ppt powerpoint presentation examples. This is a two stage process. The stages in this process are business, strategy, marketing, dashboard, location, bar chart.

Dashboard Finance Ppt PowerPoint Presentation Icon Aids
This is a dashboard finance ppt powerpoint presentation icon aids. This is a three stage process. The stages in this process are dashboard, finance, analysis, business, investment.

Dashboard Management Ppt Powerpoint Presentation Inspiration Model
This is a dashboard management ppt powerpoint presentation inspiration model. This is a three stage process. The stages in this process are dashboard, marketing, management, analysis, strategy.

Sample Of Designing Dashboards Powerpoint Images
This is a sample of designing dashboards powerpoint images. This is a four stage process. The stages in this process are finance, growth business, marketing, success.

Executive Dashboards Solution Diagram Powerpoint Slides
This is a executive dashboards solution diagram powerpoint slides. This is a two stage process. The stages in this process are change visibility, business environment.

Best Looking Dashboards Diagram Example File
This is a best looking dashboards diagram example file. This is a three stage process. The stages in this process are business, marketing, finance, presentation, management.

Bi Dashboard Gallery Diagram Powerpoint Presentation
This is a bi dashboard gallery diagram powerpoint presentation. This is a four stage process. The stages in this process are business intelligence, month.

Company Research Results Dashboard Ppt Background Graphics
This is a company research results dashboard ppt background graphics. This is a four stage process. The stages in this process are growth, business, marketing, year.

Dashboard Ppt PowerPoint Presentation Icon Model
This is a dashboard ppt powerpoint presentation icon model. This is a four stage process. The stages in this process are percentage, finance, business, donut.

Dashboard Marketing Planning Ppt PowerPoint Presentation Tips
This is a dashboard marketing planning ppt powerpoint presentation tips. This is a three stage process. The stages in this process are finance, analysis, business, investment, marketing.

Dashboard Contribution Ppt PowerPoint Presentation Summary Ideas
This is a dashboard contribution ppt powerpoint presentation summary ideas. This is a three stage process. The stages in this process are finance, business, management, strategy, analysis.
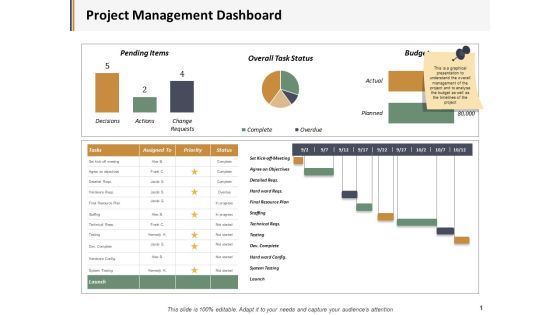
Project Management Dashboard Ppt PowerPoint Presentation Deck
This is a project management dashboard ppt powerpoint presentation deck. This is a five stage process. The stages in this process are business, management, marketing, percentage, product.

Project Dashboard Ppt PowerPoint Presentation Show Themes
This is a project dashboard ppt powerpoint presentation show themes. This is a eleven stage process. The stages in this process are finance, analysis, business, investment, marketing.
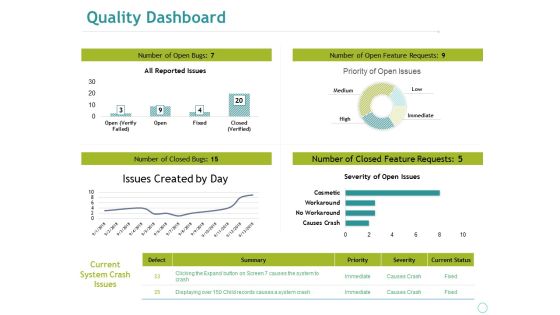
Quality Dashboard Ppt PowerPoint Presentation File Guide
This is a quality dashboard ppt powerpoint presentation file guide. This is a four stage process. The stages in this process are business, marketing, all reported issues, issues created by day, severity of open issues.

Project Management Dashboard Ppt PowerPoint Presentation Model Pictures
This is a project management dashboard ppt powerpoint presentation model pictures. This is a four stage process. The stages in this process are finance, analysis, business, investment, marketing.
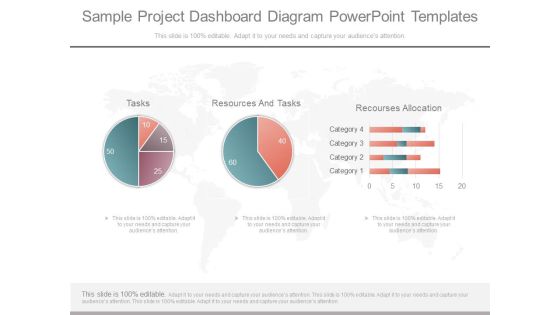
Sample Project Dashboard Diagram Powerpoint Templates
This is a sample project dashboard diagram powerpoint templates. This is a three stage process. The stages in this process are tasks, resources and tasks, resources allocation.

 Home
Home