Financial Snapshot
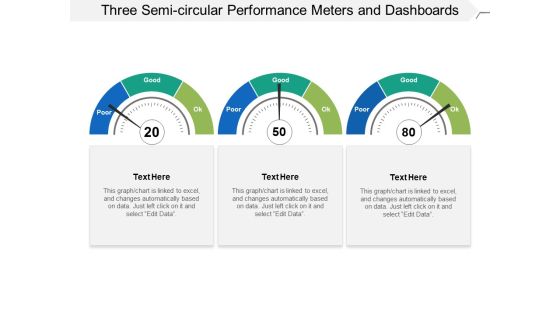
Three Semi Circular Performance Meters And Dashboards Ppt PowerPoint Presentation Slides Influencers
This is a three semi circular performance meters and dashboards ppt powerpoint presentation slides influencers. This is a three stage process. The stages in this process are fuel gauge, gas gauge, fuel containers.
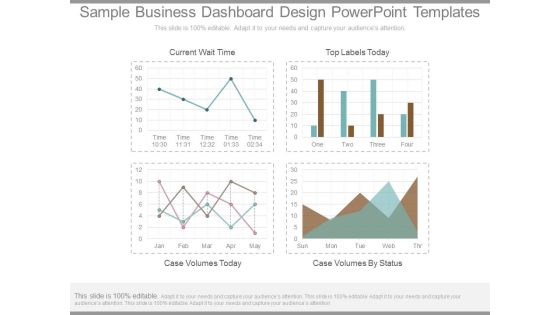
Sample Business Dashboard Design Powerpoint Templates
This is a sample business dashboard design powerpoint templates. This is a four stage process. The stages in this process are current wait time, top labels today, case volumes today, case volumes by status.
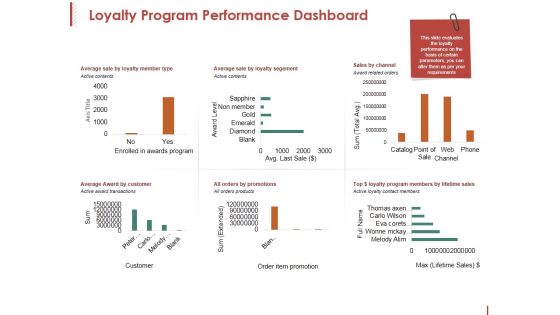
Loyalty Program Performance Dashboard Ppt PowerPoint Presentation Pictures Clipart
This is a loyalty program performance dashboard ppt powerpoint presentation pictures clipart. This is a six stage process. The stages in this process are axis title, award level, sum, active contents, channel.
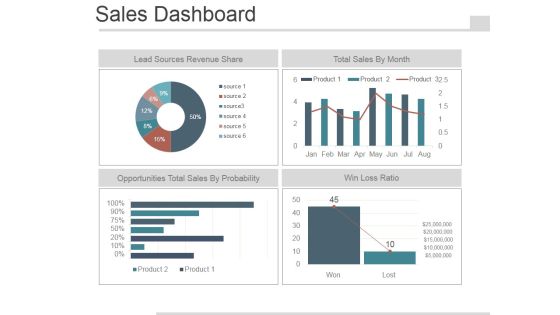
Sales Dashboard Slide Template 2 Ppt PowerPoint Presentation Images
This is a sales dashboard slide template 2 ppt powerpoint presentation images. This is a four stage process. The stages in this process are lead sources revenue share, total sales by month, opportunities total sales by probability, win loss ratio.
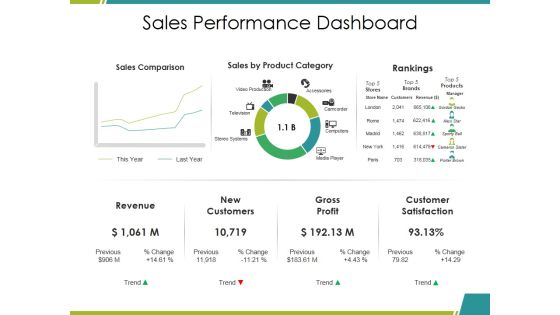
Sales Performance Dashboard Ppt PowerPoint Presentation Infographics Mockup
This is a sales performance dashboard ppt powerpoint presentation infographics mockup. This is a three stage process. The stages in this process are sales comparison, sales by product category, rankings, revenue, gross profit.

Sales Performance Dashboard Ppt PowerPoint Presentation Outline File Formats
This is a sales performance dashboard ppt powerpoint presentation outline file formats. This is a three stage process. The stages in this process are revenue, new customers, gross profit, customer satisfaction, rankings.

Sales Performance Dashboard Top Opportunities Ppt PowerPoint Presentation Layouts Template
This is a sales performance dashboard top opportunities ppt powerpoint presentation layouts template. This is a eight stage process. The stages in this process are revenue, new customer, gross profit, customer satisfaction, brand profitability.
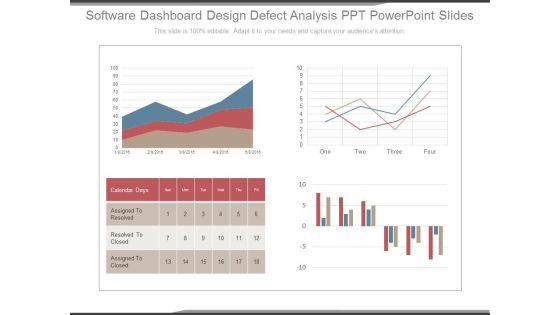
Software Dashboard Design Defect Analysis Ppt Powerpoint Slides
This is a software dashboard design defect analysis ppt powerpoint slides. This is a four stage process. The stages in this process are calendar days, assigned to resolved, resolved to closed, assigned to closed.

Business Review And Performance Assessment Dashboards Ppt PowerPoint Presentation Infographics Show
This is a business review and performance assessment dashboards ppt powerpoint presentation infographics show. This is a four stage process. The stages in this process are year in review, yearly highlights, countdowns.
How It Works E Mobility Startup Venture Capital Funding Pitch Deck Icons PDF
This slide will showcase the investors about technology or magic behind the product. Here the presenter will add the application process snapshots in order to attract the attention of audience. Deliver an awe inspiring pitch with this creative how it works e mobility startup venture capital funding pitch deck icons pdf bundle. Topics like how it works e mobility startup venture capital funding pitch deck can be discussed with this completely editable template. It is available for immediate download depending on the needs and requirements of the user.

Underlying Magic For Real Estate Capital Pitch Deck PowerPoint Presentation PPT Template PDF
Purpose of this slide is to address audience about the technology or magic behind the product. Here you will add a snapshots of your digital platform in order to attract the attention of investors. Presenting Underlying Magic For Real Estate Capital Pitch Deck PowerPoint Presentation PPT Template PDF to provide visual cues and insights. Share and navigate important information on four stages that need your due attention. This template can be used to pitch topics like Underlying Magic, Real Estate Capital. In addtion, this PPT design contains high resolution images, graphics, etc, that are easily editable and available for immediate download.
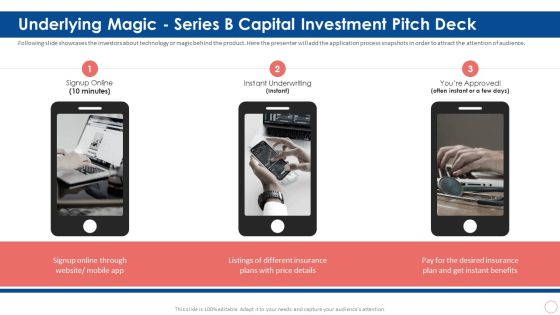
Underlying Magic Series B Capital Investment Pitch Deck Ppt Summary Graphics Template PDF
Following slide showcases the investors about technology or magic behind the product. Here the presenter will add the application process snapshots in order to attract the attention of audience. Presenting underlying magic series b capital investment pitch deck ppt summary graphics template pdf to provide visual cues and insights. Share and navigate important information on three stages that need your due attention. This template can be used to pitch topics like plans, price, insurance. In addtion, this PPT design contains high resolution images, graphics, etc, that are easily editable and available for immediate download.

Art And Gallery Event Sponsorship Capital Raising Pitch Deck Our Event Specific Underlying Magic Infographics PDF
Purpose of this slide is to address audience about the magic behind the festival. Here you will add a snapshots of your art and cultural festival in order to attract the attention of sponsors. Deliver an awe inspiring pitch with this creative art and gallery event sponsorship capital raising pitch deck our event specific underlying magic infographics pdf bundle. Topics like our event specific underlying magic can be discussed with this completely editable template. It is available for immediate download depending on the needs and requirements of the user.
Data Research And Analysis For Mobile Users Ppt PowerPoint Presentation Icon Inspiration
This is a data research and analysis for mobile users ppt powerpoint presentation icon inspiration. This is a four stage process. The stages in this process are mobile analytics, mobile tracking, mobile web analytics.
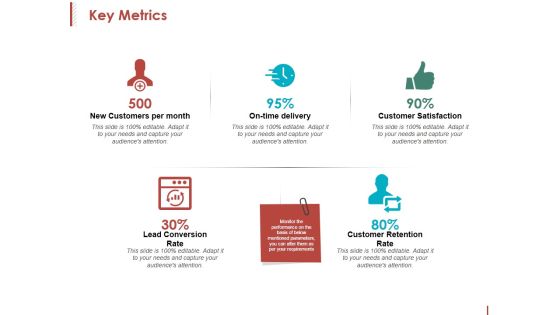
Key Metrics Ppt PowerPoint Presentation Inspiration Format
This is a key metrics ppt powerpoint presentation inspiration format. This is a five stage process. The stages in this process are new customers per month, on time delivery, customer satisfaction, customer retention rate.

Channel Kpis Ppt PowerPoint Presentation Inspiration Aids
This is a channel kpis ppt powerpoint presentation inspiration aids. This is a four stage process. The stages in this process are business, marketing, graph, percentage, finance.

Channel Kpis Ppt PowerPoint Presentation Model Smartart
This is a channel kpis ppt powerpoint presentation model smartart. This is a four stage process. The stages in this process are business, marketing, finance, years, percentage.

Bar Graph Icon For Research Analysis Ppt PowerPoint Presentation Summary Portfolio
Presenting this set of slides with name bar graph icon for research analysis ppt powerpoint presentation summary portfolio. This is a three stage process. The stages in this process are data visualization icon, research analysis, business focus. This is a completely editable PowerPoint presentation and is available for immediate download. Download now and impress your audience.

Data Representation Vector Icon Ppt PowerPoint Presentation Infographic Template Samples
Presenting this set of slides with name data representation vector icon ppt powerpoint presentation infographic template samples. This is a one stage process. The stages in this process are data visualization icon, research analysis, business focus. This is a completely editable PowerPoint presentation and is available for immediate download. Download now and impress your audience.
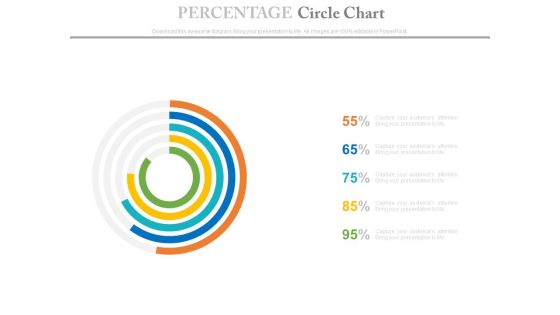
Percentage Data Circle Chart Powerpoint Slides
This PowerPoint template has been designed with circle chart. Download this PPT chart to depict financial ratio analysis. This PowerPoint slide is of great help in the business sector to make realistic presentations and provides effective way of presenting your newer thoughts.

Business Growth Kpis Ppt PowerPoint Presentation File Good
This is a business growth kpis ppt powerpoint presentation file good. This is a five stage process. The stages in this process are cost reduction strategies.

Data Driven Comparison Charts For Analysis Powerpoint Slides
You can download this PowerPoint template to display statistical data and analysis. This PPT slide contains data driven comparison charts. Draw an innovative business idea using this professional diagram.

Data Analysis Vector Icons Ppt Powerpoint Presentation Layouts Gridlines
This is a data analysis vector icons ppt powerpoint presentation layouts gridlines. This is a two stage process. The stages in this process are data presentation, content presentation, information presentation.

Data Interpretation Percentage Analysis Ppt Powerpoint Presentation Summary Icon
This is a data interpretation percentage analysis ppt powerpoint presentation summary icon. This is a six stage process. The stages in this process are data presentation, content presentation, information presentation.
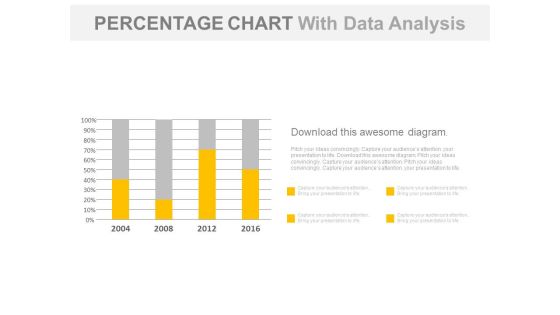
Year Based Chart With Percentage Data Analysis Powerpoint Slides
Our above business slide contains year based statistical chart. This PowerPoint template can be used to display percentage data analysis. Capture the attention of your audience with this slide.

Bar Graph For Data Distribution And Analysis Powerpoint Slides
This PowerPoint template has been designed with bar graph. This PowerPoint diagram is useful for data distribution and analysis This diagram slide can be used to make impressive presentations.
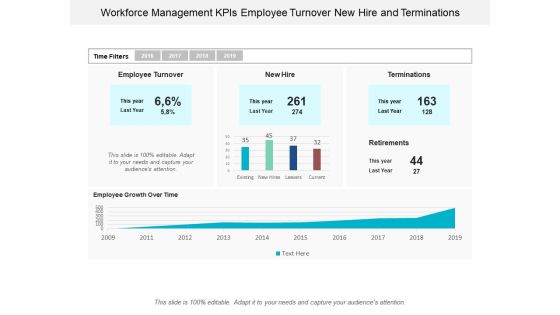
Workforce Management Kpis Employee Turnover New Hire And Terminations Ppt Powerpoint Presentation Portfolio Display
This is a workforce management kpis employee turnover new hire and terminations ppt powerpoint presentation portfolio display. This is a five stage process. The stages in this process are resource management, wealth management, capital management.
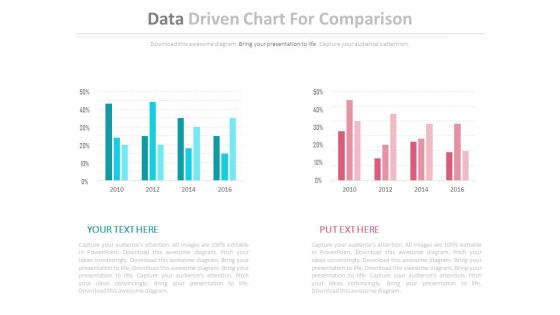
Two Data Driven Comparison Charts Powerpoint Slides
This PowerPoint template contains diagram of two data driven charts. You may use this PPT slide to depict strategic analysis for business. The color coding of this template is specifically designed to highlight you points.

Data Comparison And Analysis Chart Ppt Powerpoint Presentation File Background Images
This is a data comparison and analysis chart ppt powerpoint presentation file background images. This is a four stage process. The stages in this process are data presentation, content presentation, information presentation.

Competitor Analysis Ppt PowerPoint Presentation Pictures Visuals
This is a competitor analysis ppt powerpoint presentation pictures visuals. This is a four stage process. The stages in this process are sales development, performance indicators, sales development of industry, sales, revenue.

Goals Of Funding Ppt PowerPoint Presentation Pictures Format
This is a goals of funding ppt powerpoint presentation pictures format. This is a five stage process. The stages in this process are market share will increase by, operating cost will reduce by, revenue will increase by.

Filled Rader Ppt PowerPoint Presentation Pictures Format
This is a filled rader ppt powerpoint presentation pictures format. This is a two stage process. The stages in this process are product, radar, finance, business, management.

Radar Chart Ppt PowerPoint Presentation Pictures Themes
This is a radar chart ppt powerpoint presentation pictures themes. This is a two stage process. The stages in this process are product, radar chart, finance, business.
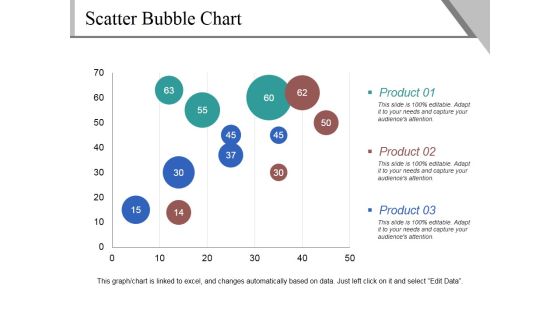
Scatter Bubble Chart Ppt PowerPoint Presentation Pictures Demonstration
This is a scatter bubble chart ppt powerpoint presentation pictures demonstration. This is a three stage process. The stages in this process are product, business, marketing, scatter chart.

Stock Chart Ppt PowerPoint Presentation Slides Graphics Pictures
This is a stock chart ppt powerpoint presentation slides graphics pictures. This is a two stage process. The stages in this process are product, high, volume, low, open.

Stacked Bar Ppt PowerPoint Presentation Visual Aids Pictures
This is a stacked bar ppt powerpoint presentation visual aids pictures. This is a two stage process. The stages in this process are product, percentage, finance, business, marketing.

Stacked Line Chart Ppt PowerPoint Presentation Pictures Elements
This is a stacked line chart ppt powerpoint presentation pictures elements. This is a two stage process. The stages in this process are product, profit, stacked line chart, year, business.
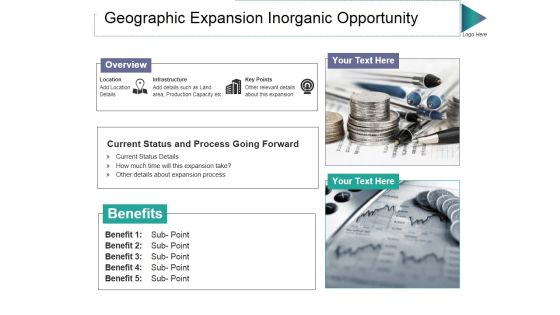
Geographic Expansion Inorganic Opportunity Ppt PowerPoint Presentation Pictures Maker
This is a geographic expansion inorganic opportunity ppt powerpoint presentation pictures maker. This is a two stage process. The stages in this process are overview, infrastructure, key points, location, benefits.

Stacked Line Ppt PowerPoint Presentation Pictures Example Topics
This is a stacked line ppt powerpoint presentation pictures example topics. This is a three stage process. The stages in this process are product, in percentage, stacked line, business, marketing.

Cost Reduction With Downward Arrow And Dollar Sign Ppt Powerpoint Presentation Infographics Templates
This is a cost reduction with downward arrow and dollar sign ppt powerpoint presentation infographics templates. This is a three stage process. The stages in this process are data analysis, data science, information science.
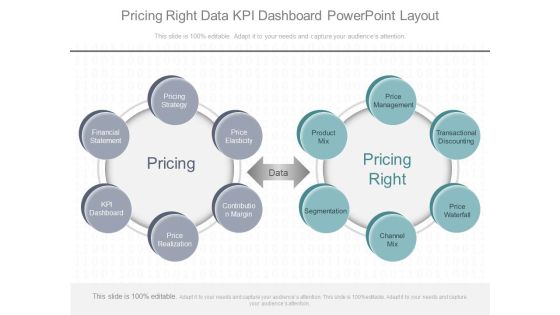
Pricing Right Data Kpi Dashboard Powerpoint Layout
This is a pricing right data kpi dashboard powerpoint layout. This is a two stage process. The stages in this process are price management, transactional discounting, price waterfall, channel mix, segmentation, product mix, price elasticity, contribution margin, price realization, kpi dashboard, financial statement, pricing, data, pricing right.

Digital Media And Teamwork For Business Powerpoint Slides
This PowerPoint template has been designed with media devices and team pictures. This professional PPT slide is suitable to present digital media and teamwork. Capture the attention of your audience using this professional slide.
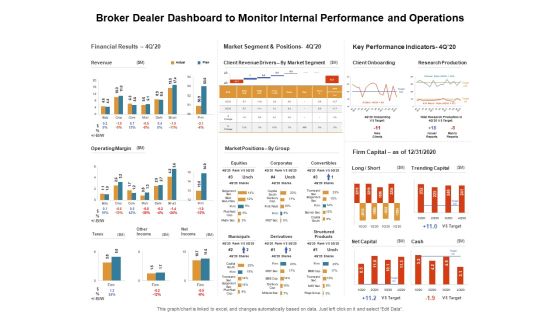
Venture Capitalist Control Board Broker Dealer Dashboard To Monitor Internal Performance And Operations Information PDF
Presenting this set of slides with name venture capitalist control board broker dealer dashboard to monitor internal performance and operations information pdf. The topics discussed in these slides are financial results, market segment and positions, key performance indicators. This is a completely editable PowerPoint presentation and is available for immediate download. Download now and impress your audience.

WMS Implementation Warehouse Management Dashboard Rules PDF
The slide demonstrates information regarding the warehouse management dashboard in order to track key activities. Deliver an awe-inspiring pitch with this creative wms implementation warehouse management dashboard rules pdf bundle. Topics like warehouse management dashboard, global financial performances, inventory can be discussed with this completely editable template. It is available for immediate download depending on the needs and requirements of the user.
Storage Logistics Warehouse Management Dashboard Icons PDF
The slide demonstrates information regarding the warehouse management dashboard in order to track key activities. Deliver an awe inspiring pitch with this creative storage logistics warehouse management dashboard icons pdf bundle. Topics like orders, kpls monthly, global financial performances can be discussed with this completely editable template. It is available for immediate download depending on the needs and requirements of the user.

Data Processing And Analysis Powerpoint Slides
This is a data processing and analysis powerpoint slides. This is a five stage process. The stages in this process are financial reporting and business excellence, competitive intelligence and strategy support, analysis and tool creation, planning and performance management support, data processing and analysis.

Commodity Unique Selling Proposition Marketing Kpi And Dashboard Formats PDF
Show your sale and financial highlights of through our dashboard. Deliver an awe inspiring pitch with this creative commodity unique selling proposition marketing kpi and dashboard formats pdf bundle. Topics like revenue, marketing, profit, cost can be discussed with this completely editable template. It is available for immediate download depending on the needs and requirements of the user.
Modifying Banking Functionalities Dashboard Tracking Customer Satisfaction Score Infographics PDF
This slide contains dashboard that depicts the overall customer satisfaction into quantitative form. Deliver an awe inspiring pitch with this creative enhancing financial institution operations dashboard tracking customer satisfaction score icons pdf bundle. Topics like dashboard tracking customer satisfaction score can be discussed with this completely editable template. It is available for immediate download depending on the needs and requirements of the user.
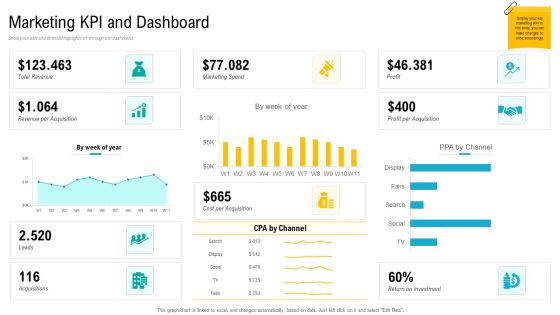
Product USP Marketing KPI And Dashboard Ppt Layouts Slides PDF
Show your sale and financial highlights of through our dashboard. Deliver an awe-inspiring pitch with this creative product usp marketing kpi and dashboard ppt layouts slides pdf bundle. Topics like marketing kpi and dashboard can be discussed with this completely editable template. It is available for immediate download depending on the needs and requirements of the user.
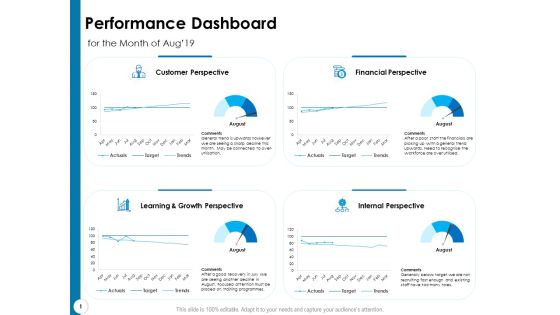
Strategy Execution Balanced Scorecard Performance Dashboard Elements PDF
Presenting this set of slides with name strategy execution balanced scorecard performance dashboard elements pdf. The topics discussed in these slides are customer perspective, financial perspective, internal perspective, learning and growth perspective. This is a completely editable PowerPoint presentation and is available for immediate download. Download now and impress your audience.

Reverse SCM Reverse Logistics Dashboard Past Ppt Slides Layouts PDF
Deliver an awe-inspiring pitch with this creative reverse scm reverse logistics dashboard past ppt slides layouts pdf bundle. Topics like financial performance, inventory, customer can be discussed with this completely editable template. It is available for immediate download depending on the needs and requirements of the user.
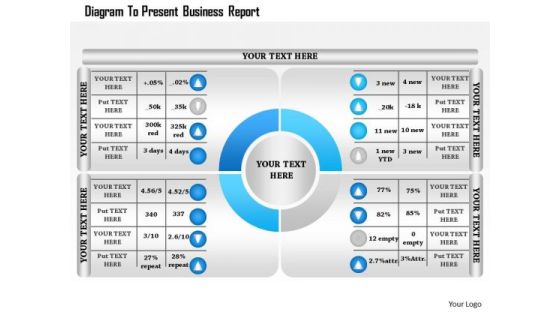
Business Diagram To Present Business Report Presentation Template
Four staged percentage personalized chart has been used to craft this power point template. This PPT contains the concept of data analysis and financial result analysis. This PPT can be used for your data and finance related topics in any business and marketing presentation.

Corporate Intelligence Business Analysis Foundational Data Modelling Risk Ppt Infographics Vector PDF
Deliver an awe-inspiring pitch with this creative corporate intelligence business analysis foundational data modelling risk ppt infographics vector pdf bundle. Topics like sources systems, data cubes, financial and reporting can be discussed with this completely editable template. It is available for immediate download depending on the needs and requirements of the user.

Closed Loop Supply Chain Management Reverse Logistics Dashboard Inventory Ppt Tips PDF
Presenting this set of slides with name closed loop supply chain management reverse logistics dashboard inventory ppt tips pdf. The topics discussed in these slides are customer, order status, order date, product, financial performance. This is a completely editable PowerPoint presentation and is available for immediate download. Download now and impress your audience.
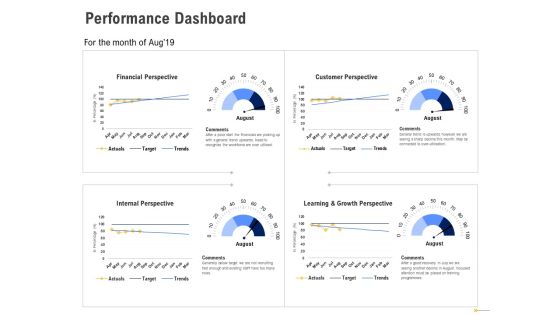
Using Balanced Scorecard Strategy Maps Drive Performance Dashboard Ppt Styles Themes PDF
Presenting this set of slides with name using balanced scorecard strategy maps drive performance dashboard ppt styles themes pdf. The topics discussed in these slides are financial perspective, customer perspective, internal perspective, learning and growth perspective. This is a completely editable PowerPoint presentation and is available for immediate download. Download now and impress your audience.

All About HRM Human Resources KPI Dashboard Sales Ppt Icon Deck PDF
Presenting this set of slides with name all about hrm human resources kpi dashboard sales ppt icon deck pdf. The topics discussed in these slides are manufacturing department, sales department, engineering department, financial department. This is a completely editable PowerPoint presentation and is available for immediate download. Download now and impress your audience.

Balanced Scorecard Outline Performance Dashboard Ppt PowerPoint Presentation Outline Slides PDF
Presenting this set of slides with name balanced scorecard outline performance dashboard ppt powerpoint presentation outline slides pdf. The topics discussed in these slides are financial perspective, customer perspective, internal perspective, learning and growth perspective, actual, target, trade. This is a completely editable PowerPoint presentation and is available for immediate download. Download now and impress your audience.

Construction Management Services And Action Plan Infrastructure KPI Dashboard Showing Resource Allocation Ideas PDF
Deliver an awe inspiring pitch with this creative construction management services and action plan infrastructure kpi dashboard showing resource allocation ideas pdf bundle. Topics like days per project, resource allocation, project financial can be discussed with this completely editable template. It is available for immediate download depending on the needs and requirements of the user.

Construction Engineering And Industrial Facility Management Infrastructure KPI Dashboard Showing Resource Allocation Sample PDF
Deliver an awe-inspiring pitch with this creative construction engineering and industrial facility management infrastructure kpi dashboard showing resource allocation sample pdf bundle. Topics like delivery timeline and resources, resource allocation, project financial can be discussed with this completely editable template. It is available for immediate download depending on the needs and requirements of the user.

Quality Control Kpi Dashboard Manufacturing Control Ppt Infographics Master Slide PDF
Deliver an awe inspiring pitch with this creative quality control kpi dashboard manufacturing control ppt infographics master slide pdf bundle. Topics like execution, severity, financial can be discussed with this completely editable template. It is available for immediate download depending on the needs and requirements of the user.

 Home
Home