Financial Planning Process

Stacked Area Clustered Column Ppt PowerPoint Presentation Gallery Images
This is a stacked area clustered column ppt powerpoint presentation gallery images. This is a three stage process. The stages in this process are business, in percentage, marketing, strategy, graph.

Data Collection Scatter Diagram Ppt PowerPoint Presentation Summary Deck
This is a data collection scatter diagram ppt powerpoint presentation summary deck. This is a three stage process. The stages in this process are business, marketing, strategy, finance, analysis.

Data Collection Scatter Diagram Ppt PowerPoint Presentation Professional Smartart
This is a data collection scatter diagram ppt powerpoint presentation professional smartart. This is a three stage process. The stages in this process are business, marketing, finance, graph, strategy.

Activity Ratios Template 1 Ppt PowerPoint Presentation Slides Example Topics
This is a activity ratios template 1 ppt powerpoint presentation slides example topics. This is a two stage process. The stages in this process are business, finance, strategy, marketing, analysis.

Activity Ratios Template 2 Ppt PowerPoint Presentation Summary Background Images
This is a activity ratios template 2 ppt powerpoint presentation summary background images. This is a two stage process. The stages in this process are business, finance, strategy, marketing, analysis.

Activity Ratios Template 3 Ppt PowerPoint Presentation Professional Graphic Tips
This is a activity ratios template 3 ppt powerpoint presentation professional graphic tips. This is a two stage process. The stages in this process are business, finance, marketing, strategy, analysis.

Activity Ratios Template 4 Ppt PowerPoint Presentation Gallery Slides
This is a activity ratios template 4 ppt powerpoint presentation gallery slides. This is a two stage process. The stages in this process are business, finance, marketing, strategy, analysis.

Balance Sheet Kpis Template 3 Ppt PowerPoint Presentation Infographic Template Demonstration
This is a balance sheet kpis template 3 ppt powerpoint presentation infographic template demonstration. This is a four stage process. The stages in this process are balance sheet, finance, marketing, strategy, analysis.
Stacked Bar Template 1 Ppt PowerPoint Presentation Icon Portfolio
This is a stacked bar template 1 ppt powerpoint presentation icon portfolio. This is a two stage process. The stages in this process are business, marketing, finance, graph, strategy.
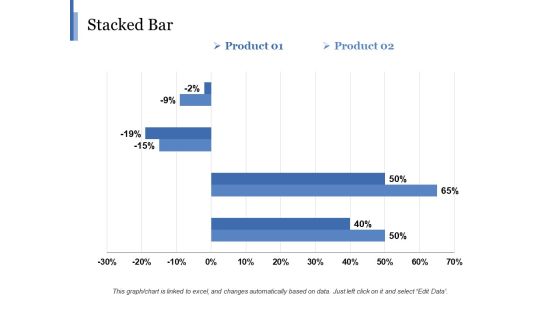
Stacked Bar Template 2 Ppt PowerPoint Presentation Gallery Background
This is a stacked bar template 2 ppt powerpoint presentation gallery background. This is a two stage process. The stages in this process are business, marketing, finance, graph, strategy, percentage.

Clustered Bar Ppt PowerPoint Presentation Professional Designs Download
This is a clustered bar ppt powerpoint presentation professional designs download. This is a three stage process. The stages in this process are clustered bar, finance, marketing, strategy, business.

Stacked Column Ppt PowerPoint Presentation Styles Graphic Images
This is a stacked column ppt powerpoint presentation styles graphic images. This is a two stage process. The stages in this process are stacked column, finance, marketing, strategy, business.

Balance Sheet Kpis Ppt PowerPoint Presentation Infographic Template Designs
This is a balance sheet kpis ppt powerpoint presentation infographic template designs. This is a four stage process. The stages in this process are business, marketing, finance, graph, strategy.
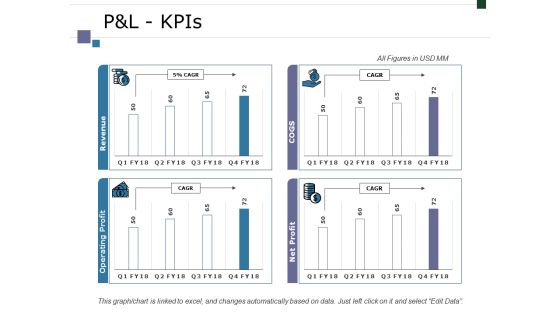
Pandl Kpis Ppt PowerPoint Presentation Infographic Template Graphics Tutorials
This is a pandl kpis ppt powerpoint presentation infographic template graphics tutorials. This is a four stage process. The stages in this process are business, marketing, finance, graph, strategy.
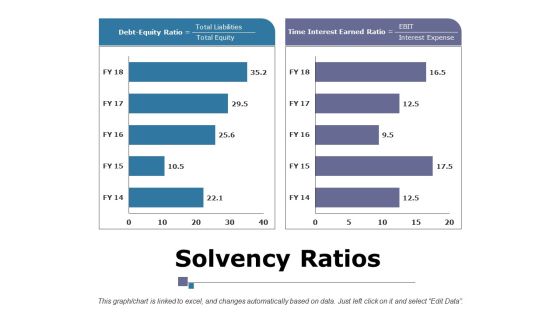
Solvency Ratios Ppt PowerPoint Presentation Summary Layouts
This is a solvency ratios ppt powerpoint presentation summary layouts. This is a two stage process. The stages in this process are business, marketing, strategy, debt equity ratio, time interest earned ratio, finance.
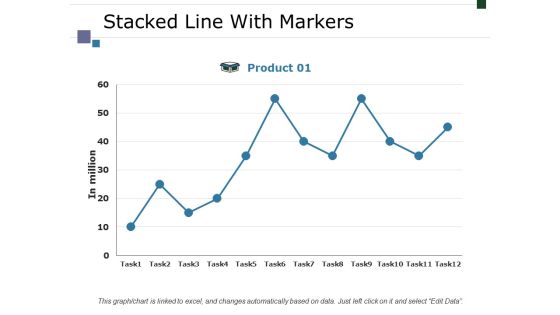
Stacked Line With Markers Ppt PowerPoint Presentation Layouts Display
This is a stacked line with markers ppt powerpoint presentation layouts display. This is a one stage process. The stages in this process are business, marketing, strategy, in million, finance.

Clustered Bar Ppt PowerPoint Presentation Styles Graphics
This is a clustered bar ppt powerpoint presentation styles graphics. This is a three stage process. The stages in this process are business, marketing, finance, graph, strategy, unit count.

Cash Flow Statement Kpis Ppt PowerPoint Presentation Pictures Graphics
This is a cash flow statement kpis ppt powerpoint presentation pictures graphics. This is a four stage process. The stages in this process are business, marketing, graph, finance, strategy.

Clustered Bar Ppt PowerPoint Presentation Pictures Clipart Images
This is a clustered bar ppt powerpoint presentation pictures clipart images. This is a three stage process. The stages in this process are business, marketing, graph, finance, strategy, unit count.

P And L Kpis Tabular Form Ppt PowerPoint Presentation Pictures Gallery
This is a p and l kpis tabular form ppt powerpoint presentation pictures gallery. This is a four stage process. The stages in this process are business, marketing, graph, strategy, finance.

Clustered Column Line Ppt PowerPoint Presentation Summary Example Topics
This is a clustered column line ppt powerpoint presentation summary example topics. This is a four stage process. The stages in this process are clustered column line, growth, marketing, strategy, business.

Competitor Comparison Template 1 Ppt PowerPoint Presentation Infographic Template Mockup
This is a competitor comparison template 1 ppt powerpoint presentation infographic template mockup. This is a five stage process. The stages in this process are business, marketing, graph, finance, strategy.

Competitor Comparison Template 2 Ppt PowerPoint Presentation Infographics Objects
This is a competitor comparison template 2 ppt powerpoint presentation infographics objects. This is a five stage process. The stages in this process are business, marketing, graph, finance, strategy.

Competitor Comparison Template 1 Ppt PowerPoint Presentation Layouts Slide Portrait
This is a competitor comparison template 1 ppt powerpoint presentation layouts slide portrait. This is a four stage process. The stages in this process are business, marketing, graph, finance, strategy.

Competitor Comparison Template 2 Ppt PowerPoint Presentation Inspiration Images
This is a competitor comparison template 2 ppt powerpoint presentation inspiration images. This is a five stage process. The stages in this process are business, marketing, graph, finance, strategy.

Clustered Column Ppt PowerPoint Presentation Inspiration Introduction
This is a clustered column ppt powerpoint presentation inspiration introduction. This is a two stage process. The stages in this process are business, marketing, in percentage, finance, graph, strategy.

Clustered Bar Ppt PowerPoint Presentation Icon Professional
This is a clustered bar ppt powerpoint presentation icon professional. This is a two stage process. The stages in this process are business, marketing, profit, clustered bar, finance, strategy.
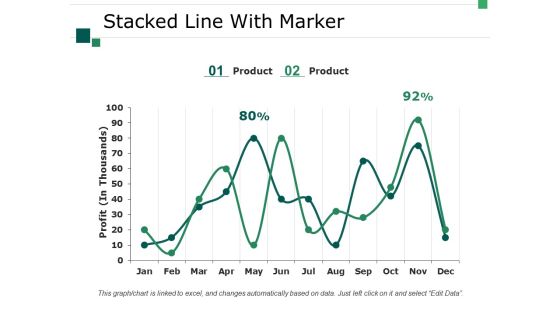
Stacked Line With Marker Ppt PowerPoint Presentation Professional Designs Download
This is a stacked line with marker ppt powerpoint presentation professional designs download. This is a two stage process. The stages in this process are business, marketing, strategy, graph, profit.
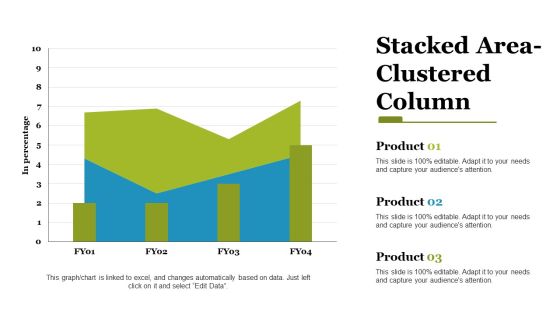
stacked area clustered column ppt powerpoint presentation styles files
This is a stacked area clustered column ppt powerpoint presentation styles files. This is a three stage process. The stages in this process are stacked area, clustered column, finance, marketing, strategy, business.

Bar Graph Companys Business Model Canvas Ppt PowerPoint Presentation Visual Aids Model
This is a bar graph companys business model canvas ppt powerpoint presentation visual aids model. This is a three stage process. The stages in this process are bar graph, finance, marketing, strategy, analysis, business.

Clustered Column Companys Business Model Canvas Ppt PowerPoint Presentation Slides Topics
This is a clustered column companys business model canvas ppt powerpoint presentation slides topics. This is a three stage process. The stages in this process are clustered column, finance, marketing, strategy, analysis, investment.
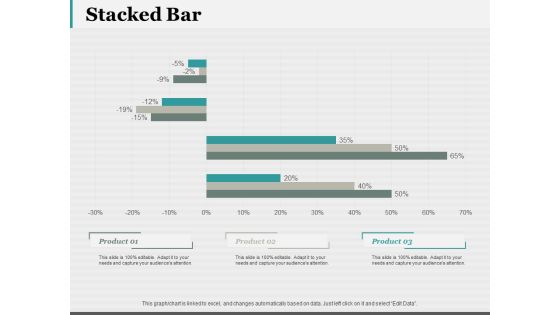
Stacked Bar 7 QC Tools Ppt PowerPoint Presentation Portfolio Smartart
This is a stacked bar 7 qc tools ppt powerpoint presentation portfolio smartart. This is a three stage process. The stages in this process are stacked bar, finance, marketing, strategy, business.
Stacked Column 7 QC Tools Ppt PowerPoint Presentation Icon
This is a stacked column 7 qc tools ppt powerpoint presentation icon. This is a three stage process. The stages in this process are stacked column, finance, marketing, strategy, business.
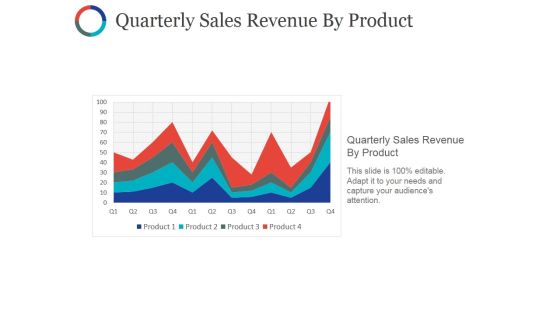
Quarterly Sales Revenue By Product Ppt PowerPoint Presentation Styles Slides
This is a quarterly sales revenue by product ppt powerpoint presentation styles slides. This is a four stage process. The stages in this process are quarterly sales revenue by product, charts, sales, business, success.
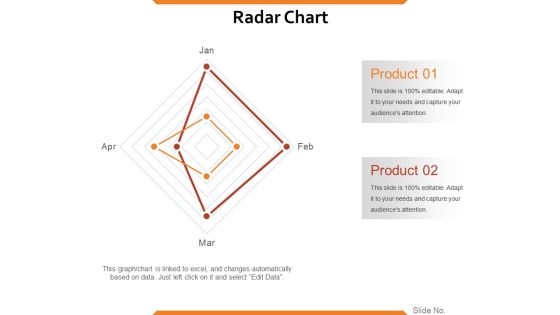
Radar Chart Ppt PowerPoint Presentation Gallery Skills
This is a radar chart ppt powerpoint presentation gallery skills. This is a two stage process. The stages in this process are product, radar chart, jan, feb, mar, apr.

Area Chart Ppt PowerPoint Presentation Infographics Guide
This is a area chart ppt powerpoint presentation infographics guide. This is a two stage process. The stages in this process are area chart, product, sales in percentage, finance, business.

Capital Expenditure Details Fy 18 Ppt PowerPoint Presentation Summary Themes
This is a capital expenditure details fy 18 ppt powerpoint presentation summary themes. This is a six stage process. The stages in this process are finance, marketing, business, analysis, strategy.

Data Collection And Analysis Control Chart Ppt PowerPoint Presentation Slide Download
This is a data collection and analysis control chart ppt powerpoint presentation slide download. This is a three stage process. The stages in this process are line chart, finance, marketing, management, investment.

Area Chart Ppt PowerPoint Presentation Pictures Show
This is a area chart ppt powerpoint presentation pictures show. This is a two stage process. The stages in this process are area chart, finance, marketing, management, investment, analysis.
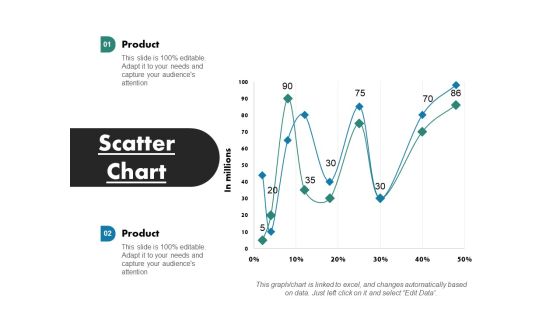
Scatter Chart Ppt PowerPoint Presentation Infographics Designs
This is a scatter chart ppt powerpoint presentation infographics designs. This is a two stage process. The stages in this process are scatter chart, finance, marketing, management, investment, analysis.
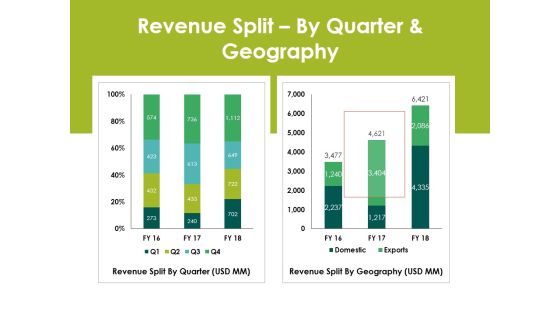
Revenue Splitby Quarter And Geography Ppt PowerPoint Presentation Layout
This is a revenue splitby quarter and geography ppt powerpoint presentation layout. This is a two stage process. The stages in this process are revenue split by quarter, revenue split by geography.

Internal Rate Of Return Valuation Summary Ppt PowerPoint Presentation Introduction
This is a internal rate of return valuation summary ppt powerpoint presentation introduction. This is a two stage process. The stages in this process are finance, business, marketing, strategy, analysis.
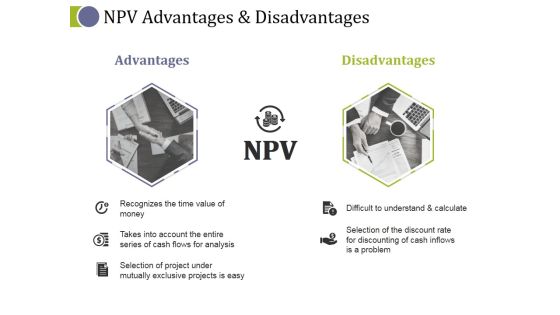
Npv Advantages And Disadvantages Ppt PowerPoint Presentation Ideas Deck
This is a npv advantages and disadvantages ppt powerpoint presentation ideas deck. This is a two stage process. The stages in this process are finance, marketing, analysis, business, strategy.

Competitor Revenue And Profit Ppt PowerPoint Presentation Slides Objects
This is a competitor revenue and profit ppt powerpoint presentation slides objects. This is a five stage process. The stages in this process are business, marketing, graph, finance, revenue.

Data Collection And Analysis Control Chart Ppt PowerPoint Presentation Summary Templates
This is a data collection and analysis control chart ppt powerpoint presentation summary templates. This is a one stage process. The stages in this process are business, marketing, point label, upper limit, lower limit.

Revenue Split By Product Segment Ppt PowerPoint Presentation Ideas Graphics
This is a revenue split by product segment ppt powerpoint presentation ideas graphics. This is a four stage process. The stages in this process are business, marketing, bar graph, success.

Competitor Revenue And Profit Ppt PowerPoint Presentation Inspiration Slide Portrait
This is a competitor revenue and profit ppt powerpoint presentation inspiration slide portrait. This is a five stage process. The stages in this process are business, finance, analysis, growth, investment.

Area Chart Ppt PowerPoint Presentation Inspiration Demonstration
This is a area chart ppt powerpoint presentation inspiration demonstration. This is a two stage process. The stages in this process are sales in percentage, chart, percentage, business, marketing.

Area Chart Ppt PowerPoint Presentation Portfolio Templates
This is a area chart ppt powerpoint presentation portfolio templates. This is a two stage process. The stages in this process are sales in percentage, chart, business, marketing, finance.

Bar Chart Ppt PowerPoint Presentation Slide Download
This is a bar chart ppt powerpoint presentation slide download. This is a three stage process. The stages in this process are chart, in years, unit count, business, marketing.

Area Chart Ppt PowerPoint Presentation Model Introduction
This is a area chart ppt powerpoint presentation model introduction. This is a two stage process. The stages in this process are sales in percentage, area chart, percentage, business, marketing.

Area Chart Ppt PowerPoint Presentation Styles Show
This is a area chart ppt powerpoint presentation styles show. This is a two stage process. The stages in this process are business, marketing, area chart, sales in percentage, percentage.

Area Chart Ppt PowerPoint Presentation Model Slides
This is a area chart ppt powerpoint presentation model slides. This is a two stage process. The stages in this process are business, marketing, sales in percentage, chart, percentage, finance.

Area Chart Ppt PowerPoint Presentation Ideas Professional
This is a area chart ppt powerpoint presentation ideas professional. This is a two stage process. The stages in this process are business, sales in percentage, area chart, marketing, finance.

Scatter Bubble Chart Ppt PowerPoint Presentation Professional
This is a scatter bubble chart ppt powerpoint presentation professional. This is a three stage process. The stages in this process are scatter bubble chart, product, in price, percentage, business.

Area Chart Ppt PowerPoint Presentation Slides Rules
This is a area chart ppt powerpoint presentation slides rules. This is a two stage process. The stages in this process are sales in percentage, business, marketing, product, finance.

Line Chart Ppt PowerPoint Presentation Professional Ideas
This is a line chart ppt powerpoint presentation professional ideas. This is a two stage process. The stages in this process are in percentage, product, business, marketing, finance, percentage.

Area Chart Ppt PowerPoint Presentation Summary Objects
This is a area chart ppt powerpoint presentation summary objects. This is a two stage process. The stages in this process are product, sales in percentage, finance, business, marketing.

Bar Chart Ppt PowerPoint Presentation Layouts Pictures
This is a bar chart ppt powerpoint presentation layouts pictures. This is a three stage process. The stages in this process are bar graph, product, sales in percentage, business, marketing.

Area Chart Ppt PowerPoint Presentation Show Templates
This is a area chart ppt powerpoint presentation show templates. This is a two stage process. The stages in this process are product, in percentage, in years, finance, graph.
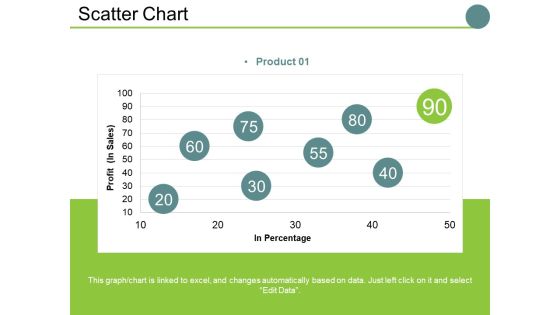
Scatter Chart Ppt PowerPoint Presentation Slides Examples
This is a scatter chart ppt powerpoint presentation slides examples. This is a one stage process. The stages in this process are profit , in percentage, business, marketing, finance, graph.

Area Chart Ppt PowerPoint Presentation Professional Brochure
This is a area chart ppt powerpoint presentation professional brochure. This is a two stage process. The stages in this process are sales in percentage, business, marketing, finance, graph.

Bar Chart Ppt PowerPoint Presentation Portfolio Diagrams
This is a bar chart ppt powerpoint presentation portfolio diagrams. This is a three stage process. The stages in this process are sales in percentage, business, marketing, graph, finance.

Bar Chart Ppt PowerPoint Presentation Icon Introduction
This is a bar chart ppt powerpoint presentation icon introduction. This is a seven stage process. The stages in this process are in years, in percentage, business, marketing, graph.

Column Chart Ppt PowerPoint Presentation Icon Guide
This is a column chart ppt powerpoint presentation icon guide. This is a two stage process. The stages in this process are business, year, sales in percentage, marketing, graph.

Area Chart Ppt PowerPoint Presentation Summary Information
This is a area chart ppt powerpoint presentation summary information. This is a two stage process. The stages in this process are business, sales in percentage, percentage, marketing, graph.

Area Chart Ppt PowerPoint Presentation Pictures Vector
This is a area chart ppt powerpoint presentation pictures vector. This is a two stage process. The stages in this process are sales in percentage, business, marketing, graph, percentage.

Bar Chart Ppt PowerPoint Presentation Model Sample
This is a bar chart ppt powerpoint presentation model sample. This is a two stage process. The stages in this process are sales in percentage, business, marketing, graph, percentage, year.

Combo Chart Finance Ppt PowerPoint Presentation Show Elements
This is a combo chart finance ppt powerpoint presentation show elements. This is a three stage process. The stages in this process are combo chart, finance, marketing, management, investment.

Area Chart Ppt PowerPoint Presentation Model Influencers
This is a area chart ppt powerpoint presentation model influencers. This is a two stage process. The stages in this process are sales in percentage, chart, business, marketing, finance.
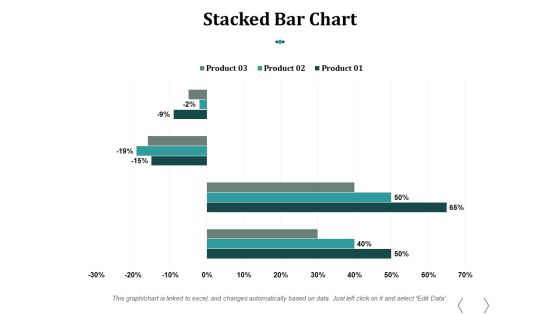
Stacked Bar Chart Ppt PowerPoint Presentation Influencers
This is a stacked bar chart ppt powerpoint presentation influencers. This is a three stage process. The stages in this process are stacked bar chart, product, percentage, finance, business.

Area Chart Marketing Finance Ppt PowerPoint Presentation Ideas Elements
This is a area chart marketing finance ppt powerpoint presentation ideas elements. This is a two stage process. The stages in this process are finance, analysis, business, investment, marketing.
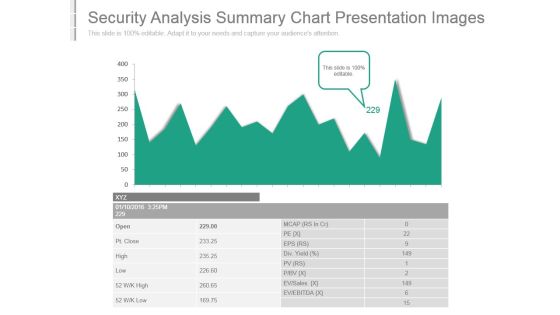
Security Analysis Summary Chart Presentation Images
This is a security analysis summary chart presentation images. This is a one stage process. The stages in this process are ev ebitda, ev sales, div yield, open, pt close, high, low, mcap, eps.

Bar Chart Ppt PowerPoint Presentation Portfolio Icons
This is a bar chart ppt powerpoint presentation portfolio icons. This is a seven stage process. The stages in this process are in years, in percentage, finance, business marketing.

Scatter Chart Ppt PowerPoint Presentation Summary Visuals
This is a scatter chart ppt powerpoint presentation summary visuals. This is a eight stage process. The stages in this process are product, profit in sales, in percentage, finance, business.

Current State Analysis Revenue Versus Target Ppt PowerPoint Presentation Background Designs
This is a current state analysis revenue versus target ppt powerpoint presentation background designs. This is a six stage process. The stages in this process are actual, target, actual vs target value.
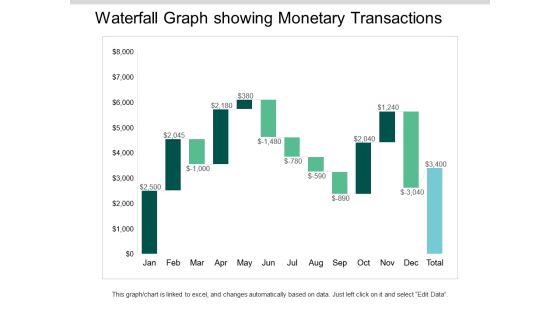
Waterfall Graph Showing Monetary Transactions Ppt PowerPoint Presentation Ideas Visuals
This is a waterfall graph showing monetary transactions ppt powerpoint presentation ideas visuals. This is a three stage process. The stages in this process are profit and loss, balance sheet, income statement, benefit and loss.

Revenue Split By Quarter And Geography Ppt PowerPoint Presentation Gallery Deck
This is a revenue split by quarter and geography ppt powerpoint presentation gallery deck. This is a two stage process. The stages in this process are business, marketing, graph, revenue split by quarter, revenue split by geography.
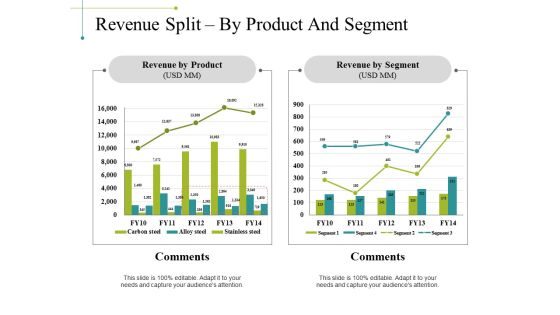
Revenue Split By Product And Segment Ppt PowerPoint Presentation Model Format Ideas
This is a revenue split by product and segment ppt powerpoint presentation model format ideas. This is a two stage process. The stages in this process are business, revenue by product, revenue by segment, comments, marketing.

Revenue Split By Quarter And Geography Ppt PowerPoint Presentation Slides Picture
This is a revenue split by quarter and geography ppt powerpoint presentation slides picture. This is a two stage process. The stages in this process are business, marketing, revenue split by quarter, revenue split by geography, comments.
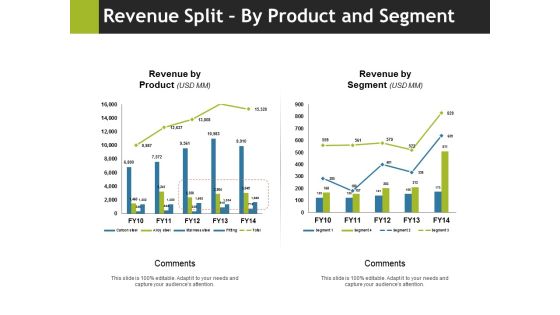
Revenue Split By Product And Segment Ppt PowerPoint Presentation Gallery Example
This is a revenue split by product and segment ppt powerpoint presentation gallery example. This is a two stage process. The stages in this process are comments, revenue by product, revenue by segment, business, marketing.
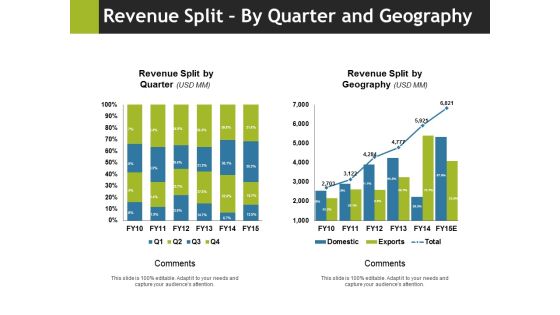
Revenue Split By Quarter And Geography Ppt PowerPoint Presentation Slides Vector
This is a revenue split by quarter and geography ppt powerpoint presentation slides vector. This is a two stage process. The stages in this process are revenue split by quarter, comments, revenue split by geography, business, marketing.

Revenue Split By Product Segment Template 2 Ppt PowerPoint Presentation Gallery Example File
This is a revenue split by product segment template 2 ppt powerpoint presentation gallery example file. This is a four stage process. The stages in this process are business, marketing, graph, finance, revenue split.

Monitoring The Resource Utilization Ppt PowerPoint Presentation Slides Rules
This is a monitoring the resource utilization ppt powerpoint presentation slides rules. This is a three stage process. The stages in this process are scheduled utilization, actual utilization, projected revenue.

Bar Chart Management Investment Ppt PowerPoint Presentation File Rules
This is a bar chart management investment ppt powerpoint presentation file rules. This is a three stage process. The stages in this process are finance, marketing, management, investment, analysis.

Column Chart Marketing Management Ppt PowerPoint Presentation Infographic Template Icon
This is a column chart marketing management ppt powerpoint presentation infographic template icon. This is a two stage process. The stages in this process are finance, marketing, management, investment, analysis.

Competitor Revenue And Profit Template Ppt PowerPoint Presentation Model Design Inspiration
This is a competitor revenue and profit template ppt powerpoint presentation model design inspiration. This is a five stage process. The stages in this process are business, marketing, graph, success, growth.

Competitor Revenue And Profit Template 1 Ppt PowerPoint Presentation Layouts Display
This is a competitor revenue and profit template 1 ppt powerpoint presentation layouts display. This is a five stage process. The stages in this process are business, bar graph, finance, marketing, analysis.

Competitor Market Share And Sales Revenues Ppt PowerPoint Presentation Professional Design Inspiration
This is a competitor market share and sales revenues ppt powerpoint presentation professional design inspiration. This is a four stage process. The stages in this process are your figures, development, business, marketing, graph.

Competitor Market Share And Sales Revenues Ppt PowerPoint Presentation Portfolio Pictures
This is a competitor market share and sales revenues ppt powerpoint presentation portfolio pictures. This is a four stage process. The stages in this process are business, your figures, development, marketing, graph.

Competitor Market Share And Sales Revenues Ppt PowerPoint Presentation File Demonstration
This is a competitor market share and sales revenues ppt powerpoint presentation file demonstration. This is a six stage process. The stages in this process are business, marketing, finance, your figures, development.
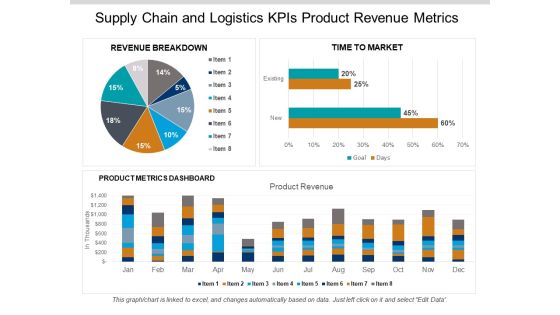
Supply Chain And Logistics Kpis Product Revenue Metrics Ppt PowerPoint Presentation Gallery Aids
This is a supply chain and logistics kpis product revenue metrics ppt powerpoint presentation gallery aids. This is a three stage process. The stages in this process are logistics performance, logistics dashboard, logistics kpis.

Retail KPI Dashboard Showing Revenue Vs Units Sold Ppt PowerPoint Presentation Professional Smartart
This is a retail kpi dashboard showing revenue vs units sold ppt powerpoint presentation professional smartart. This is a four stage process. The stages in this process are finance, analysis, business, investment, marketing.

Retail KPI Dashboard Showing Sales Revenue Customers Ppt PowerPoint Presentation Show Background Designs
This is a retail kpi dashboard showing sales revenue customers ppt powerpoint presentation show background designs. This is a six stage process. The stages in this process are finance, analysis, business, investment, marketing.
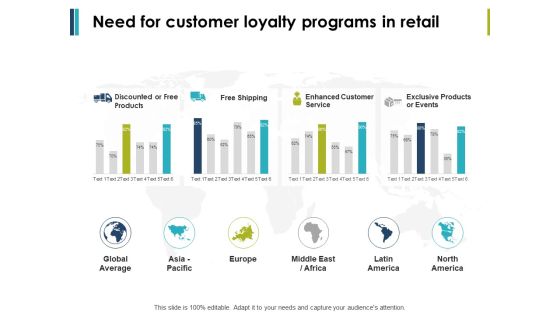
Need For Customer Loyalty Programs In Retail Ppt PowerPoint Presentation Portfolio Template
This is a need for customer loyalty programs in retail ppt powerpoint presentation portfolio template. This is a four stage process. The stages in this process are finance, marketing, management, investment, analysis.
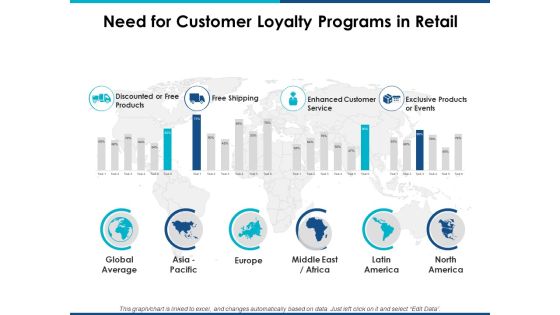
Need For Customer Loyalty Programs In Retail Ppt Powerpoint Presentation Portfolio Grid
This is a need for customer loyalty programs in retail ppt powerpoint presentation portfolio grid. This is a ten stage process. The stages in this process are finance, marketing, management, investment, analysis.

Column Chart Analysis Ppt Powerpoint Presentation Summary Infographics
This is a column chart analysis ppt powerpoint presentation summary infographics. This is a three stage process. The stages in this process are column chart, finance, marketing, management, analysiscolumn chart, finance, marketing, management, analysis.

Combo Chart Analysis Management Ppt PowerPoint Presentation Professional Gridlines
This is a combo chart analysis management ppt powerpoint presentation professional gridlines. This is a three stage process. The stages in this process are combo chart, finance, marketing, business, analysis.
Scatter Bubble Chart Ppt PowerPoint Presentation Model Icon
This is a scatter bubble chart ppt powerpoint presentation model icon. This is a three stage process. The stages in this process are finance, business, management, marketing, chart and graph.

Area Chart Finance Ppt Powerpoint Presentation Slides Picture
This is a area chart finance ppt powerpoint presentation slides picture. This is a three stage process. The stages in this process are area chart, finance, marketing, management, investment.

Area Chart Finance Ppt Powerpoint Presentation Inspiration Example
This is a area chart finance ppt powerpoint presentation inspiration example. This is a three stage process. The stages in this process are area chart, finance, marketing, management, investment.

Combo Chart Finance Marketing Ppt Powerpoint Presentation Layouts Inspiration
This is a combo chart finance marketing ppt powerpoint presentation layouts inspiration. This is a three stage process. The stages in this process are combo chart, finance, marketing, management, analysis.

Column Chart Finance Ppt PowerPoint Presentation Infographics Backgrounds
This is a column chart finance ppt powerpoint presentation infographics backgrounds. This is a two stage process. The stages in this process are column chart, investment, marketing, finance, analysis.

donut pie chart investment ppt powerpoint presentation show guide
This is a donut pie chart investment ppt powerpoint presentation show guide. This is a four stage process. The stages in this process are donut pie chart, finance, marketing, business, analysis.

Area Chart Finance Ppt Powerpoint Presentation Infographic Template Clipart Images
This is a area chart finance ppt powerpoint presentation infographic template clipart images. This is a two stage process. The stages in this process are area bar, finance, marketing, management, analysis.
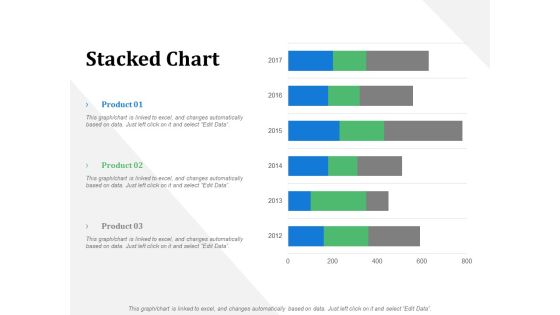
Stacked Chart Business Marketing Ppt PowerPoint Presentation File Design Ideas
This is a stacked chart business marketing ppt powerpoint presentation file design ideas. This is a three stage process. The stages in this process are business, management, marketing, product, percentage.
Open High Low Close Chart Ppt PowerPoint Presentation Icon Portrait
This is a open high low close chart ppt powerpoint presentation icon portrait. This is a two stage process. The stages in this process are business, management, marketing, percentage, product.

Bubble Chart Percentage Product Ppt PowerPoint Presentation Ideas Aids
This is a bubble chart percentage product ppt powerpoint presentation ideas aids. This is a two stage process. The stages in this process are business, management, marketing, percentage, product.

Bar Chart Business Management Ppt PowerPoint Presentation Ideas Example Introduction
This is a bar chart business management ppt powerpoint presentation ideas example introduction. This is a three stage process. The stages in this process are finance, marketing, management, investment, analysis.
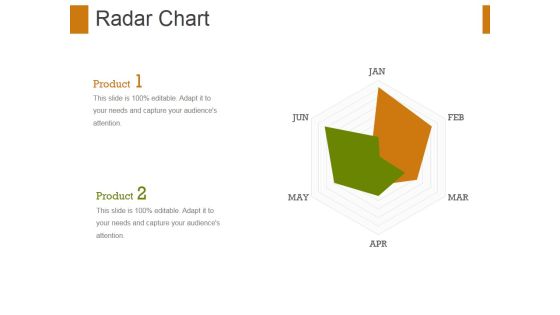
Radar Chart Ppt PowerPoint Presentation Show Graphic Tips
This is a radar chart ppt powerpoint presentation show graphic tips. This is a two stage process. The stages in this process are radar chart, finance, management, marketing, business, analysis.
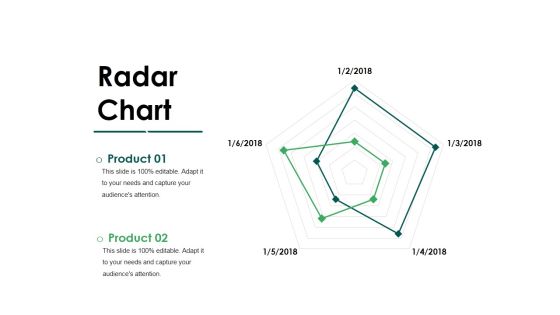
Radar Chart Ppt PowerPoint Presentation Inspiration File Formats
This is a radar chart ppt powerpoint presentation inspiration file formats. This is a two stage process. The stages in this process are radar chart, business, finance, management, analysis.

Area Chart Finance Ppt PowerPoint Presentation Show Brochure
This is a area chart finance ppt powerpoint presentation show brochure. This is a two stage process. The stages in this process are area chart, finance, marketing, management, investment.

Column Chart Analysis Ppt PowerPoint Presentation Icon Structure
This is a column chart analysis ppt powerpoint presentation icon structure. This is a three stage process. The stages in this process are column chart, finance, marketing, management, investment.

Area Chart Investment Ppt PowerPoint Presentation Gallery Example Introduction
This is a area chart investment ppt powerpoint presentation gallery example introduction. This is a three stage process. The stages in this process are area chart, finance, marketing, management, investment.

Area Chart Product Percentage Ppt PowerPoint Presentation Infographic Template Slide
This is a area chart product percentage ppt powerpoint presentation infographic template slide. This is a four stage process. The stages in this process are area chart, finance, marketing, management, investment.

Area Chart Percentage Ppt PowerPoint Presentation Portfolio Pictures
This is a area chart percentage ppt powerpoint presentation portfolio pictures. This is a three stage process. The stages in this process are area chart, finance, marketing, management, investment.

Area Chart Percentage Product Ppt PowerPoint Presentation Infographic Template Slide
This is a area chart percentage product ppt powerpoint presentation infographic template slide. This is a two stage process. The stages in this process are area chart, finance, marketing, management, investment.

High Low Close Chart Ppt Powerpoint Presentation Gallery Slides
This is a high low close chart ppt powerpoint presentation gallery slides. This is a five stage process. The stages in this process are close, volume, high, low, graph.

Combo Chart Finance Ppt PowerPoint Presentation Infographic Template Microsoft
This is a combo chart finance ppt powerpoint presentation infographic template microsoft. This is a three stage process. The stages in this process are finance, marketing, management, investment, analysis.
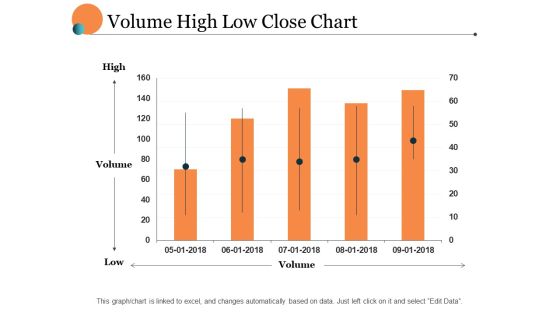
Volume High Low Close Chart Ppt PowerPoint Presentation Portfolio Layout
This is a volume high low close chart ppt powerpoint presentation portfolio layout. This is a five stage process. The stages in this process are finance, marketing, management, investment, analysis.

Bar Chart Finance Ppt PowerPoint Presentation Model Master Slide
This is a bar chart finance ppt powerpoint presentation model master slide. This is a two stage process. The stages in this process are finance, marketing, management, investment, analysis.

Area Chart Finance Ppt PowerPoint Presentation Summary Design Templates
This is a area chart finance ppt powerpoint presentation summary design templates. This is a two stage process. The stages in this process are finance, marketing, management, investment, analysis.

Clustered Bar Chart Finance Ppt PowerPoint Presentation Summary Layouts
This is a clustered bar chart finance ppt powerpoint presentation summary layouts. This is a two stage process. The stages in this process are finance, marketing, management, investment, analysis.

Area Chart Investment Ppt PowerPoint Presentation Summary Design Inspiration
This is a area chart investment ppt powerpoint presentation summary design inspiration. This is a three stage process. The stages in this process are finance, marketing, management, investment, analysis.

Column Chart Finance Ppt Powerpoint Presentation Infographic Template Icon
This is a column chart finance ppt powerpoint presentation infographic template icon. This is a three stage process. The stages in this process are finance, marketing, management, investment, analysis.

Bubble Chart Product Ppt PowerPoint Presentation Inspiration Design Ideas
This is a bubble chart product ppt powerpoint presentation inspiration design ideas. This is a one stage process. The stages in this process are business, management, marketing, product, percentage.
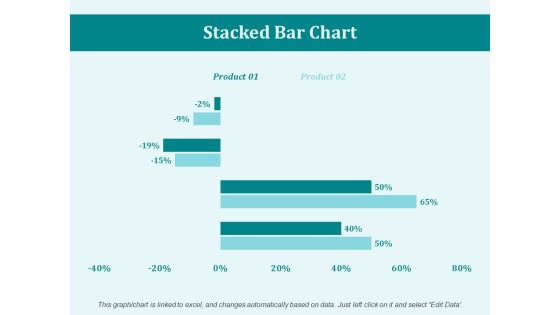
Stacked Bar Chart Percentage Ppt PowerPoint Presentation Portfolio Mockup
This is a stacked bar chart percentage ppt powerpoint presentation portfolio mockup. This is a two stage process. The stages in this process are business, marketing, management, percentage, product.

Bubble Chart Percentage Ppt PowerPoint Presentation File Layouts
This is a bubble chart percentage ppt powerpoint presentation file layouts. This is a two stage process. The stages in this process are finance, marketing, management, investment, product, percentage.

Bar Chart Finance Marketing Ppt PowerPoint Presentation File Good
This is a bar chart finance marketing ppt powerpoint presentation file good. This is a three stage process. The stages in this process are finance, marketing, management, investment, analysis.
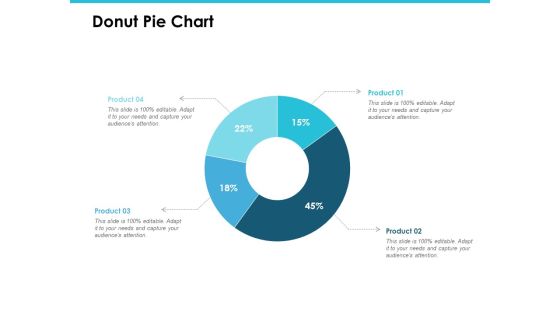
Donut Pie Chart Investment Analysis Ppt PowerPoint Presentation Gallery Introduction
This is a donut pie chart investment analysis ppt powerpoint presentation gallery introduction. This is a four stage process. The stages in this process are finance, marketing, management, investment, analysis.

Project Status Bar Chart Ppt PowerPoint Presentation Ideas Objects
This is a project status bar chart ppt powerpoint presentation ideas objects. This is a four stage process. The stages in this process are project management, project progress, project growth.

Area Chart Finance Ppt PowerPoint Presentation Infographics Design Ideas
This is a area chart finance ppt powerpoint presentation infographics design ideas. This is a three stage process. The stages in this process are area chart, finance, marketing, management, investment.

Area Chart Ppt PowerPoint Presentation Show Graphics Tutorials
This is a area chart ppt powerpoint presentation show graphics tutorials. This is a two stage process. The stages in this process are area chart, percentage, product, marketing, management.

Bar Chart Finance Ppt Powerpoint Presentation Styles Skills
This is a bar chart finance ppt powerpoint presentation styles skills. This is a three stage process. The stages in this process are bar chart, finance, marketing, management, analysis.

Donut Chart Finance Ppt Powerpoint Presentation Infographic Template Slide Download
This is a donut chart finance ppt powerpoint presentation infographic template slide download. This is a three stage process. The stages in this process are donut chart, finance, marketing, management, analysis.

Area Chart Finance Ppt PowerPoint Presentation Professional File Formats
This is a area chart finance ppt powerpoint presentation professional file formats . This is a three stage process. The stages in this process are area chart, finance, marketing, management, investment.

Area Chart Finance Ppt PowerPoint Presentation Gallery Pictures
This is a area chart finance ppt powerpoint presentation gallery pictures . This is a three stage process. The stages in this process are area chart, finance, marketing, management, investment.
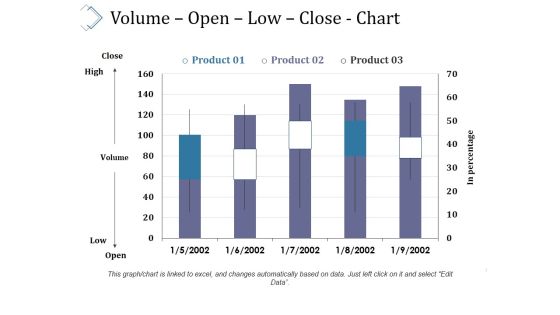
Volume Open Low Close Chart Ppt PowerPoint Presentation Summary Grid
This is a volume open low close chart ppt powerpoint presentation summary grid. This is a three stage process. The stages in this process are volume, open, low, close, chart.

Pie Chart Ppt PowerPoint Presentation Infographic Template Vector
This is a pie chart ppt powerpoint presentation infographic template vector. This is a five stage process. The stages in this process are pie chart, finance, analysis, investment, business.

Radar Chart Ppt PowerPoint Presentation Infographic Template Visuals
This is a radar chart ppt powerpoint presentation infographic template visuals. This is a two stage process. The stages in this process are radar chart, finance, business, marketing, analysis.
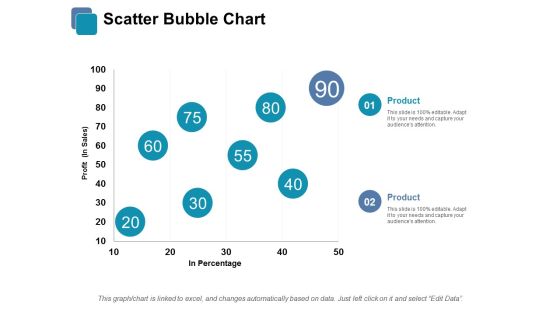
Scatter Bubble Chart Ppt PowerPoint Presentation Infographic Template Infographics
This is a scatter bubble chart ppt powerpoint presentation infographic template infographics. This is a two stage process. The stages in this process are scatter bubble chart, finance, business, marketing, analysis.

Clustered Bar Chart Finance Ppt PowerPoint Presentation Styles Design Inspiration
This is a clustered bar chart finance ppt powerpoint presentation styles design inspiration. This is a two stage process. The stages in this process are clustered bar chart, finance, business, analysis, investment.

Bubble Chart Finance Ppt PowerPoint Presentation File Graphics
This is a bubble chart finance ppt powerpoint presentation file graphics. This is a two stage process. The stages in this process are bubble chart, finance, marketing, analysis, investment.

Bar Chart Finance Marketing Ppt PowerPoint Presentation Portfolio Slide
This is a bar chart finance marketing ppt powerpoint presentation portfolio slide. This is a two stage process. The stages in this process are bar chart, finance, marketing, business, analysis.

Stacked Column Chart Ppt PowerPoint Presentation Professional Aids
This is a stacked column chart ppt powerpoint presentation professional aids. This is a three stage process. The stages in this process are bar chart, finance, marketing, business, analysis.

Combo Chart Finance Marketing Ppt PowerPoint Presentation Layouts Design Templates
This is a combo chart finance marketing ppt powerpoint presentation layouts design templates. This is a three stage process. The stages in this process are combo chart, finance, marketing, business, analysis.
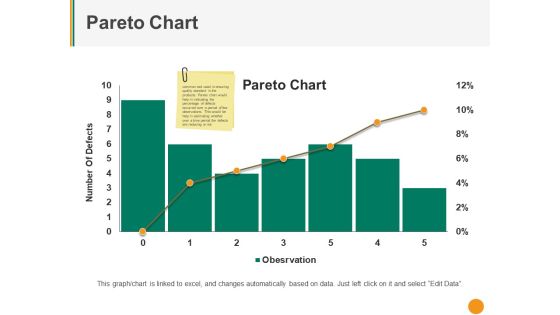
Pareto Chart Ppt PowerPoint Presentation Inspiration Master Slide
This is a pareto chart ppt powerpoint presentation inspiration master slide. This is a six stage process. The stages in this process are number of defects, pareto chart, finance, business, graph.
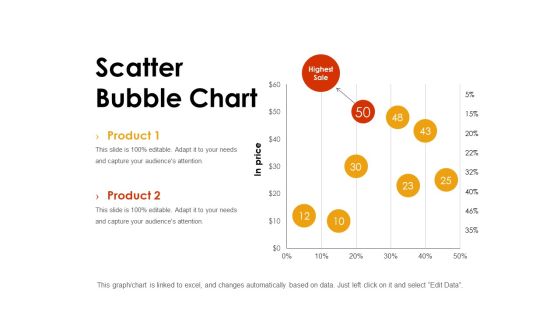
Scatter Bubble Chart Ppt PowerPoint Presentation Styles Background
This is a scatter bubble chart ppt powerpoint presentation styles background. This is a two stage process. The stages in this process are chart, in price, highest sale, finance, marketing.
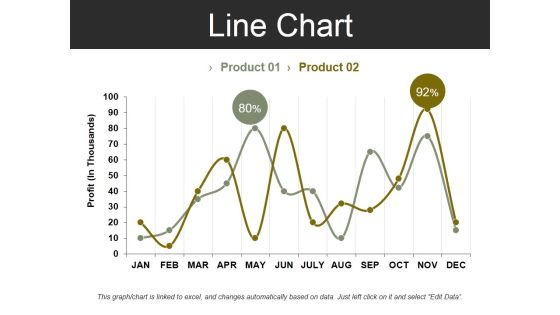
Line Chart Template 2 Ppt PowerPoint Presentation Summary Design Inspiration
This is a line chart template 2 ppt powerpoint presentation summary design inspiration. This is a two stage process. The stages in this process are profit, business, marketing, finance, chart.
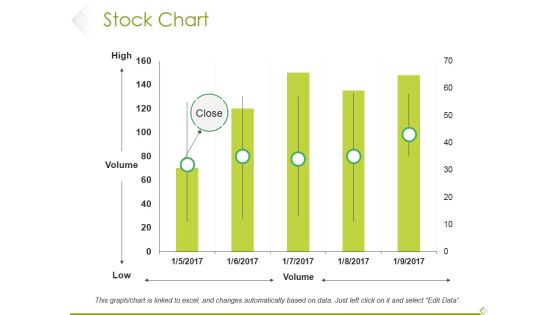
Stock Chart Ppt PowerPoint Presentation Slides Designs Download
This is a stock chart ppt powerpoint presentation slides designs download. This is a five stage process. The stages in this process are high, volume, low, close, stock chart.
Rader Chart Ppt PowerPoint Presentation Icon Graphic Tips
This is a rader chart ppt powerpoint presentation icon graphic tips. This is a two stage process. The stages in this process are rader chart, finance, analysis, business, marketing.
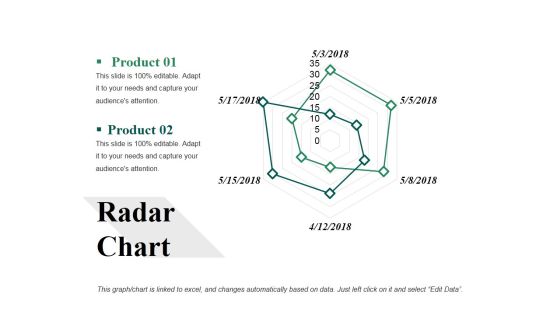
Radar Chart Ppt PowerPoint Presentation File Background Image
This is a radar chart ppt powerpoint presentation file background image. This is a two stage process. The stages in this process are radar chart, finance, analysis, marketing, business.

Stacked Chart Ppt PowerPoint Presentation Gallery Infographic Template
This is a stacked chart ppt powerpoint presentation gallery infographic template. This is a one stage process. The stages in this process are stacked chart, finance, analysis, marketing, business.
Rader Chart Ppt PowerPoint Presentation Icon Slide Portrait
This is a rader chart ppt powerpoint presentation icon slide portrait. This is a two stage process. The stages in this process are rader chart, business, analysis, finance, marketing.

Area Chart Ppt PowerPoint Presentation Portfolio Graphics Template
This is a area chart ppt powerpoint presentation portfolio graphics template. This is a two stage process. The stages in this process are area chart, finance, analysis, business, marketing.

Column Chart Ppt PowerPoint Presentation Pictures Visual Aids
This is a column chart ppt powerpoint presentation pictures visual aids. This is a two stage process. The stages in this process are column chart, business, finance, marketing, analysis, investment.
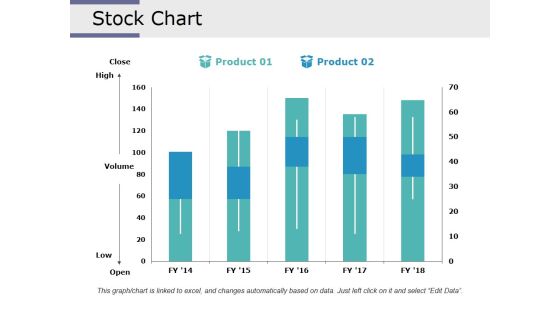
Stock Chart Ppt PowerPoint Presentation Infographic Template Design Inspiration
This is a stock chart ppt powerpoint presentation infographic template design inspiration. This is a two stage process. The stages in this process are stock chart, finance, analysis, business, marketing.

column chart ppt powerpoint presentation portfolio master slide
This is a column chart ppt powerpoint presentation portfolio master slide. This is a two stage process. The stages in this process are column chart, finance, analysis, marketing, business.

Column Chart Ppt PowerPoint Presentation Inspiration Layout Ideas
This is a column chart ppt powerpoint presentation inspiration layout ideas. This is a two stage process. The stages in this process are in years, dollars, chart, business, marketing, finance.

Line Chart Ppt PowerPoint Presentation File Designs Download
This is a line chart ppt powerpoint presentation file designs download. This is a two stage process. The stages in this process are business, marketing, profit, line chart, percentage.

Area Chart Ppt PowerPoint Presentation Visual Aids Gallery
This is a area chart ppt powerpoint presentation visual aids gallery. This is a two stage process. The stages in this process are area chart, finance, marketing, analysis, business.
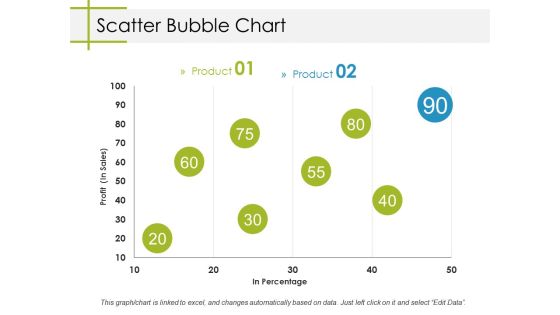
Scatter Bubble Chart Ppt PowerPoint Presentation Model Designs
This is a scatter bubble chart ppt powerpoint presentation model designs. This is a two stage process. The stages in this process are business, profit, in percentage, bubble chart, marketing.

Area Chart Ppt PowerPoint Presentation Infographics Graphics Pictures
This is a area chart ppt powerpoint presentation infographics graphics pictures. This is a two stage process. The stages in this process are business, sales in percentage, area chart, marketing, graph.
Stacked Line Chart Ppt PowerPoint Presentation Show Icon
This is a stacked line chart ppt powerpoint presentation show icon. This is a two stage process. The stages in this process are profit, chart, years, business, marketing, years.

Area Chart Ppt PowerPoint Presentation Inspiration Background Designs
This is a area chart ppt powerpoint presentation inspiration background designs. This is a two stage process. The stages in this process are business, sales in percentage, area chart, marketing, finance.

Area Chart Ppt PowerPoint Presentation Layouts Background Designs
This is a area chart ppt powerpoint presentation layouts background designs. This is a two stage process. The stages in this process are business, marketing, in percentage, area chart, finance.
Pie Chart Finance Ppt PowerPoint Presentation Slides Icon
This is a pie chart finance ppt powerpoint presentation slides icon. This is a three stage process. The stages in this process are pie chart, finance, analysis, investment, business.

Clustered Column Chart Ppt PowerPoint Presentation Model Deck
This is a clustered column chart ppt powerpoint presentation model deck. This is a three stage process. The stages in this process are clustered column chart, product, finance, profit, business.

Customer Analysis Percentage Chart Ppt PowerPoint Presentation Infographics Master Slide
This is a customer analysis percentage chart ppt powerpoint presentation infographics master slide. This is a four stage process. The stages in this process are comparison chart, comparison table, comparison matrix.

Column Chart Ppt PowerPoint Presentation Layouts File Formats
This is a column chart ppt powerpoint presentation layouts file formats. This is a three stage process. The stages in this process are column chart, product, in percentage, year, finance.

Bubble Chart Ppt PowerPoint Presentation Summary Graphics Tutorials
This is a bubble chart ppt powerpoint presentation summary graphics tutorials. This is a three stage process. The stages in this process are product, sales in percentage, bubble chart.

Column Chart Finance Ppt PowerPoint Presentation Model Examples
This is a column chart finance ppt powerpoint presentation model examples. This is a two stage process. The stages in this process are column chart, finance, marketing, analysis, investment.

Stacked Bar Chart Ppt PowerPoint Presentation Portfolio Templates
This is a stacked bar chart ppt powerpoint presentation portfolio templates. This is a three stage process. The stages in this process are stacked bar chart, product, year, business, finance.
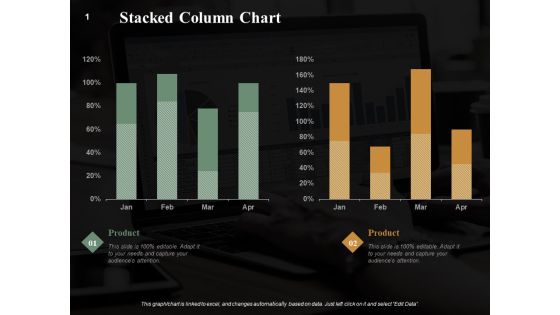
Stacked Column Chart Finance Ppt PowerPoint Presentation Summary Graphics Example
This is a stacked column chart finance ppt powerpoint presentation summary graphics example. This is a two stage process. The stages in this process are stacked column chart, marketing, analysis, business, investment.
Pie Chart Investment Ppt PowerPoint Presentation Gallery Icon
This is a pie chart investment ppt powerpoint presentation gallery icon. This is a three stage process. The stages in this process are pie chart, finance, marketing, analysis, investment.

Combo Chart Finance Ppt PowerPoint Presentation Ideas Microsoft
This is a combo chart finance ppt powerpoint presentation ideas microsoft. This is a three stage process. The stages in this process are combo chart, Finance, Analysis, Business, Investment.

Combo Chart Finance Ppt PowerPoint Presentation Icon Designs Download
This is a combo chart finance ppt powerpoint presentation icon designs download. This is a three stage process. The stages in this process are combo chart, finance, analysis, business, investment.

Area Chart Investment Ppt PowerPoint Presentation Styles Topics
This is a area chart investment ppt powerpoint presentation styles topics. This is a three stage process. The stages in this process are area chart, finance, marketing, analysis, investment.
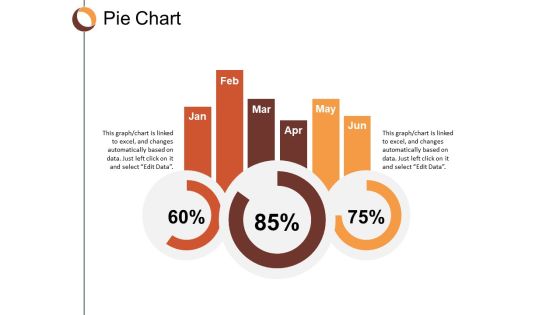
Pie Chart Finance Ppt Powerpoint Presentation Infographic Template Clipart
This is a pie chart finance ppt powerpoint presentation infographic template clipart. This is a three stage process. The stages in this process are pie chart, finance, marketing, business, analysis.

Area Chart Finance Ppt PowerPoint Presentation Infographics Slide
This is a area chart finance ppt powerpoint presentation infographics slide. This is a three stage process. The stages in this process are area chart, finance, marketing, analysis, investment.
 Home
Home