Financial Planning Process
Monthly Social Media Dashboard Ppt PowerPoint Presentation Icon Gallery
This is a monthly social media dashboard ppt powerpoint presentation icon gallery. This is a two stage process. The stages in this process are facebook, social traffic and conversion, referral traffic, conversions, key social metrics, pinterest, you tube.
Monthly Traffic Source Overview Ppt PowerPoint Presentation Icon Clipart Images
This is a monthly traffic source overview ppt powerpoint presentation icon clipart images. This is a three stage process. The stages in this process are sources, visits, keyword, visits, referring sites, search engines, direct traffic.
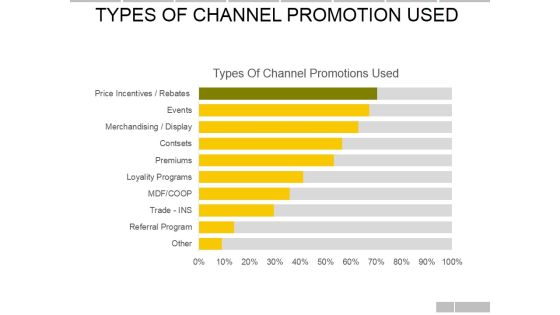
Types Of Channel Promotions Used Ppt PowerPoint Presentation File Background Image
This is a types of channel promotions used ppt powerpoint presentation file background image. This is a nine stage process. The stages in this process are price incentives, events, display, contest, premium.

Addressable Market In Sector Ppt PowerPoint Presentation Inspiration Structure
This is a addressable market in sector ppt powerpoint presentation inspiration structure. This is a two stage process. The stages in this process are expected global annual investment in power, xxs addressable market on annual basis.
Solvency Ratios Template Ppt PowerPoint Presentation Inspiration Icons
This is a solvency ratios template ppt powerpoint presentation inspiration icons. This is a two stage process. The stages in this process are debt equity ratio, total liabilities total equity, time interest earned ratio, ebit interest expense.
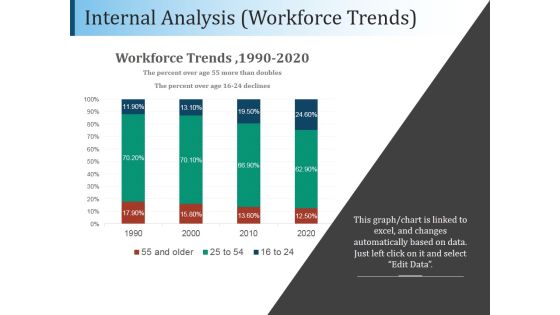
Internal Analysis Workforce Trends Ppt PowerPoint Presentation Example
This is a internal analysis workforce trends ppt powerpoint presentation example. This is a four stage process. The stages in this process are workforce trends, business, marketing, bar, finance.
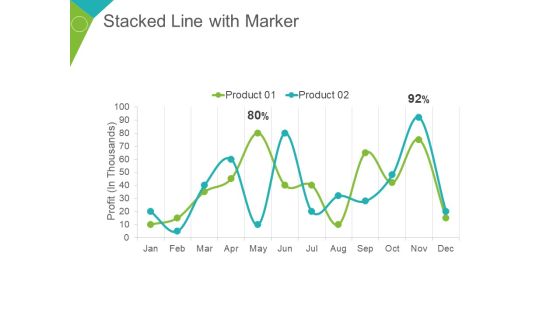
Stacked Line With Marker Ppt PowerPoint Presentation Summary Demonstration
This is a stacked line with marker ppt powerpoint presentation summary demonstration. This is a two stage process. The stages in this process are profit in thousands, product, percentage, finance, business.
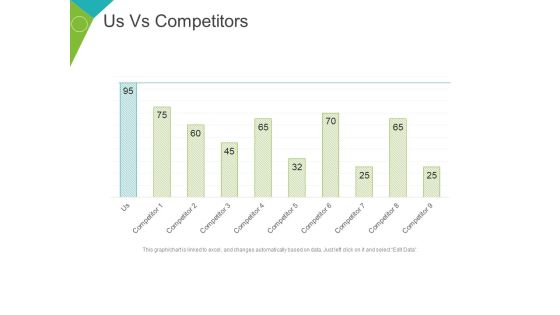
Us Vs Competitors Template 2 Ppt PowerPoint Presentation File Show
This is a us vs competitors template 2 ppt powerpoint presentation file show. This is a nine stage process. The stages in this process are competitor, graph, business, marketing, finance.

Gap Between Current And Required Staff Ppt PowerPoint Presentation Ideas Format Ideas
This is a gap between current and required staff ppt powerpoint presentation ideas format ideas. This is a five stage process. The stages in this process are number of staff, category, current, graph, finance.

Bar Graph Ppt PowerPoint Presentation Portfolio Example
This is a bar graph ppt powerpoint presentation portfolio example. This is a three stage process. The stages in this process are sales in percentage, year, business, product, business, graph.

Area Stacked Ppt PowerPoint Presentation Diagram Images
This is a area stacked ppt powerpoint presentation diagram images. This is a two stage process. The stages in this process are sales in percentage, product, business, marketing, finance.

Clustered Column Line Ppt PowerPoint Presentation Infographics Templates
This is a clustered column line ppt powerpoint presentation infographics templates. This is a three stage process. The stages in this process are in percentage, business, marketing, product, finance, graph.

Clustered Column Ppt PowerPoint Presentation Slides Ideas
This is a clustered column ppt powerpoint presentation slides ideas. This is a two stage process. The stages in this process are sales in percentage, business, marketing, finance, graph.
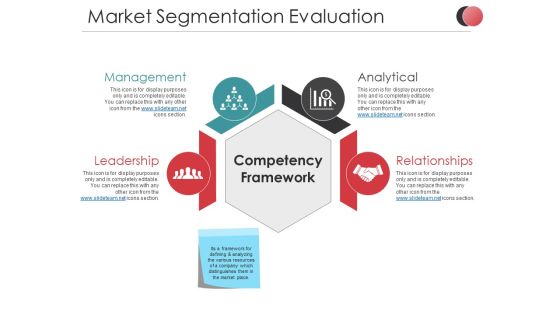
Market Segmentation Evaluation Ppt PowerPoint Presentation Summary Slideshow
This is a market segmentation evaluation ppt powerpoint presentation summary slideshow. This is a two stage process. The stages in this process are net profit, market sales, business, marketing, finance, icons.
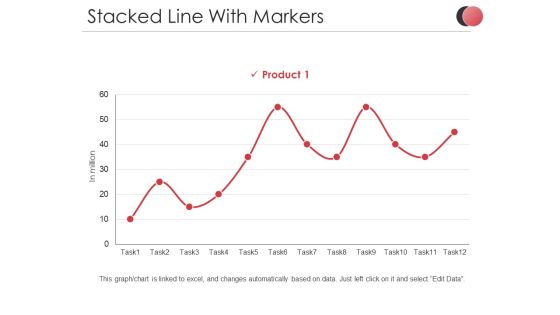
Stacked Line With Markers Ppt PowerPoint Presentation Slides Demonstration
This is a stacked line with markers ppt powerpoint presentation slides demonstration. This is a one stage process. The stages in this process are in million, product, percentage, business, marketing, finance.

Stacked Column Ppt PowerPoint Presentation Infographics Samples
This is a stacked column ppt powerpoint presentation infographics samples. This is a two stage process. The stages in this process are product, sales in percentage, business, marketing, graph.

Sales Forecasting Template 2 Ppt PowerPoint Presentation Infographic Template Examples
This is a sales forecasting template 2 ppt powerpoint presentation infographic template examples. This is a two stage process. The stages in this process are forecasting, business, marketing, finance, graph.

Bar Graph Template 2 Ppt PowerPoint Presentation Ideas Files
This is a bar graph template 2 ppt powerpoint presentation ideas files. This is a five stage process. The stages in this process are in percentage, business, marketing, finance, graph.
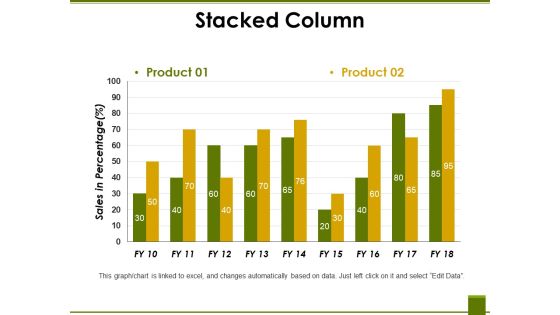
Stacked Column Ppt PowerPoint Presentation Professional Vector
This is a stacked column ppt powerpoint presentation professional vector. This is a two stage process. The stages in this process are product, sales in percentage, business, marketing, graph.

Stacked Line Ppt PowerPoint Presentation Infographic Template Graphics Template
This is a stacked line ppt powerpoint presentation infographic template graphics template. This is a three stage process. The stages in this process are product, in percentage, business, marketing, finance.
Open High Low Close Ppt PowerPoint Presentation Icon Model
This is a open high low close ppt powerpoint presentation icon model. This is a five stage process. The stages in this process are high, low, product, business, finance.

Clustered Bar Ppt PowerPoint Presentation Show Slide Portrait
This is a clustered bar ppt powerpoint presentation show slide portrait. This is a four stage process. The stages in this process are product, unit count, graph, business, marketing.

Clustered Column Ppt PowerPoint Presentation Professional Graphic Tips
This is a clustered column ppt powerpoint presentation professional graphic tips. This is a two stage process. The stages in this process are product, profit in percentage, graph, business, marketing.

Clustered Column Ppt PowerPoint Presentation Inspiration Shapes
This is a clustered column ppt powerpoint presentation inspiration shapes. This is a two stage process. The stages in this process are profit in percentage, business, marketing, graph, finance.

Stacked Area Clustered Column Ppt PowerPoint Presentation Ideas Show
This is a stacked area clustered column ppt powerpoint presentation ideas show. This is a three stage process. The stages in this process are in percentage, business, marketing, finance, graph.
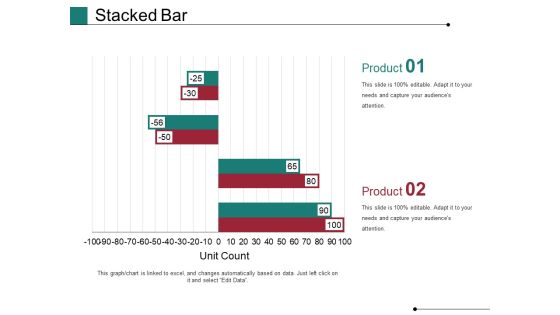
Stacked Bar Template 1 Ppt PowerPoint Presentation Show Slides
This is a stacked bar template 1 ppt powerpoint presentation show slides. This is a two stage process. The stages in this process are Unit Count, Business, Marketing, Graph, Finance.
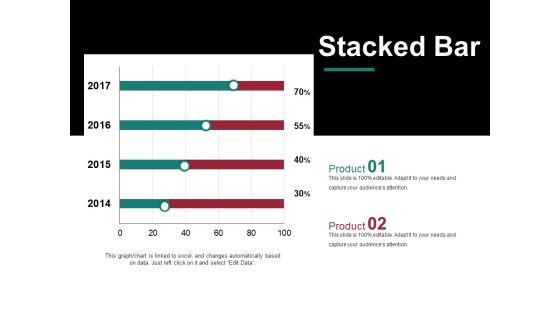
Stacked Bar Template 2 Ppt PowerPoint Presentation Model Graphic Images
This is a stacked bar template 2 ppt powerpoint presentation model graphic images. This is a two stage process. The stages in this process are business, years, marketing, percentage, finance.

Stacked Bar Ppt PowerPoint Presentation Infographic Template Infographic Template
This is a stacked bar ppt powerpoint presentation infographic template infographic template. This is a four stage process. The stages in this process are business, marketing, finance, slide bar, graph.
Stacked Area Clustered Column Ppt PowerPoint Presentation Icon Aids
This is a stacked area clustered column ppt powerpoint presentation icon aids. This is a three stage process. The stages in this process are business, marketing, finance, bar, graph.
Stacked Line Ppt PowerPoint Presentation Icon Format Ideas
This is a stacked line ppt powerpoint presentation icon format ideas. This is a three stage process. The stages in this process are product, in percentage, stacked line, finance.
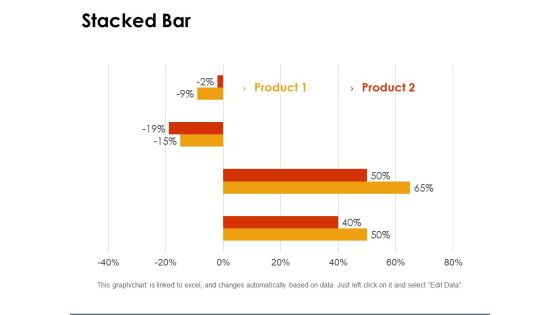
Stacked Bar Template 1 Ppt PowerPoint Presentation Gallery Clipart
This is a stacked bar template 1 ppt powerpoint presentation gallery clipart. This is a two stage process. The stages in this process are percentage, graph, business, marketing, finance.
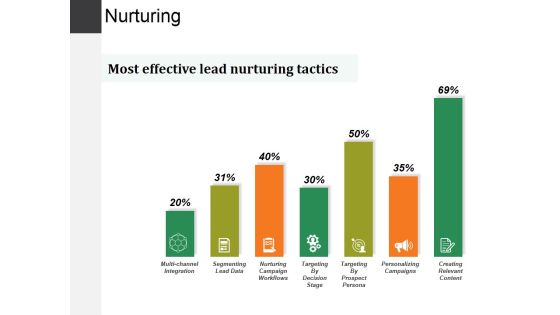
Nurturing Ppt PowerPoint Presentation Summary Brochure
This is a nurturing ppt powerpoint presentation summary brochure. This is a seven stage process. The stages in this process are segmenting lead data, nurturing campaign workflows, targeting by prospect persona, personalizing campaigns, creating relevant content.

Stacked Line With Markers Ppt PowerPoint Presentation Infographic Template Graphics Example
This is a stacked line with markers ppt powerpoint presentation infographic template graphics example. This is a one stage process. The stages in this process are in million, task, product, finance, line graph.
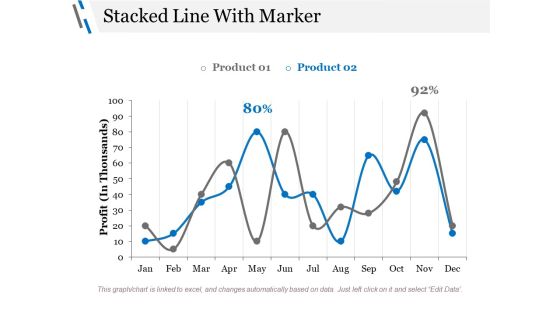
Stacked Line With Marker Ppt PowerPoint Presentation Styles Graphics Design
This is a stacked line with marker ppt powerpoint presentation styles graphics design. This is a three stage process. The stages in this process are profit, business, marketing, finance, percentage.

Stacked Bar Template Ppt PowerPoint Presentation Summary Visual Aids
This is a stacked bar template ppt powerpoint presentation summary visual aids. This is a three stage process. The stages in this process are unit count, business, marketing, finance, graph.

Results Ppt PowerPoint Presentation Summary Inspiration
This is a results ppt powerpoint presentation summary inspiration. This is a seven stage process. The stages in this process are effective leadership at all levels, strong customer focus, commitment to learning and change.

Define Role Of Leadership In Cm Ppt PowerPoint Presentation Model Example Introduction
This is a define role of leadership in cm ppt powerpoint presentation model example introduction. This is a five stage process. The stages in this process are vision, energizing people, communication, charisma, competence.

clustered column line ppt powerpoint presentation ideas example
This is a clustered column line ppt powerpoint presentation ideas example. This is a three stage process. The stages in this process are sales in percentage, business, marketing, finance, graph.
Sales Performance Of Competitors Ppt PowerPoint Presentation Show Icon
This is a sales performance of competitors ppt powerpoint presentation show icon. This is a three stage process. The stages in this process are own business, competitor, year, business, marketing.
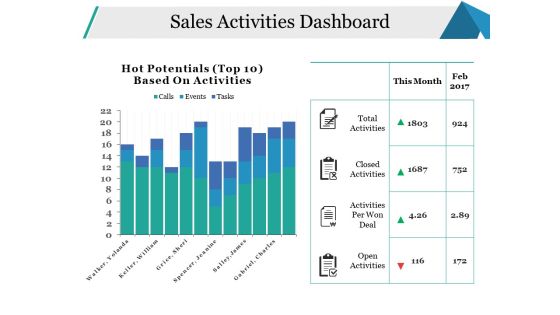
Sales Activities Dashboard Ppt PowerPoint Presentation Pictures Model
This is a sales activities dashboard ppt powerpoint presentation pictures model. This is a two stage process. The stages in this process are open activities, activities per won deal, closed activities, total activities, business.

Sales Performance Of Competitors Ppt PowerPoint Presentation Portfolio Sample
This is a sales performance of competitors ppt powerpoint presentation portfolio sample. This is a three stage process. The stages in this process are business, marketing, finance, graph, years.
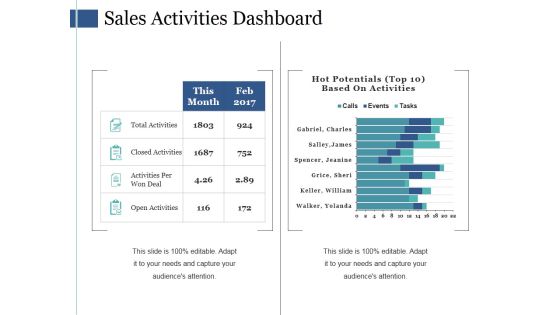
Sales Activities Dashboard Ppt PowerPoint Presentation Ideas Themes
This is a sales activities dashboard ppt powerpoint presentation ideas themes. This is a two stage process. The stages in this process are total activities, closed activities, activities per won deal, open activities.

Bar Graph Ppt PowerPoint Presentation File Slides
This is a bar graph ppt powerpoint presentation file slides. This is a three stage process. The stages in this process are product, sales in percentage, bar graph, growth, success.

Inventory Ratios Template 1 Ppt PowerPoint Presentation Gallery Master Slide
This is a inventory ratios template 1 ppt powerpoint presentation gallery master slide. This is a two stage process. The stages in this process are finance, marketing, analysis, business, investment, inventory ratios.
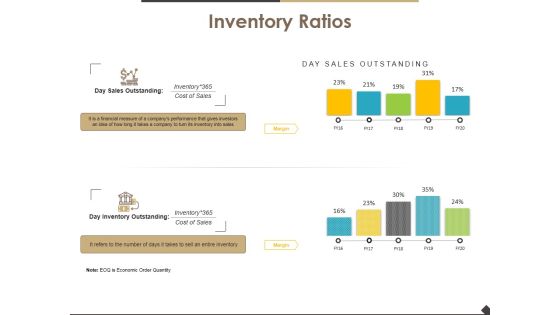
Inventory Ratios Template 2 Ppt PowerPoint Presentation Slide
This is a inventory ratios template 2 ppt powerpoint presentation slide. This is a two stage process. The stages in this process are finance, marketing, analysis, business, investment, inventory ratios.

Clustered Bar Ppt PowerPoint Presentation Show Background Designs
This is a clustered bar ppt powerpoint presentation show background designs. This is a three stage process. The stages in this process are clustered bar, finance, analysis, business, marketing.

Activity Ratios Template 1 Ppt PowerPoint Presentation Show Graphics
This is a activity ratios template 1 ppt powerpoint presentation show graphics. This is a two stage process. The stages in this process are inventory turnover, receivables turnover, inventory ratio, receivable ratio.

Activity Ratios Template 2 Ppt PowerPoint Presentation Pictures Template
This is a activity ratios template 2 ppt powerpoint presentation pictures template. This is a two stage process. The stages in this process are total asset turnover, fixed asset turnover.

Cash Flow Statement Kpis Tabular Form Ppt PowerPoint Presentation Inspiration Master Slide
This is a cash flow statement kpis tabular form ppt powerpoint presentation inspiration master slide. This is a four stage process. The stages in this process are operations, financing activities, investing activities, net increase in cash.

Activity Ratios Template 1 Ppt PowerPoint Presentation Icon File Formats
This is a activity ratios template 1 ppt powerpoint presentation icon file formats. This is a two stage process. The stages in this process are finance, analysis, compere, business, marketing.

Activity Ratios Template 2 Ppt PowerPoint Presentation Model Design Inspiration
This is a activity ratios template 2 ppt powerpoint presentation model design inspiration. This is a two stage process. The stages in this process are finance, analysis, compere, business, marketing.

Capex Summary Template 1 Ppt PowerPoint Presentation Layouts Examples
This is a capex summary template 1 ppt powerpoint presentation layouts examples. This is a four stage process. The stages in this process are business, finance, marketing, analysis, investment.

Capex Summary Template 2 Ppt PowerPoint Presentation Slides Template
This is a capex summary template 2 ppt powerpoint presentation slides template. This is a four stage process. The stages in this process are business, finance, marketing, analysis, investment.
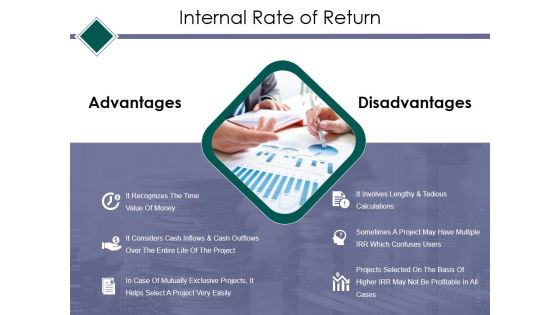
Internal Rate Of Return Template 2 Ppt PowerPoint Presentation Portfolio Grid
This is a internal rate of return template 2 ppt powerpoint presentation portfolio grid. This is a two stage process. The stages in this process are advantages, disadvantages, finance, analysis, business.

Competitors Average Price Product Ppt PowerPoint Presentation Inspiration Templates
This is a competitors average price product ppt powerpoint presentation inspiration templates. This is a five stage process. The stages in this process are business, finance, analysis, growth, investment, bar graph.

Competitors Average Price Product Ppt PowerPoint Presentation Ideas Layouts
This is a competitors average price product ppt powerpoint presentation ideas layouts. This is a five stage process. The stages in this process are business, bar graph, finance, marketing, analysis.

Competitor Analysis Ppt PowerPoint Presentation Samples
This is a competitor analysis ppt powerpoint presentation samples. This is a four stage process. The stages in this process are sales development of industry, performance indicators, sales development, sales.

Balance Sheet Kpis Ppt PowerPoint Presentation Visual Aids Inspiration
This is a balance sheet kpis ppt powerpoint presentation visual aids inspiration. This is a four stage process. The stages in this process are current assets, current liabilities, total liabilities, total assets, business.

Cash Flow Statement Kpis Ppt PowerPoint Presentation Ideas Graphics
This is a cash flow statement kpis ppt powerpoint presentation ideas graphics. This is a four stage process. The stages in this process are operation, financing activities, net increase in cash, investing activities, business.

Competitor Analysis Template 4 Ppt PowerPoint Presentation Gallery Design Templates
This is a competitor analysis template 4 ppt powerpoint presentation gallery design templates. This is a four stage process. The stages in this process are business, marketing, analysis, graph, net profit margin.

Balance Sheet Kpis Template 2 Ppt PowerPoint Presentation Ideas Show
This is a balance sheet kpis template 2 ppt powerpoint presentation ideas show. This is a four stage process. The stages in this process are current assets, total assets, total liabilities, current liabilities.
Balance Sheet Kpis Tabular Form Ppt PowerPoint Presentation Show Icons
This is a balance sheet kpis tabular form ppt powerpoint presentation show icons. This is a four stage process. The stages in this process are current assets, total assets, total liabilities, current liabilities.

Clustered Column Ppt PowerPoint Presentation Visual Aids Show
This is a clustered column ppt powerpoint presentation visual aids show. This is a two stage process. The stages in this process are product, profit, business, bar graph, finance.

Clustered Column Line Ppt PowerPoint Presentation Infographics Background Images
This is a clustered column line ppt powerpoint presentation infographics background images. This is a three stage process. The stages in this process are clustered column line, finance, analysis, marketing, business.

Addressable Market In Sector Ppt PowerPoint Presentation Ideas
This is a addressable market in sector ppt powerpoint presentation ideas. This is a two stage process. The stages in this process are business, addressable market in sector addressable market, south africa, europe.

Stacked Area Clustered Column Ppt PowerPoint Presentation Slides Information
This is a stacked area clustered column ppt powerpoint presentation slides information. This is a three stage process. The stages in this process are stacked area, clustered column, growth, finance, marketing, business.
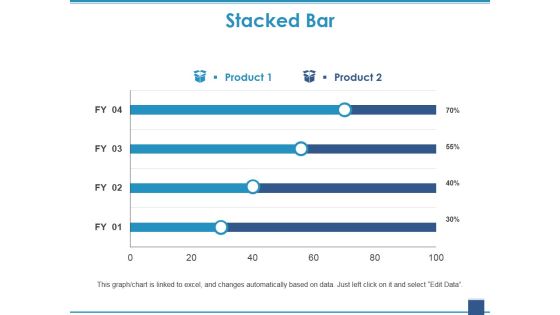
Stacked Bar Template 1 Ppt PowerPoint Presentation Gallery Deck
This is a stacked bar template 1 ppt powerpoint presentation gallery deck. This is a two stage process. The stages in this process are stacked bar, growth, finance, marketing, business.

Stacked Bar Template 2 Ppt PowerPoint Presentation Show Clipart
This is a stacked bar template 2 ppt powerpoint presentation show clipart. This is a two stage process. The stages in this process are stacked bar, growth, finance, marketing, business, investment.
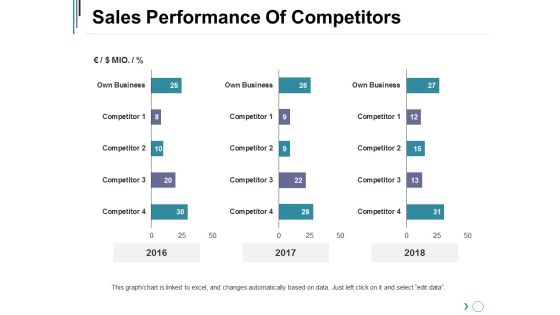
Sales Performance Of Competitors Ppt PowerPoint Presentation Inspiration Slideshow
This is a sales performance of competitors ppt powerpoint presentation inspiration slideshow. This is a three stage process. The stages in this process are business, marketing, graph, finance, years.

Sales Performance Of Competitors Ppt PowerPoint Presentation Portfolio Templates
This is a sales performance of competitors ppt powerpoint presentation portfolio templates. This is a three stage process. The stages in this process are business, marketing, percentage, graph, finance.
Shareholding Pattern Ppt PowerPoint Presentation Icon Clipart Images
This is a shareholding pattern ppt powerpoint presentation icon clipart images. This is a five stage process. The stages in this process are business, before funding, shareholder, after funding, shareholding pattern.

Clustered Column Line Ppt PowerPoint Presentation Pictures Objects
This is a clustered column line ppt powerpoint presentation pictures objects. This is a three stage process. The stages in this process are in percentage, business, marketing, graph, finance.

Balance Sheet Kpis Ppt PowerPoint Presentation Layouts Design Ideas
This is a balance sheet kpis ppt powerpoint presentation layouts design ideas. This is a four stage process. The stages in this process are current assets, current liabilities, total assets, total liabilities.

Cash Flow Statement Kpis Template Ppt PowerPoint Presentation Ideas Visual Aids
This is a cash flow statement kpis template ppt powerpoint presentation ideas visual aids. This is a four stage process. The stages in this process are operations, financing activities, investing activities, net increase in cash.

Marketing Reach By Channels Ppt PowerPoint Presentation Pictures
This is a marketing reach by channels ppt powerpoint presentation pictures. This is a two stage process. The stages in this process are business, icons, performing, scalable, last year s acquisition sources.

Clustered Bar Ppt PowerPoint Presentation Portfolio Graphic Images
This is a clustered bar ppt powerpoint presentation portfolio graphic images. This is a three stage process. The stages in this process are business, unit count, finance, marketing, graph.
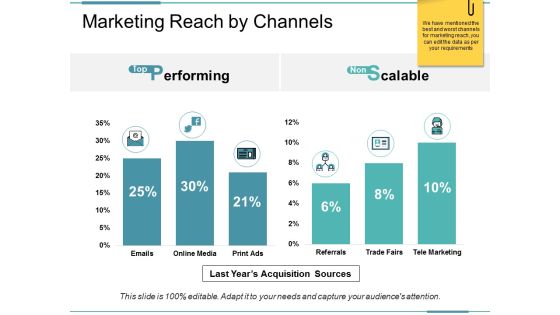
Marketing Reach By Channels Ppt PowerPoint Presentation Pictures Template
This is a marketing reach by channels ppt powerpoint presentation pictures template. This is a two stage process. The stages in this process are performing, scalable, last years acquisition sources.

Competitor Positioning Ppt PowerPoint Presentation Gallery Portrait
This is a competitor positioning ppt powerpoint presentation gallery portrait. This is a two stage process. The stages in this process are company growth, market growth, business, marketing, percentage.

Cycle Time By Month Ppt PowerPoint Presentation Slides Ideas
This is a cycle time by month ppt powerpoint presentation slides ideas. This is a two stage process. The stages in this process are business, marketing, cycle time by month, finance, graph.

Liquidity Ratios Template 2 Ppt PowerPoint Presentation Ideas Microsoft
This is a liquidity ratios template 2 ppt powerpoint presentation ideas microsoft. This is a two stage process. The stages in this process are business, marketing, graph, year, current ratio, quick ratio.

Profitability Ratios Template 1 Ppt PowerPoint Presentation Ideas Master Slide
This is a profitability ratios template 1 ppt powerpoint presentation ideas master slide. This is a two stage process. The stages in this process are business, net profit ratio, gross profit ratio, marketing, graph.

Profitability Ratios Template 2 Ppt PowerPoint Presentation Show Portfolio
This is a profitability ratios template 2 ppt powerpoint presentation show portfolio. This is a two stage process. The stages in this process are business, marketing, graph, net profit ratio, gross profit ratio, year.
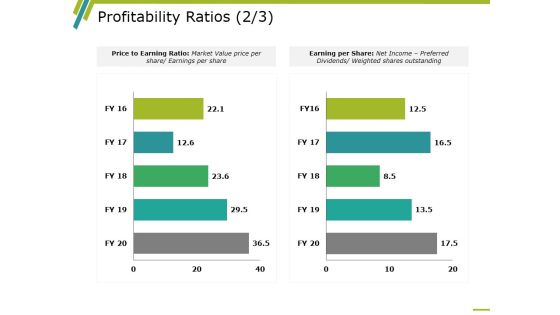
Profitability Ratios Template 3 Ppt PowerPoint Presentation Inspiration Backgrounds
This is a profitability ratios template 3 ppt powerpoint presentation inspiration backgrounds. This is a two stage process. The stages in this process are business, marketing, graph, price to earning ratio, earning per share.
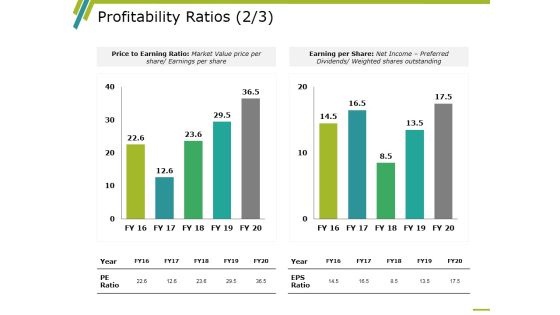
Profitability Ratios Template 4 Ppt PowerPoint Presentation Infographics Rules
This is a profitability ratios template 4 ppt powerpoint presentation infographics rules. This is a two stage process. The stages in this process are business, marketing, graph, price to earning ratio, earning per share.

Profitability Ratios Template 5 Ppt PowerPoint Presentation Infographic Template Clipart Images
This is a profitability ratios template 5 ppt powerpoint presentation infographic template clipart images. This is a two stage process. The stages in this process are business, marketing, graph, roce, roa.
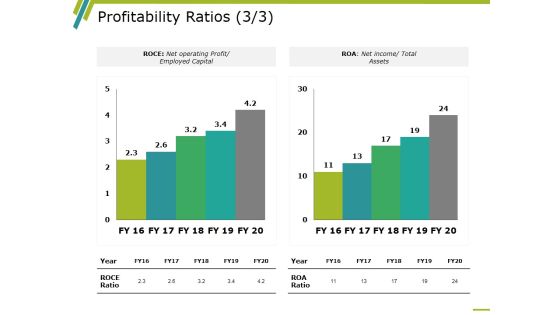
Profitability Ratios Template 6 Ppt PowerPoint Presentation Design Ideas
This is a profitability ratios template 6 ppt powerpoint presentation design ideas. This is a two stage process. The stages in this process are business, marketing, graph, roce, roa.
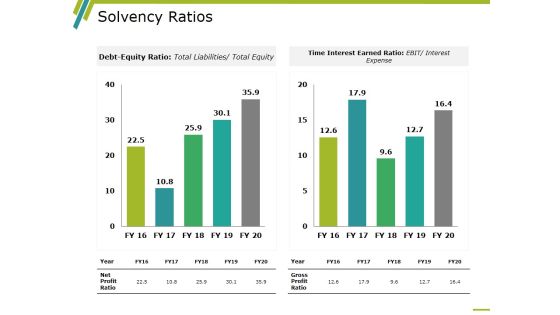
Solvency Ratios Template 1 Ppt PowerPoint Presentation Layouts Graphics Design
This is a solvency ratios template 1 ppt powerpoint presentation layouts graphics design. This is a two stage process. The stages in this process are time interest earned ratio, debt equity ratio, gross profit ratio, net profit ratio, year.

Solvency Ratios Template 2 Ppt PowerPoint Presentation Layouts Layouts
This is a solvency ratios template 2 ppt powerpoint presentation layouts layouts. This is a two stage process. The stages in this process are time interest earned ratio, debt equity ratio, gross profit ratio, net profit ratio, year.
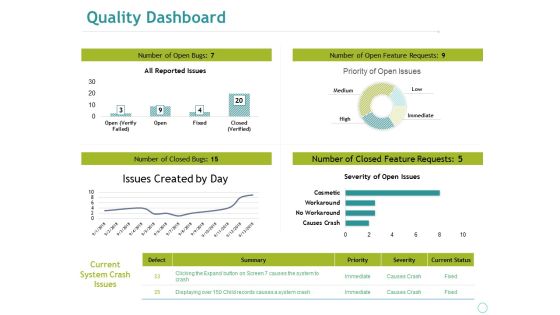
Quality Dashboard Ppt PowerPoint Presentation File Guide
This is a quality dashboard ppt powerpoint presentation file guide. This is a four stage process. The stages in this process are business, marketing, all reported issues, issues created by day, severity of open issues.

Activity Ratios Ppt PowerPoint Presentation Gallery Slide Portrait
This is a activity ratios ppt powerpoint presentation gallery slide portrait. This is a two stage process. The stages in this process are business, inventory turnover, receivables turnover, marketing, finance.
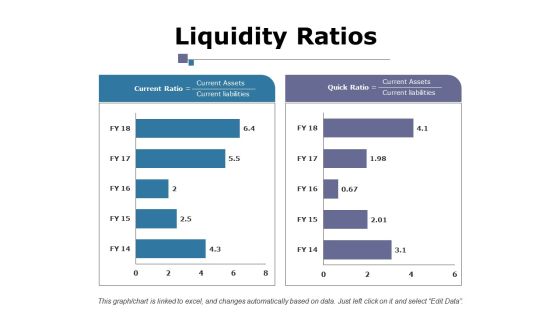
Liquidity Ratios Ppt PowerPoint Presentation Layouts Example File
This is a liquidity ratios ppt powerpoint presentation layouts example file. This is a two stage process. The stages in this process are business, current ratio, quick ratio, marketing, finance, graph.
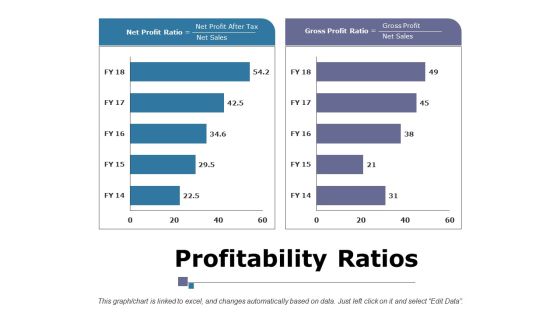
Profitability Ratios Ppt PowerPoint Presentation Infographic Template Portrait
This is a profitability ratios ppt powerpoint presentation infographic template portrait. This is a two stage process. The stages in this process are business, marketing, finance, net profit ratio, gross profit ratio.

Balance Sheet Kpis Template 1 Ppt PowerPoint Presentation Pictures Grid
This is a balance sheet kpis template 1 ppt powerpoint presentation pictures grid. This is a four stage process. The stages in this process are current assets, current liabilities, total assets, total liabilities.

Cash Flow Statement - Kpis Ppt PowerPoint Presentation Layouts Graphics Template
This is a cash flow statement - kpis ppt powerpoint presentation layouts graphics template. This is a four stage process. The stages in this process are operations, financing activities, investing activities, net increase in cash.

Activity Ratios Ppt PowerPoint Presentation Summary Mockup
This is a activity ratios ppt powerpoint presentation summary mockup. This is a two stage process. The stages in this process are business, inventory turnover, receivables turnover, marketing, finance.

Balance Sheet Kpis Ppt PowerPoint Presentation Summary Designs Download
This is a balance sheet kpis ppt powerpoint presentation summary designs download. This is a four stage process. The stages in this process are current assets, current liabilities, total liabilities, operating profit, business.

Cash Flow Statement Kpis Ppt PowerPoint Presentation Styles Themes
This is a cash flow statement kpis ppt powerpoint presentation styles themes. This is a four stage process. The stages in this process are business, operations, operating profit, total liabilities, current liabilities.

Liquidity Ratios Ppt PowerPoint Presentation Layouts Gridlines
This is a liquidity ratios ppt powerpoint presentation layouts gridlines. This is a two stage process. The stages in this process are business, marketing, current ratio, quick ratio, finance.
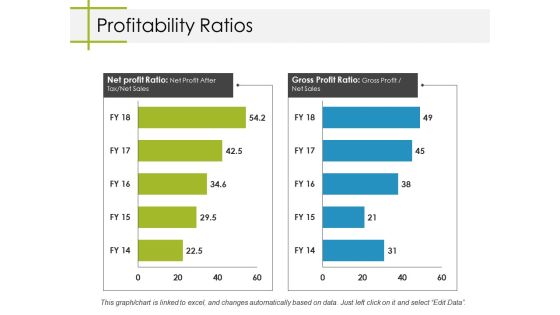
Profitability Ratios Ppt PowerPoint Presentation Inspiration Information
This is a profitability ratios ppt powerpoint presentation inspiration information. This is a two stage process. The stages in this process are business, net profit ratio, gross profit ratio, marketing, graph.
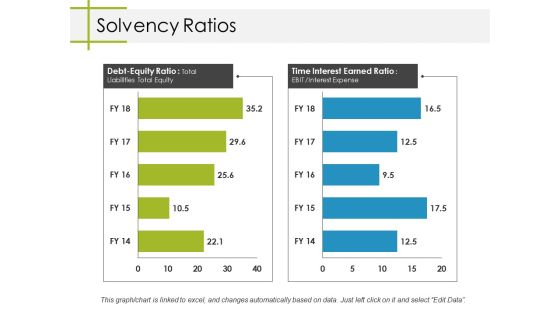
Solvency Ratios Ppt PowerPoint Presentation Professional Rules
This is a solvency ratios ppt powerpoint presentation professional rules. This is a two stage process. The stages in this process are business, marketing, debt equity ratio, time interest earned ratio, graph.

Activity Ratios Ppt PowerPoint Presentation Styles Infographic Template
This is a activity ratios ppt powerpoint presentation styles infographic template. This is a two stage process. The stages in this process are inventory turnover, receivables turnover, business, marketing, finance.
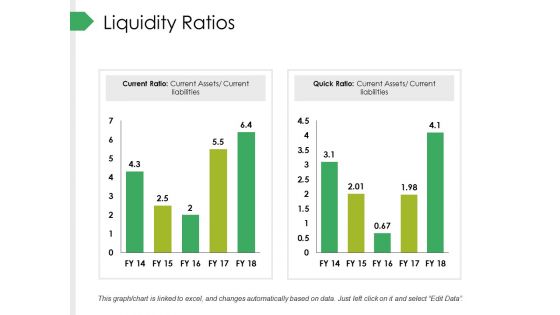
Liquidity Ratios Ppt PowerPoint Presentation Infographic Template Ideas
This is a liquidity ratios ppt powerpoint presentation infographic template ideas. This is a two stage process. The stages in this process are business, marketing, current ratio, quick ratio, finance.

Stacked Line With Markers Ppt PowerPoint Presentation Pictures Design Templates
This is a stacked line with markers ppt powerpoint presentation pictures design templates. This is a one stage process. The stages in this process are business, marketing, finance, in million, graph.

Balance Sheet Kpis Template 1 Ppt PowerPoint Presentation Show Inspiration
This is a balance sheet kpis template 1 ppt powerpoint presentation show inspiration. This is a four stage process. The stages in this process are business, marketing, graph, current liabilities, total liabilities.

Balance Sheet Kpis Template 2 Ppt PowerPoint Presentation Gallery Example
This is a balance sheet kpis template 2 ppt powerpoint presentation gallery example. This is a four stage process. The stages in this process are business, marketing, graph, current liabilities, total liabilities.

Balance Sheet Graphical Representation Ppt PowerPoint Presentation Gallery Design Templates
This is a balance sheet graphical representation ppt powerpoint presentation gallery design templates. This is a four stage process. The stages in this process are current assets, current liabilities, total assets, total liabilities.

Balance Sheet Kpis Ppt PowerPoint Presentation Slides Download
This is a balance sheet kpis ppt powerpoint presentation slides download. This is a four stage process. The stages in this process are current assets, total assets, current liabilities, total liabilities, business.

Bar Graph Ppt PowerPoint Presentation Summary Format
This is a bar graph ppt powerpoint presentation summary format. This is a three stage process. The stages in this process are bar graph, business, marketing, years, percentage, finance.

Balance Sheet Graphical Representation Ppt PowerPoint Presentation Inspiration Example
This is a balance sheet graphical representation ppt powerpoint presentation inspiration example. This is a four stage process. The stages in this process are business, current assets, current liabilities, total liabilities, total assets.

Cash Flow Statement Graphical Representation Ppt PowerPoint Presentation Professional Graphics Tutorials
This is a cash flow statement graphical representation ppt powerpoint presentation professional graphics tutorials. This is a four stage process. The stages in this process are business, operations, financing activities, net increase in cash, investing activities.

Bar Graph Ppt PowerPoint Presentation Layouts Influencers
This is a bar graph ppt powerpoint presentation layouts influencers. This is a two stage process. The stages in this process are business, marketing, in bar graph, sales in percentage, finance.

Balance Sheet Graphical Representation Ppt PowerPoint Presentation Infographics Layouts
This is a balance sheet graphical representation ppt powerpoint presentation infographics layouts. This is a four stage process. The stages in this process are business, current assets, total assets, total liabilities, current liabilities.

Cash Flow Statement Graphical Representation Ppt PowerPoint Presentation Professional Show
This is a cash flow statement graphical representation ppt powerpoint presentation professional show. This is a four stage process. The stages in this process are business, operations, investing activities, net increase in cash, financing activities.

Sales Activities Dashboard Ppt PowerPoint Presentation Show Skills
This is a sales activities dashboard ppt powerpoint presentation show skills. This is a four stage process. The stages in this process are total activities, closed activities, activities per won deal, open activities, this month.

Clustered Column Line Ppt PowerPoint Presentation Model Graphics Tutorials
This is a clustered column line ppt powerpoint presentation model graphics tutorials. This is a three stage process. The stages in this process are business, marketing, in percentage, finance, graph.
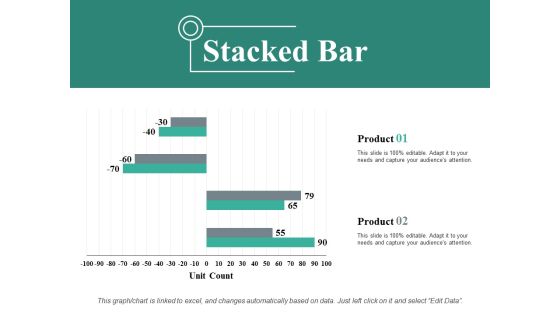
Stacked Bar Ppt PowerPoint Presentation Show Background Designs
This is a stacked bar ppt powerpoint presentation show background designs. This is a two stage process. The stages in this process are stacked bar, business, marketing, finance, unit count.

Use Of Funds Ppt PowerPoint Presentation Layouts Inspiration
This is a use of funds ppt powerpoint presentation layouts inspiration. This is a three stage process. The stages in this process are water purchases and treatment, cip, debt service, internet, technology.
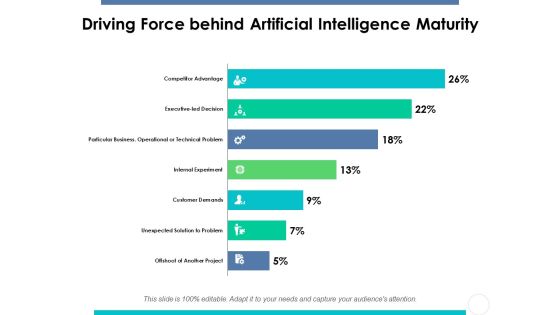
Driving Force Behind Artificial Intelligence Maturity Ppt PowerPoint Presentation Gallery Slides
This is a driving force behind artificial intelligence maturity ppt powerpoint presentation gallery slides. This is a seven stage process. The stages in this process are driving force, artificial, intelligence, maturity, finance.
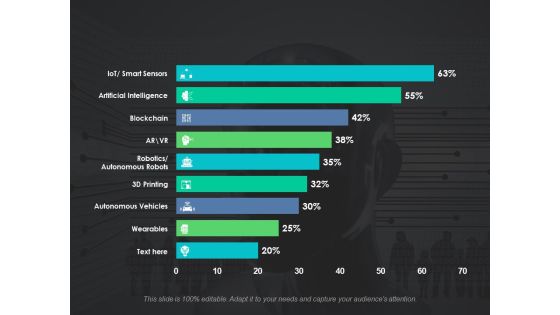
Survey On Adoption Of Emerging Technologies Ppt PowerPoint Presentation Model Format Ideas
This is a survey on adoption of emerging technologies ppt powerpoint presentation model format ideas. This is a nine stages process. The stages in this process are artificial intelligence, blockchain, autonomous robots, autonomous vehicles, wearable, finance.
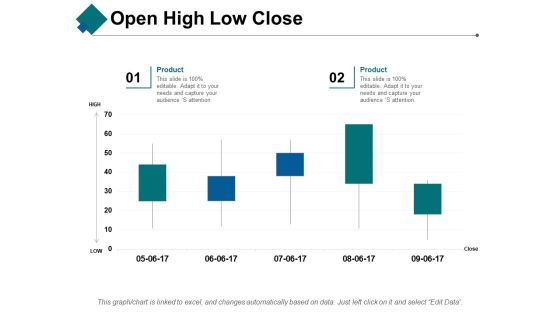
Open High Low Close Ppt PowerPoint Presentation Show Aids
This is a open high low close ppt powerpoint presentation show aids. This is a two stage process. The stages in this process are open, high, low, close, product.
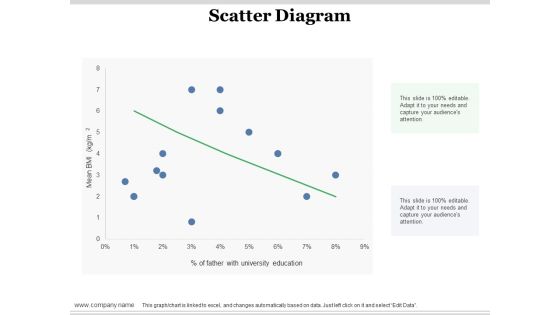
Scatter Diagram Ppt PowerPoint Presentation Infographic Template Design Ideas
This is a scatter diagram ppt powerpoint presentation infographic template design ideas. This is a one stage process. The stages in this process are scatter diagram, finance, in percentage, business, bar graph.

Volume Open High Low Close Ppt PowerPoint Presentation Slides Maker
This is a volume open high low close ppt powerpoint presentation slides maker. This is a two stage process. The stages in this process are volume, open, high, low, close, product.

Open High Low Close Ppt PowerPoint Presentation Model Good
This is a open high low close ppt powerpoint presentation model good. This is a two stage process. The stages in this process are open, high, low, close, product.
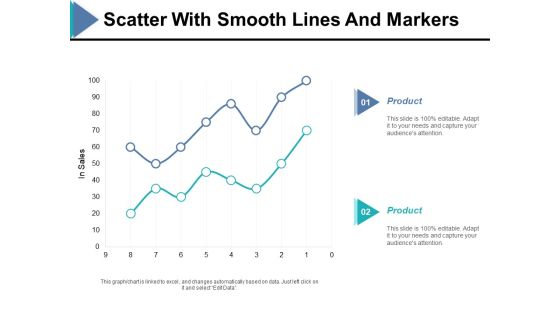
Scatter With Smooth Lines And Markers Ppt PowerPoint Presentation Ideas Example
This is a scatter with smooth lines and markers ppt powerpoint presentation ideas example. This is a two stage process. The stages in this process are in sales, finance, bar graph, product, business.

Clustered Bar Finance Ppt PowerPoint Presentation Ideas Layout
This is a clustered bar finance ppt powerpoint presentation ideas layout. This is a three stage process. The stages in this process are clustered bar, finance, business, investment, marketing.

Clustered Bar Finance Ppt PowerPoint Presentation Infographics Graphics Template
This is a clustered bar finance ppt powerpoint presentation infographics graphics template. This is a three stage process. The stages in this process are clustered bar, finance, business, investment, marketing.

Bar Graph Ppt PowerPoint Presentation Styles Skills
This is a bar graph ppt powerpoint presentation styles skills. This is a two stage process. The stages in this process are bar graph, product, in year, in percentage, business.

Clustered Column Finance Ppt PowerPoint Presentation Portfolio Guide
This is a clustered column finance ppt powerpoint presentation portfolio guide. This is a two stage process. The stages in this process are clustered column, finance, marketing, analysis, investment.

Bar Graph 7 QC Tools Ppt PowerPoint Presentation Styles Structure
This is a bar graph 7 qc tools ppt powerpoint presentation styles structure. This is a three stage process. The stages in this process are bar graph, finance, marketing, analysis, investment.

Clustered Bar Capability Maturity Matrix Ppt PowerPoint Presentation Summary Show
This is a clustered bar capability maturity matrix ppt powerpoint presentation summary show. This is a three stage process. The stages in this process are clustered bar, product, year, business, marketing.

Clustered Column Capability Maturity Matrix Ppt PowerPoint Presentation Pictures Slideshow
This is a clustered column capability maturity matrix ppt powerpoint presentation pictures slideshow. This is a three stage process. The stages in this process are clustered column, product, year, business, marketing.

Stacked Column Capability Maturity Matrix Ppt PowerPoint Presentation Model Shapes
This is a stacked column capability maturity matrix ppt powerpoint presentation model shapes. This is a three stage process. The stages in this process are stacked column, product, year, finance, business.
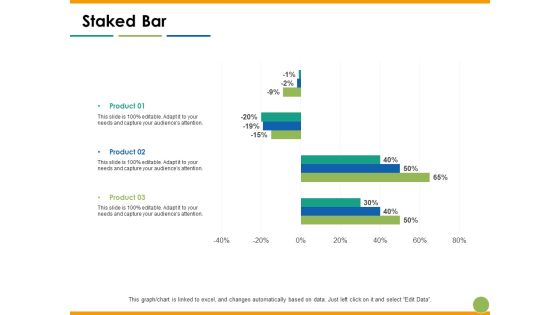
Staked Bar Capability Maturity Matrix Ppt PowerPoint Presentation Slides Outfit
This is a staked bar capability maturity matrix ppt powerpoint presentation slides outfit. This is a three stage process. The stages in this process are staked bar, product, year, finance, percentage.
Stacked Area Clustered Column Ppt PowerPoint Presentation Inspiration Icon
This is a stacked area clustered column ppt powerpoint presentation inspiration icon. This is a three stage process. The stages in this process are stacked area clustered column, product, year, in dollars, business.

Clustered Bar Finance Ppt PowerPoint Presentation Gallery Background Images
This is a clustered bar finance ppt powerpoint presentation gallery background images. This is a four stage process. The stages in this process are finance, marketing, analysis, business, investment.
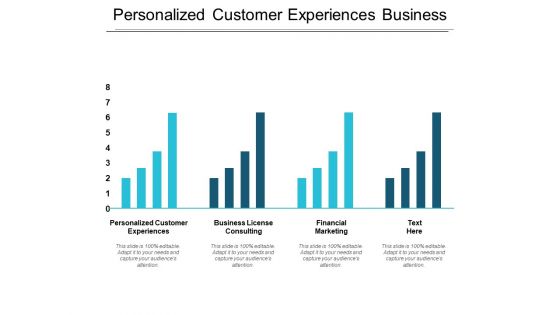
Personalized Customer Experiences Business License Consulting Finance Marketing Ppt PowerPoint Presentation Infographic Template Professional
This is a personalized customer experiences business license consulting finance marketing ppt powerpoint presentation infographic template professional. This is a four stage process. The stages in this process are personalized customer experiences, business license consulting, finance marketing.

Bar Graph Finance Ppt PowerPoint Presentation Infographics Background Designs
This is a bar graph finance ppt powerpoint presentation infographics background designs. This is a two stage process. The stages in this process are finance, analysis, business, investment, marketing.

Clustered Bar Finance Ppt PowerPoint Presentation Show Background Image
This is a clustered bar finance ppt powerpoint presentation show background image. This is a two stage process. The stages in this process are finance, analysis, business, investment, marketing.
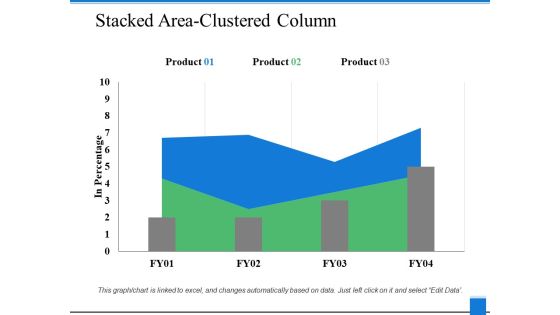
Stacked Area Clustered Column Finance Ppt PowerPoint Presentation Good
This is a stacked area clustered column finance ppt powerpoint presentation good. This is a three stage process. The stages in this process are finance, analysis, business, investment, marketing.

Clustered Bar Finance Ppt PowerPoint Presentation Icon Infographic Template
This is a clustered bar finance ppt powerpoint presentation icon infographic template. This is a three stage process. The stages in this process are finance, analysis, business, investment, marketing.
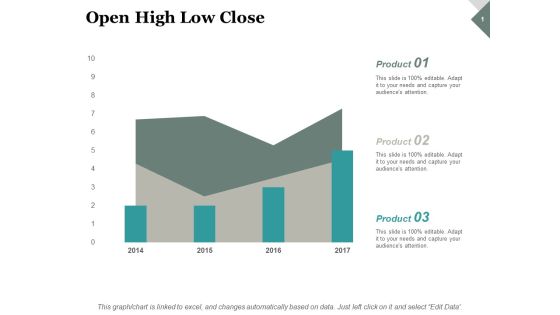
Open High Low Close Finance Ppt PowerPoint Presentation Professional Layout
This is a open high low close finance ppt powerpoint presentation professional layout. This is a three stage process. The stages in this process are finance, analysis, business, investment, marketing.

Open High Low Close Investment Ppt PowerPoint Presentation Slides Portrait
This is a open high low close investment ppt powerpoint presentation slides portrait. This is a two stage process. The stages in this process are finance, analysis, business, investment, marketing.
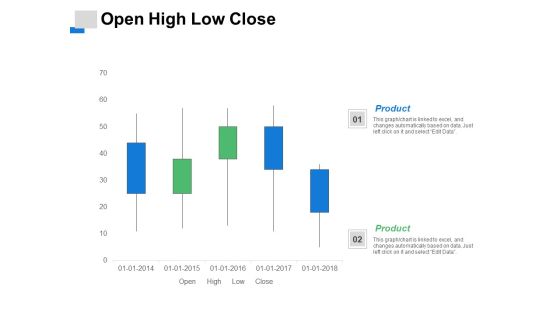
Open High Low Close Investment Ppt PowerPoint Presentation Slides Visuals
This is a open high low close investment ppt powerpoint presentation slides visuals. This is a two stage process. The stages in this process are finance, analysis, business, investment, marketing.
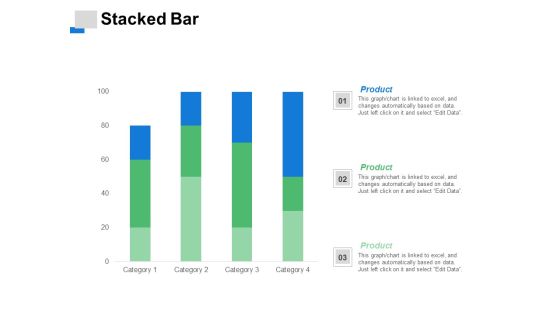
Stacked Bar Finance Ppt PowerPoint Presentation Pictures Gallery
This is a stacked bar finance ppt powerpoint presentation pictures gallery. This is a three stage process. The stages in this process are stacked bar, finance, marketing, analysis, investment.
Open High Low Close Finance Ppt PowerPoint Presentation Icon Deck
This is a open high low close finance ppt powerpoint presentation icon deck. This is a two stage process. The stages in this process are finance, analysis, business, investment, marketing.
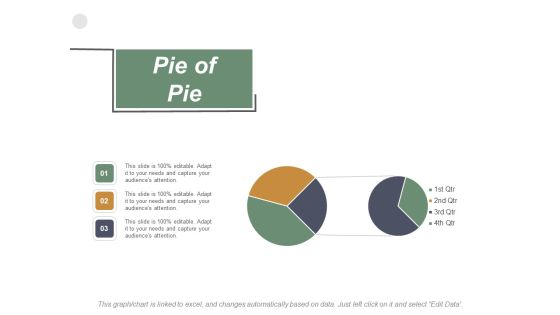
Pie Of Pie Investment Ppt PowerPoint Presentation Inspiration Objects
This is a pie of pie investment ppt powerpoint presentation inspiration objects. This is a three stage process. The stages in this process are finance, analysis, business, investment, marketing.

Return On Investment Marketing Ppt PowerPoint Presentation Pictures Design Templates
This is a return on investment marketing ppt powerpoint presentation pictures design templates. This is a four stage process. The stages in this process are finance, analysis, business, investment, marketing.
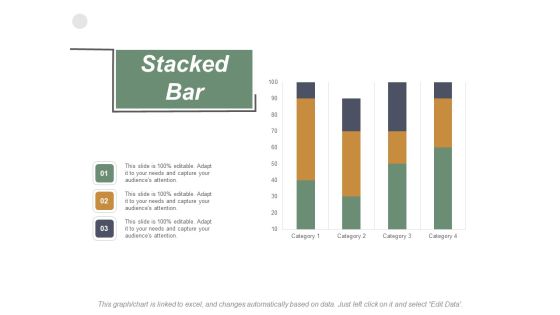
Stacked Bar Finance Ppt PowerPoint Presentation Summary Skills
This is a stacked bar finance ppt powerpoint presentation summary skills. This is a three stage process. The stages in this process are stacked bar, finance, marketing, analysis, business.

Stacked Bar Finance Marketing Ppt PowerPoint Presentation Summary Slide Download
This is a stacked bar finance marketing ppt powerpoint presentation summary slide download. This is a three stage process. The stages in this process are stacked bar, finance, marketing, analysis, investment.

Clustered Bar Finance Ppt PowerPoint Presentation Gallery Graphics Design
This is a clustered bar finance ppt powerpoint presentation gallery graphics design. This is a four stage process. The stages in this process are finance, analysis, business, investment, marketing.

Clustered Column Line Investment Ppt PowerPoint Presentation Infographic Template File Formats
This is a clustered column line investment ppt powerpoint presentation infographic template file formats. This is a three stage process. The stages in this process are finance, analysis, business, investment, marketing.

Capability Maturity Matrix Marketing Ppt PowerPoint Presentation Layouts Pictures
This is a capability maturity matrix marketing ppt powerpoint presentation layouts pictures. This is a five stage process. The stages in this process are Finance, Analysis, Business, Investment, Marketing.

Clustered Bar Finance Marketing Ppt PowerPoint Presentation Model Deck
This is a clustered bar finance marketing ppt powerpoint presentation model deck. This is a three stage process. The stages in this process are finance, marketing, analysis, business, investment.
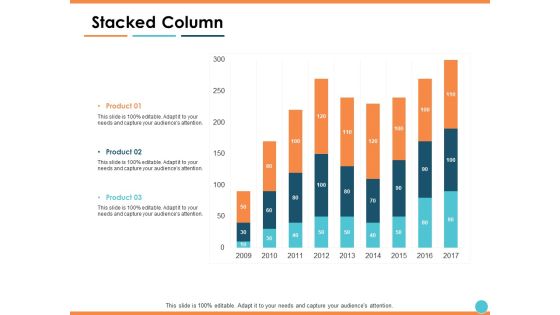
Stacked Column Finance Ppt PowerPoint Presentation File Slide Portrait
This is a stacked column finance ppt powerpoint presentation file slide portrait. This is a three stage process. The stages in this process are finance, marketing, analysis, business, investment.

Bar Plot For Data Visualization Ppt Powerpoint Presentation Pictures Guide
This is a bar plot for data visualization ppt powerpoint presentation pictures guide. This is a four stage process. The stages in this process are scatter plot, probability plots, plot diagram.

Man Standing With Stack Of Us Currency Notes Bundles Ppt Powerpoint Presentation File Slides
This is a man standing with stack of us currency notes bundles ppt powerpoint presentation file slides. This is a three stage process. The stages in this process are stacked bar, pile bar, heap bar.

Clustered Column Line Investment Ppt PowerPoint Presentation Styles Smartart
This is a clustered column line investment ppt powerpoint presentation styles smartart. This is a three stage process. The stages in this process are finance, analysis, business, investment, marketing.

January 2000 July 2013 Marketing Ppt PowerPoint Presentation File Slide Download
This is a january 2000 july 2013 marketing ppt powerpoint presentation file slide download. This is a four stage process. The stages in this process are finance, analysis, business, investment, marketing.

Marketing Return On Investment Ppt PowerPoint Presentation Infographics Files
This is a marketing return on investment ppt powerpoint presentation infographics files. This is a three stage process. The stages in this process are marketing investment, impressions, return on investment, finance, marketing.

Kpis In Shipping Perfect Order Rate And On Time Shipment Ppt PowerPoint Presentation Show Guide
This is a kpis in shipping perfect order rate and on time shipment ppt powerpoint presentation show guide. This is a six stage process. The stages in this process are logistics performance, logistics dashboard, logistics kpis.
Logistics Kpis And Metrics Percentage Of Orders Delivered Ppt PowerPoint Presentation Icon
This is a logistics kpis and metrics percentage of orders delivered ppt powerpoint presentation icon. This is a five stage process. The stages in this process are logistics performance, logistics dashboard, logistics kpis.

100 Percent Stacked Bar Finance Ppt PowerPoint Presentation Model Templates
This is a 100 percent stacked bar finance ppt powerpoint presentation model templates. This is a three stage process. The stages in this process are finance, analysis, business, investment, marketing.

Open High Low Close Ppt PowerPoint Presentation Slides Guidelines
This is a open high low close ppt powerpoint presentation slides guidelines. This is a two stage process. The stages in this process are finance, analysis, business, investment, marketing.
Retail Competition Ppt PowerPoint Presentation Icon Microsoft
This is a retail competition ppt powerpoint presentation icon microsoft. This is a six stage process. The stages in this process are customer service, shipping speed, product quality, price, product fidelity.

Retail Global Trends Comparing Online Ppt PowerPoint Presentation Infographics Guide
This is a retail global trends comparing online ppt powerpoint presentation infographics guide. This is a two stage process. The stages in this process are finance, analysis, business, investment, marketing.
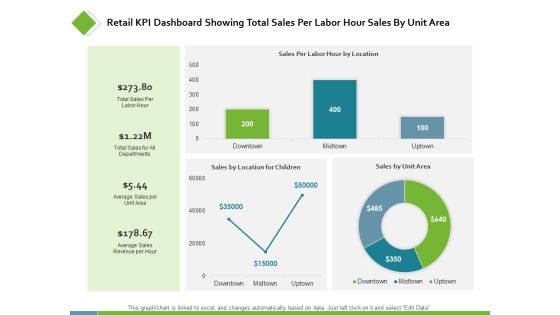
Retail KPI Dashboard Showing Total Sales Per Labor Ppt PowerPoint Presentation Styles Examples
This is a retail kpi dashboard showing total sales per labor ppt powerpoint presentation styles examples. This is a three stage process. The stages in this process are finance, analysis, business, investment, marketing.
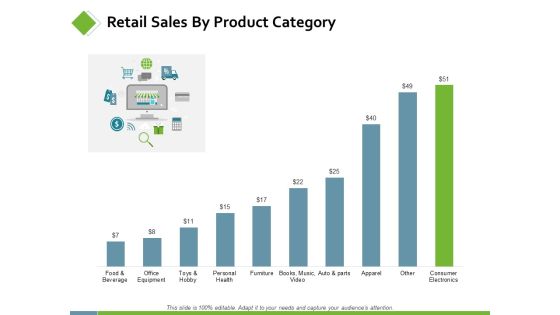
Retail Sales By Product Category Ppt PowerPoint Presentation Infographic Template Images
This is a retail sales by product category ppt powerpoint presentation infographic template images. This is a two stage process. The stages in this process are finance, analysis, business, investment, marketing.
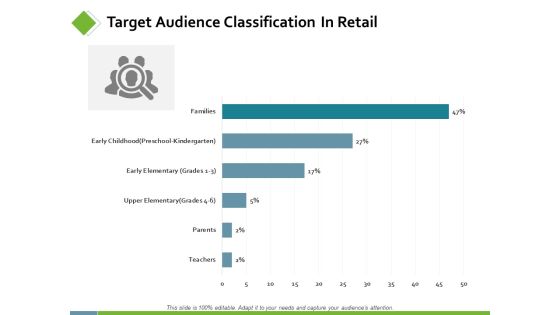
Target Audience Classification In Retail Ppt PowerPoint Presentation Summary Infographics
This is a target audience classification in retail ppt powerpoint presentation summary infographics. This is a two stage process. The stages in this process are finance, analysis, business, investment, marketing.
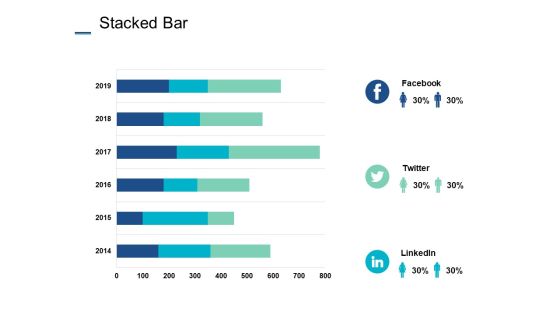
Stacked Bar Investment Ppt PowerPoint Presentation Ideas Graphics Tutorials
This is a stacked bar investment ppt powerpoint presentation ideas graphics tutorials. This is a three stage process. The stages in this process are stacked bar, finance, marketing, analysis, business, investment.
Employee Weekly Efficiency Dashboard Ppt PowerPoint Presentation Icon Backgrounds
This is a employee weekly efficiency dashboard ppt powerpoint presentation icon backgrounds. This is a four stage process. The stages in this process are finance, analysis, business, investment, marketing.

Project Health Card Business Ppt PowerPoint Presentation Summary Samples
This is a project health card business ppt powerpoint presentation summary samples. This is a three stage process. The stages in this process are finance, analysis, business, investment, marketing.

Dashboard Finance Ppt PowerPoint Presentation Infographic Template Graphic Tips
This is a dashboard finance ppt powerpoint presentation infographic template graphic tips. This is a three stage process. The stages in this process are dashboard, finance, analysis, business, investment.
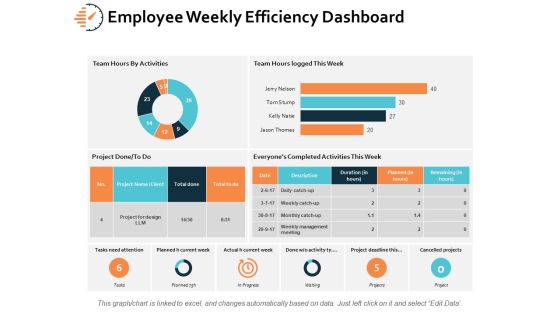
Employee Weekly Efficiency Dashboard Ppt PowerPoint Presentation Infographics Microsoft
This is a employee weekly efficiency dashboard ppt powerpoint presentation infographics microsoft. This is a six stage process. The stages in this process are finance, analysis, business, investment, marketing.
Negative Impacts Of Workplace Stress Finance Ppt PowerPoint Presentation Icon Inspiration
This is a negative impacts of workplace stress finance ppt powerpoint presentation icon inspiration. This is a five stage process. The stages in this process are finance, analysis, business, investment, marketing.

Waterfall Graph Showing Births Deaths And Population Change Ppt PowerPoint Presentation Infographic Template Visual Aids
This is a waterfall graph showing births deaths and population change ppt powerpoint presentation infographic template visual aids. This is a three stage process. The stages in this process are profit and loss, balance sheet, income statement, benefit and loss.

Waterfall Graph Showing Business Progress Ppt PowerPoint Presentation Styles Model
This is a waterfall graph showing business progress ppt powerpoint presentation styles model. This is a three stage process. The stages in this process are profit and loss, balance sheet, income statement, benefit and loss.

Waterfall Graph Showing Net Sales And Gross Profit Ppt PowerPoint Presentation Infographics Format
This is a waterfall graph showing net sales and gross profit ppt powerpoint presentation infographics format. This is a three stage process. The stages in this process are profit and loss, balance sheet, income statement, benefit and loss.
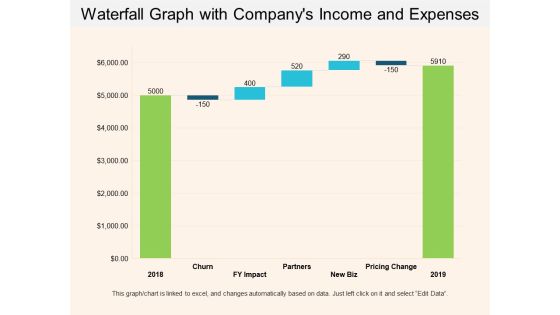
Waterfall Graph With Companys Income And Expenses Ppt PowerPoint Presentation Show Example Introduction
This is a waterfall graph with companys income and expenses ppt powerpoint presentation show example introduction. This is a three stage process. The stages in this process are profit and loss, balance sheet, income statement, benefit and loss.

Waterfall Graph With Monthly Expenses And Savings Ppt PowerPoint Presentation Layouts Clipart Images
This is a waterfall graph with monthly expenses and savings ppt powerpoint presentation layouts clipart images. This is a three stage process. The stages in this process are profit and loss, balance sheet, income statement, benefit and loss.
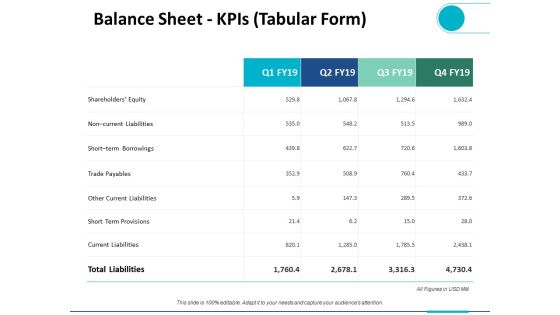
Balance Sheet Kpis Tabular Form Ppt PowerPoint Presentation Ideas Design Templates
This is a balance sheet kpis tabular form ppt powerpoint presentation ideas design templates. This is a four stage process. The stages in this process are finance, analysis, business, investment, marketing.
 Home
Home