Financial Performance Dashboard

Company Sales And Performance Dashboard Ppt PowerPoint Presentation Inspiration Gallery
Presenting this set of slides with name company sales and performance dashboard ppt powerpoint presentation inspiration gallery. The topics discussed in these slides are month growth in revenue, product sales, profit margins graph . This is a completely editable PowerPoint presentation and is available for immediate download. Download now and impress your audience.

Company Sales And Performance Dashboard Ppt PowerPoint Presentation Inspiration Skills
Presenting this set of slides with name company sales and performance dashboard ppt powerpoint presentation inspiration skills. The topics discussed in these slides are growth revenue, product sales, profits. This is a completely editable PowerPoint presentation and is available for immediate download. Download now and impress your audience.

Company Sales And Performance Dashboard Ppt PowerPoint Presentation Model Ideas
Presenting this set of slides with name company sales and performance dashboard ppt powerpoint presentation model ideas. The topics discussed in these slides are 5 month growth in revenue, 4 year product sales, profit margins graph, 4 year profits . This is a completely editable PowerPoint presentation and is available for immediate download. Download now and impress your audience.

Company Sales And Performance Dashboard Ppt PowerPoint Presentation Slides Background
Presenting this set of slides with name company sales and performance dashboard ppt powerpoint presentation slides background. The topics discussed in these slides are 5 month growth in revenue, 4 year product sales, profit margins graph, 4 year profits. This is a completely editable PowerPoint presentation and is available for immediate download. Download now and impress your audience.

Organization Performance Evaluation Sales Management Dashboard Slides PDF
Deliver an awe inspiring pitch with this creative organization performance evaluation sales management dashboard slides pdf bundle. Topics like sales, opportunities, revenue, territory can be discussed with this completely editable template. It is available for immediate download depending on the needs and requirements of the user.
Sales Dashboard With Numbers To Measure Company Performance Icons PDF
Showcasing this set of slides titled Sales Dashboard With Numbers To Measure Company Performance Icons PDF. The topics addressed in these templates are Marketing, Sales, Revenue. All the content presented in this PPT design is completely editable. Download it and make adjustments in color, background, font etc. as per your unique business setting.

KPI Dashboard To Evaluate Sales Performance Template PDF
The following slide outlines key performance indicator KPI dashboard to monitor sales performance of company. The key metrics covered in slide are total sales by location, monthly sales trend, average revenue AR by clients, etc. Welcome to our selection of the KPI Dashboard To Evaluate Sales Performance Template PDF. These are designed to help you showcase your creativity and bring your sphere to life. Planning and Innovation are essential for any business that is just starting out. This collection contains the designs that you need for your everyday presentations. All of our PowerPoints are 100 percent editable, so you can customize them to suit your needs. This multi-purpose template can be used in various situations. Grab these presentation templates today

Business Key Performance Metrics Review Dashboard Portrait PDF
The following slide shows a dashboard of sales strategy review of firm that can be used by marketing, product, finance managers for reviewing the business. It further includes KPI that are revenue, new customer, gross profit purchaser satisfaction, income comparison, sales categories and profitability. Showcasing this set of slides titled Business Key Performance Metrics Review Dashboard Portrait PDF. The topics addressed in these templates are Sales, Revenue Comparison, Profitability. All the content presented in this PPT design is completely editable. Download it and make adjustments in color, background, font etc. as per your unique business setting.
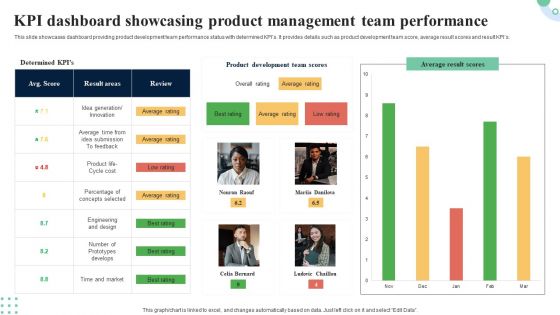
KPI Dashboard Showcasing Product Management Team Performance Demonstration PDF
This slide represents dashboard showcasing revenue assessment for new product development. It projects information regarding revenue breakdown, revenue per product, time to marketing and win or loss analysis. Showcasing this set of slides titled KPI Dashboard Showcasing Product Management Team Performance Demonstration PDF. The topics addressed in these templates are Revenue Per Project, Revenue Breakdown, Loss Analysis. All the content presented in this PPT design is completely editable. Download it and make adjustments in color, background, font etc. as per your unique business setting.
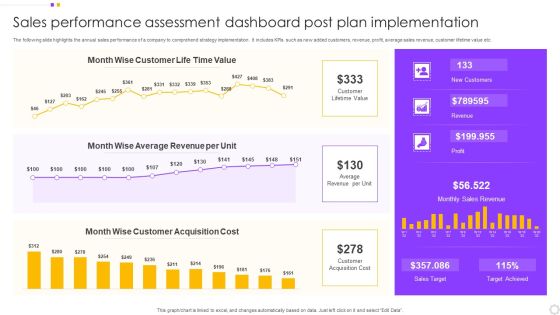
Sales Performance Assessment Dashboard Post Plan Implementation Introduction PDF
The following slide highlights the annual sales performance of a company to comprehend strategy implementation. It includes KPIs such as new added customers, revenue, profit, average sales revenue, customer lifetime value etc. Pitch your topic with ease and precision using this Sales Performance Assessment Dashboard Post Plan Implementation Introduction PDF. This layout presents information on Customer, Value, Average Revenue. It is also available for immediate download and adjustment. So, changes can be made in the color, design, graphics or any other component to create a unique layout.

Business Performance Review Dashboard With Customer Acquisition Cost Diagrams PDF
The following slide highlights KPI dashboard which can be used for quarterly business review QBR. It provides detailed information about actual revenue vs target, number of new customers, average revenue per customer, customer acquisition cost CAC etc. Pitch your topic with ease and precision using this Business Performance Review Dashboard With Customer Acquisition Cost Diagrams PDF. This layout presents information on Revenue, Customer Acquisition Cost, Current Quarter. It is also available for immediate download and adjustment. So, changes can be made in the color, design, graphics or any other component to create a unique layout.
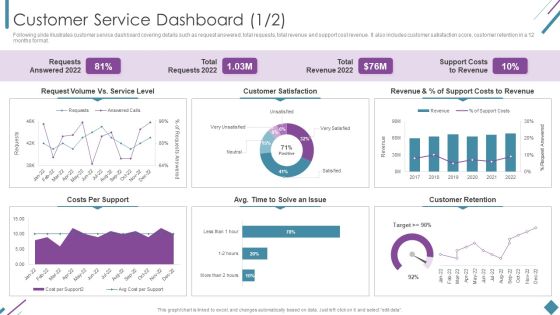
Metrics To Measure Business Performance Customer Service Dashboard Sample PDF
Following slide illustrates customer service dashboard covering details such as request answered, total requests, total revenue and support cost revenue. It also includes customer satisfaction score, customer retention in a 12 months format. Deliver and pitch your topic in the best possible manner with this Metrics To Measure Business Performance Customer Service Dashboard Sample PDF. Use them to share invaluable insights on Requests Answered 2022, Total Requests 2022, Total Revenue 2022 and impress your audience. This template can be altered and modified as per your expectations. So, grab it now.
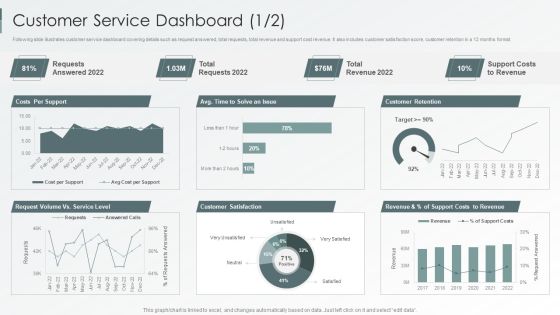
Enterprise Sustainability Performance Metrics Customer Service Dashboard Professional PDF
Following slide illustrates customer service dashboard covering details such as request answered, total requests, total revenue and support cost revenue. It also includes customer satisfaction score, customer retention in a 12 months format.Deliver and pitch your topic in the best possible manner with this Enterprise Sustainability Performance Metrics Customer Service Dashboard Professional PDF. Use them to share invaluable insights on Customer Satisfaction, Customer Retention, Support Revenue and impress your audience. This template can be altered and modified as per your expectations. So, grab it now.

Customer Service Dashboard Company Performance Evaluation Using KPI Themes PDF
Following slide illustrates customer service dashboard covering details such as request answered, total requests, total revenue and support cost revenue. It also includes customer satisfaction score, customer retention in a 12 months format. Deliver and pitch your topic in the best possible manner with this Customer Service Dashboard Company Performance Evaluation Using KPI Themes PDF. Use them to share invaluable insights on Requests Answered, Total Revenue, Customer Retention and impress your audience. This template can be altered and modified as per your expectations. So, grab it now.
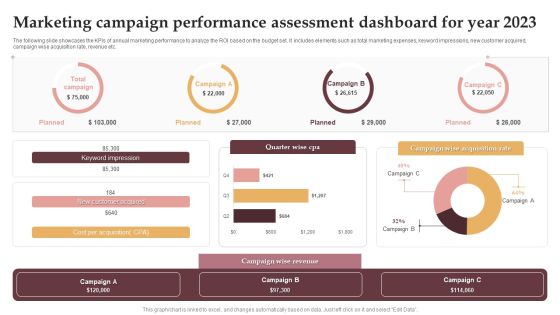
Marketing Campaign Performance Assessment Dashboard For Year 2023 Download PDF
The following slide showcases the KPIs of annual marketing performance to analyze the ROI based on the budget set. It includes elements such as total marketing expenses, keyword impressions, new customer acquired, campaign wise acquisition rate, revenue etc. Showcasing this set of slides titled Marketing Campaign Performance Assessment Dashboard For Year 2023 Download PDF. The topics addressed in these templates are Keyword Impression, New Customer Acquired, Campaign Wise Revenue. All the content presented in this PPT design is completely editable. Download it and make adjustments in color, background, font etc. as per your unique business setting.

Organization Performance Strategic Evaluation Dashboard Ppt Slides Visual Aids PDF
This slide showcases dashboard to review business activities strategically for continual growth in company revenue and profits. It further includes KPIs such as sales, new consumers, actual and targets met, etc. Showcasing this set of slides titled Organization Performance Strategic Evaluation Dashboard Ppt Slides Visual Aids PDF. The topics addressed in these templates are Average Revenue Per Unit, Customer Lifetime Value, Customer Acquisition Cost. All the content presented in this PPT design is completely editable. Download it and make adjustments in color, background, font etc. as per your unique business setting.

Quarterly Overall Business Performance Assessment With Kpi Dashboard Microsoft PDF
The given below slide showcases the overall business performance to evaluate the trends and KPAs. It includes quarterly insights of elements such as revenue, new customers, net profit, customer satisfaction, sales profitability, growth etc. Pitch your topic with ease and precision using this Quarterly Overall Business Performance Assessment With Kpi Dashboard Microsoft PDF. This layout presents information on Revenue, Customer Satisfaction, Net Profit. It is also available for immediate download and adjustment. So, changes can be made in the color, design, graphics or any other component to create a unique layout.
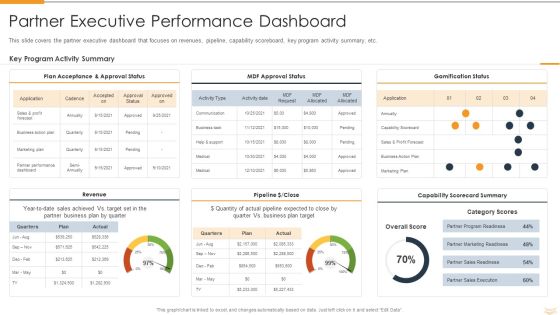
Strategic Partnership Management Plan Partner Executive Performance Dashboard Guidelines PDF
This slide covers the partner executive dashboard that focuses on revenues, pipeline, capability scoreboard, key program activity summary, etc. Deliver and pitch your topic in the best possible manner with this strategic partnership management plan partner executive performance dashboard guidelines pdf. Use them to share invaluable insights on plan acceptance and approval status, revenue, mdf approval status, gamification status, pipeline or close, capability scorecard summary and impress your audience. This template can be altered and modified as per your expectations. So, grab it now.
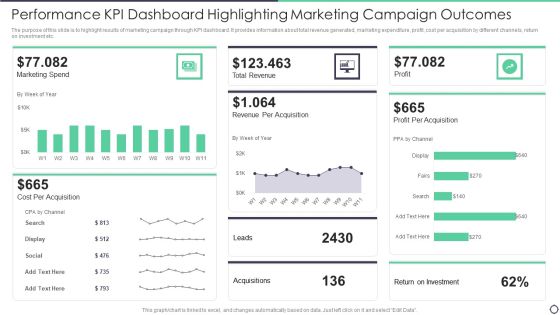
Performance Kpi Dashboard Highlighting Marketing Campaign Outcomes Topics PDF
The purpose of this slide is to highlight results of marketing campaign through KPI dashboard. It provides information about total revenue generated, marketing expenditure, profit, cost per acquisition by different channels, return on investment etc. Pitch your topic with ease and precision using this Performance Kpi Dashboard Highlighting Marketing Campaign Outcomes Topics PDF. This layout presents information on Cost, Marketing, Revenue. It is also available for immediate download and adjustment. So, changes can be made in the color, design, graphics or any other component to create a unique layout.
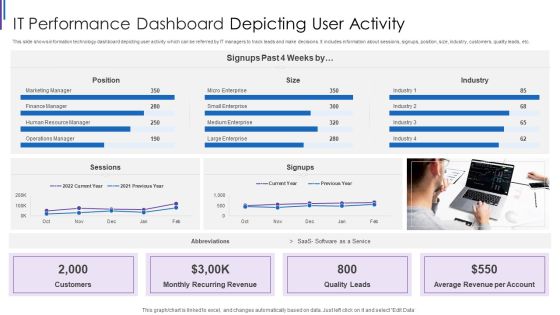
IT Performance Dashboard Depicting User Activity Inspiration PDF
This slide shows information technology dashboard depicting user activity which can be referred by IT managers to track leads and make decisions. It includes information about sessions, signups, position, size, industry, customers, quality leads, etc. Pitch your topic with ease and precision using this IT Performance Dashboard Depicting User Activity Inspiration PDF. This layout presents information on Monthly Recurring Revenue, Average Revenue Per, Account Quality Leads, Customers Position Sessions. It is also available for immediate download and adjustment. So, changes can be made in the color, design, graphics or any other component to create a unique layout.
Multi Channel Marketing Strategies Performance Tracking Dashboard Elements PDF
This slide covers dashboard to track achievements of various communication channel. It includes elements such as revenue, sessions, costs, CTR. ROAS. It also includes communication channels such as Instagram, Facebook, Google Ads, Pinterest and Twitter. Pitch your topic with ease and precision using this Multi Channel Marketing Strategies Performance Tracking Dashboard Elements PDF. This layout presents information on Channel Grouping, Revenue Cost Date, Sessions. It is also available for immediate download and adjustment. So, changes can be made in the color, design, graphics or any other component to create a unique layout.
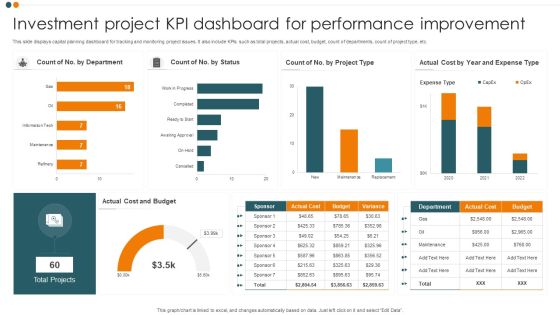
Investment Project KPI Dashboard For Performance Improvement Guidelines PDF
This slide displays capital planning dashboard for tracking and monitoring project issues. It also include KPIs such as total projects, actual cost, budget, count of departments, count of project type, etc. Pitch your topic with ease and precision using this Investment Project KPI Dashboard For Performance Improvement Guidelines PDF. This layout presents information on Cost And Budget, Total Projects, Expense Type. It is also available for immediate download and adjustment. So, changes can be made in the color, design, graphics or any other component to create a unique layout.
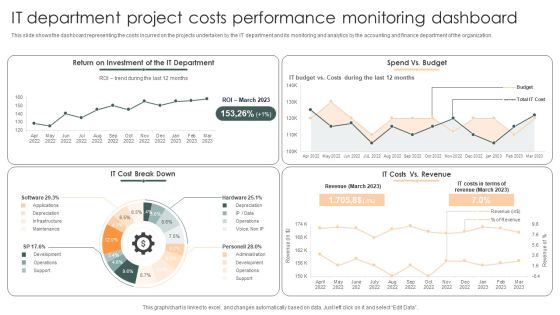
IT Department Project Costs Performance Monitoring Dashboard Demonstration PDF
This slide shows the dashboard representing the costs incurred on the projects undertaken by the IT department and its monitoring and analytics by the accounting and finance department of the organization.Showcasing this set of slides titled IT Department Project Costs Performance Monitoring Dashboard Demonstration PDF. The topics addressed in these templates are Return Investment, Cost Break, Costs Revenue. All the content presented in this PPT design is completely editable. Download it and make adjustments in color, background, font etc. as per your unique business setting.
Monthly Sales Performance Tracking And Monitoring Dashboard Inspiration PDF
This slide showcases a dashboard presenting various metrics to measure and analyze sales performance for revenue growth. It includes key components such as number of sales, revenue, profit, cost, sales revenue, sales increment, cost analysis and cross sell. Coming up with a presentation necessitates that the majority of the effort goes into the content and the message you intend to convey. The visuals of a PowerPoint presentation can only be effective if it supplements and supports the story that is being told. Keeping this in mind our experts created Monthly Sales Performance Tracking And Monitoring Dashboard Inspiration PDF to reduce the time that goes into designing the presentation. This way, you can concentrate on the message while our designers take care of providing you with the right template for the situation.
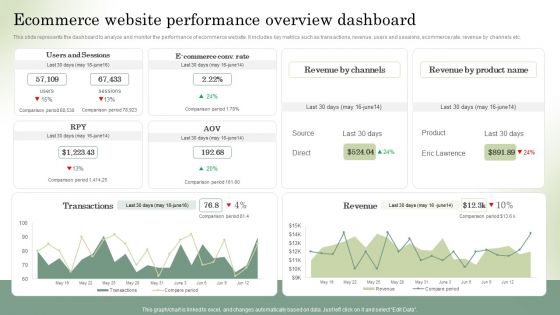
Optimizing Online Stores Ecommerce Website Performance Overview Dashboard Summary PDF
This slide represents the dashboard to analyze and monitor the performance of ecommerce website. It includes key metrics such as transactions, revenue, users and sessions, ecommerce rate, revenue by channels etc. Are you in need of a template that can accommodate all of your creative concepts This one is crafted professionally and can be altered to fit any style. Use it with Google Slides or PowerPoint. Include striking photographs, symbols, depictions, and other visuals. Fill, move around, or remove text boxes as desired. Test out color palettes and font mixtures. Edit and save your work, or work with colleagues. Download Optimizing Online Stores Ecommerce Website Performance Overview Dashboard Summary PDF and observe how to make your presentation outstanding. Give an impeccable presentation to your group and make your presentation unforgettable.
Social Media Performance Analytics Dashboard Ppt Styles Icons PDF
Following slide exhibits social media management statistics with website report. It includes multiple KPIs such as website traffic, followers on multiple social media platforms and site revenue. Showcasing this set of slides titled social media performance analytics dashboard ppt styles icons pdf. The topics addressed in these templates are site revenue, website traffic. All the content presented in this PPT design is completely editable. Download it and make adjustments in color, background, font etc. as per your unique business setting.

Yearly Business Performance Assessment And Evaluation Dashboard Structure PDF
This slide contains annual business review of a company. It includes revenue comparison, sales assessment and profitability representation. Showcasing this set of slides titled Yearly Business Performance Assessment And Evaluation Dashboard Structure PDF. The topics addressed in these templates are Revenue Comparison, Sales, Profitability. All the content presented in this PPT design is completely editable. Download it and make adjustments in color, background, font etc. as per your unique business setting.
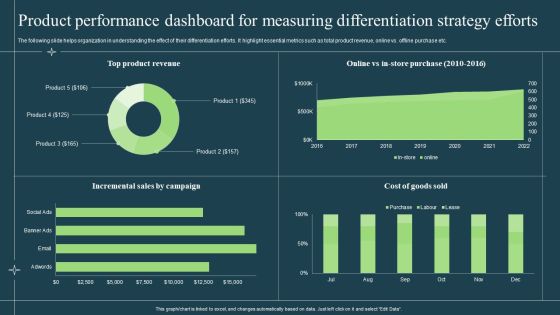
Product Performance Dashboard For Measuring Differentiation Strategy Efforts Diagrams PDF
The following slide helps organization in understanding the effect of their differentiation efforts. It highlight essential metrics such as total product revenue, online vs. offline purchase etc. Deliver an awe inspiring pitch with this creative Product Performance Dashboard For Measuring Differentiation Strategy Efforts Diagrams PDF bundle. Topics like Product, Incremental Sales, Cost Of Goods can be discussed with this completely editable template. It is available for immediate download depending on the needs and requirements of the user.

Web Usage Analysis Summary Dashboard To Track Performance Background PDF
This slide covers website usage analytics report for tracking performs. It involves all details about number of visitors, leads, consumer, major landing pages and average revenue per consumer. Showcasing this set of slides titled Web Usage Analysis Summary Dashboard To Track Performance Background PDF. The topics addressed in these templates are Customer Churn Rate, Bounce Rate, Monthly Recurring Revenue. All the content presented in this PPT design is completely editable. Download it and make adjustments in color, background, font etc. as per your unique business setting.

International Sales Performance Dashboard With Regional Market Report Inspiration PDF
This slide showcases global report that can help organization to estimate forecast of the sales and identify yearly revenue generated. Its key elements are yearly sales, market share, regional outlook, competitor analysis and geographical sales. Pitch your topic with ease and precision using this International Sales Performance Dashboard With Regional Market Report Inspiration PDF. This layout presents information on Regional Outlook, Sales And Forecast, Market Share Overview. It is also available for immediate download and adjustment. So, changes can be made in the color, design, graphics or any other component to create a unique layout.

Performance Metrics Dashboard To Track Overall Rebranding Effectiveness Professional PDF
This slide provides information regarding essential characteristics of co-branding in terms of strategic partnership, build credibility, developing marketing strategy, develop innovation and value addition, etc. Make sure to capture your audiences attention in your business displays with our gratis customizable Performance Metrics Dashboard To Track Overall Rebranding Effectiveness Professional PDF. These are great for business strategies, office conferences, capital raising or task suggestions. If you desire to acquire more customers for your tech business and ensure they stay satisfied, create your own sales presentation with these plain slides.

Branch Performance Evaluation Dashboard With Profit And Revenue Diagrams PDF
The slides showcases tips for enhancing branchs workforce performance and efficiency. It covers utilize transaction analysis data, schedule idle time, incent staff for efficiency, get bottom support and use part-time staff.Persuade your audience using this Best Practices To Improve Branch Workforce Performance Evaluation And Efficiency Introduction PDF. This PPT design covers five stages, thus making it a great tool to use. It also caters to a variety of topics including Market Opportunities, Customer Branch, Unnecessary Labor. Download this PPT design now to present a convincing pitch that not only emphasizes the topic but also showcases your presentation skills.

Business Performance Review Dashboard To Measure Overall Business Performance Formats PDF
The following slide highlights a comprehensive quarterly business review QBR dashboard which can be used by the organization to evaluate business performance. The metrics used for review are total revenue, new customers, gross profit, overall costs, sales comparison, sales by different products and top performing channels. Showcasing this set of slides titled Business Performance Review Dashboard To Measure Overall Business Performance Formats PDF. The topics addressed in these templates are Sales Comparison, Sales Product, High Performing. All the content presented in this PPT design is completely editable. Download it and make adjustments in color, background, font etc. as per your unique business setting.
Process Enhancement Plan To Boost Sales Performance Monthly Sales Performance Tracking And Monitoring Dashboard Professional PDF
This slide showcases a dashboard presenting various metrics to measure and analyze sales performance for revenue growth. It includes key components such as number of sales, revenue, profit, cost, sales revenue, sales increment, cost analysis and cross sell. Create an editable Process Enhancement Plan To Boost Sales Performance Monthly Sales Performance Tracking And Monitoring Dashboard Professional PDF that communicates your idea and engages your audience. Whether youre presenting a business or an educational presentation, pre designed presentation templates help save time. Process Enhancement Plan To Boost Sales Performance Monthly Sales Performance Tracking And Monitoring Dashboard Professional PDF is highly customizable and very easy to edit, covering many different styles from creative to business presentations. Slidegeeks has creative team members who have crafted amazing templates. So, go and get them without any delay.
Process Enhancement Plan To Boost Sales Performance Social Media Performance Tracking And Monitoring Dashboard Elements PDF
The following slide showcases a dashboard to track and measure social media platforms performance. It includes key elements such as website traffic, social media referral rate, site revenue, social media site revenue, etc. Get a simple yet stunning designed Process Enhancement Plan To Boost Sales Performance Social Media Performance Tracking And Monitoring Dashboard Elements PDF. It is the best one to establish the tone in your meetings. It is an excellent way to make your presentations highly effective. So, download this PPT today from Slidegeeks and see the positive impacts. Our easy to edit Process Enhancement Plan To Boost Sales Performance Social Media Performance Tracking And Monitoring Dashboard Elements PDF can be your go-to option for all upcoming conferences and meetings. So, what are you waiting for Grab this template today.

Performance Based Marketing Dashboard To Track Results Of Performance Marketing Ad Designs PDF
This slide showcases dashboard that can help marketers to track and evaluate the outcomes of performance marketing ad campaigns. Its key elements are impressions, clicks, conversions, click through rate, cost per conversion, revenue per click etc. Whether you have daily or monthly meetings, a brilliant presentation is necessary. Performance Based Marketing Dashboard To Track Results Of Performance Marketing Ad Designs PDF can be your best option for delivering a presentation. Represent everything in detail using Performance Based Marketing Dashboard To Track Results Of Performance Marketing Ad Designs PDF and make yourself stand out in meetings. The template is versatile and follows a structure that will cater to your requirements. All the templates prepared by Slidegeeks are easy to download and edit. Our research experts have taken care of the corporate themes as well. So, give it a try and see the results.

Venture Capitalist Control Board Key Performance Indicators Dashboard For Operational Performance Analysis Formats PDF
Presenting this set of slides with name venture capitalist control board key performance indicators dashboard for operational performance analysis formats pdf. The topics discussed in these slides are revenue and volume, research production, new client onboarding, trade support staff productivity, trade error frequency. This is a completely editable PowerPoint presentation and is available for immediate download. Download now and impress your audience.

Performance Analysis Of New Product Development Product Performance Dashboard Download PDF
The following slide displays the product performance dashboard as it highlights the top product by revenue, online vs. in store purchase, the sales by campaign. Deliver an awe inspiring pitch with this creative performance analysis of new product development product performance dashboard download pdf bundle. Topics like top products in revenue, sales by campaign, cost of goods sold, store vs online purchase can be discussed with this completely editable template. It is available for immediate download depending on the needs and requirements of the user.

Retail Weekly Sales Performance Report Dashboard To Measure Performance Ppt Gallery File Formats PDF
The following slide exhibits dashboard for small-scale retailers and product sales for chosen time period. It presents information related to revenue breakdown, total income, etc. Showcasing this set of slides titled Retail Weekly Sales Performance Report Dashboard To Measure Performance Ppt Gallery File Formats PDF. The topics addressed in these templates are Revenue Breakdown, Total Income, Total Revenue. All the content presented in this PPT design is completely editable. Download it and make adjustments in color, background, font etc. as per your unique business setting.
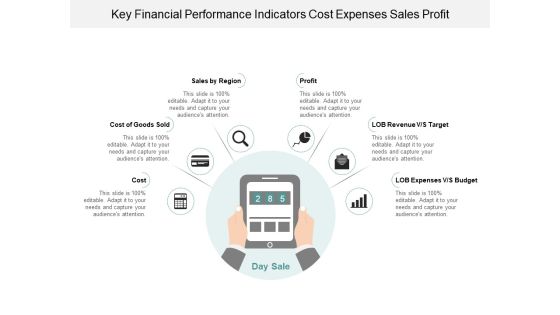
Key Financial Performance Indicators Cost Expenses Sales Profit Ppt Powerpoint Presentation Infographic Template Graphic Images
This is a key financial performance indicators cost expenses sales profit ppt powerpoint presentation infographic template graphic images. This is a six stage process. The stages in this process are dashboard, kpi, metrics.

KPI Dashboard To Monitor Financial Budget Allocation And Distribution Portrait PDF
This slide signifies the key performance indicator dashboard on organisation financial budget allocation within various department. It includes budget allocation, monthly performance, top suppliers etc.Deliver an awe inspiring pitch with this creative KPI Dashboard To Monitor Financial Budget Allocation And Distribution Portrait PDF bundle. Topics like Budget Allocated, Budget Distributed, Payable Account can be discussed with this completely editable template. It is available for immediate download depending on the needs and requirements of the user.

Profitability Key Performance Indicators Financial Activities Cash Flow Ppt Powerpoint Presentation Portfolio Clipart Images
This is a profitability key performance indicators financial activities cash flow ppt powerpoint presentation portfolio clipart images. This is a five stage process. The stages in this process are dashboard, kpi, metrics.
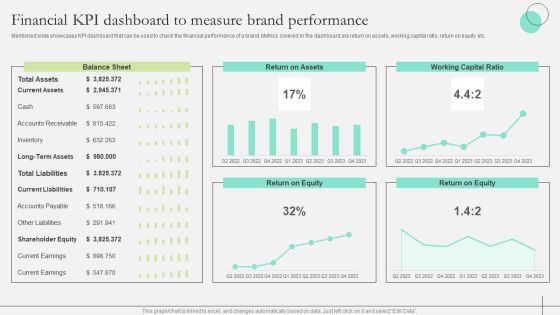
Comprehensive Guide To Strengthen Brand Equity Financial KPI Dashboard Measure Brand Structure PDF
Mentioned slide showcases KPI dashboard that can be used to check the financial performance of a brand. Metrics covered in the dashboard are return on assets, working capital ratio, return on equity etc. Take your projects to the next level with our ultimate collection of Comprehensive Guide To Strengthen Brand Equity Financial KPI Dashboard Measure Brand Structure PDF. Slidegeeks has designed a range of layouts that are perfect for representing task or activity duration, keeping track of all your deadlines at a glance. Tailor these designs to your exact needs and give them a truly corporate look with your own brand colors they will make your projects stand out from the rest

Crisis Management Program Presentation Financial Performance Tracking Slide Revenue Ideas PDF
This slide presents the dashboard which will help firm in tracking the fiscal performance. This dashboard displays revenues and expenses trends and payment received analysis. Deliver and pitch your topic in the best possible manner with this crisis management program presentation financial performance tracking slide revenue ideas pdf. Use them to share invaluable insights on revenue, expense trends, receivable analysis, financial performance tracking and impress your audience. This template can be altered and modified as per your expectations. So, grab it now.
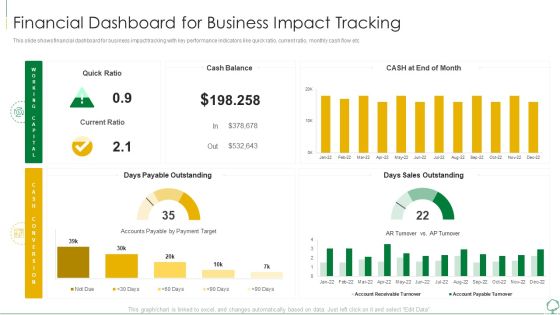
Environmental Examination Tools And Approaches Financial Dashboard For Business Professional PDF
This slide shows financial dashboard for business impact tracking with key performance indicators like quick ratio, current ratio, monthly cash flow etc. Deliver an awe inspiring pitch with this creative environmental examination tools and approaches financial dashboard for business professional pdf bundle. Topics like financial dashboard for business impact tracking can be discussed with this completely editable template. It is available for immediate download depending on the needs and requirements of the user.
Internal And External Business Environment Analysis Financial Dashboard For Business Impact Tracking Formats PDF
This slide shows financial dashboard for business impact tracking with key performance indicators like quick ratio, current ratio, monthly cash flow etc Deliver an awe inspiring pitch with this creative internal and external business environment analysis financial dashboard for business impact tracking formats pdf bundle. Topics like financial dashboard for business impact tracking can be discussed with this completely editable template. It is available for immediate download depending on the needs and requirements of the user.
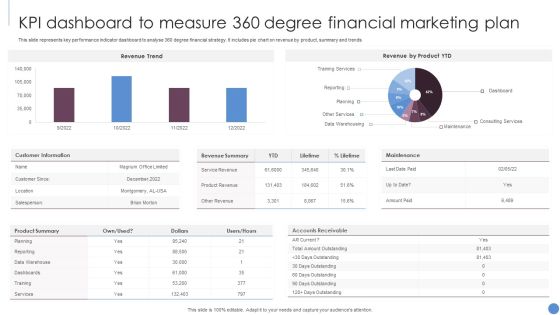
KPI Dashboard To Measure 360 Degree Financial Marketing Plan Slides PDF
This slide represents key performance indicator dashboard to analyse 360 degree financial strategy. It includes pie chart on revenue by product, summary and trends. Showcasing this set of slides titled KPI Dashboard To Measure 360 Degree Financial Marketing Plan Slides PDF. The topics addressed in these templates are Revenue Trend, Revenue Product YTD, Customer Information. All the content presented in this PPT design is completely editable. Download it and make adjustments in color, background, font etc. as per your unique business setting.
Environmental Assessment Financial Dashboard For Business Impact Tracking Ppt Layouts Guidelines PDF
This slide shows financial dashboard for business impact tracking with key performance indicators like quick ratio, current ratio, monthly cash flow etc Deliver and pitch your topic in the best possible manner with this environmental assessment financial dashboard for business impact tracking ppt layouts guidelines pdf. Use them to share invaluable insights on sales outstanding, cash balance, accounts payable and impress your audience. This template can be altered and modified as per your expectations. So, grab it now.

Building Market Brand Leadership Strategies Kpi Dashboard To Track Brand Performance Designs PDF
Mentioned slide showcases KPI dashboard that can be used to check the financial performance of a brand. Metrics covered in the dashboard are return on assets, working capital ratio, return on equity etc. There are so many reasons you need a Building Market Brand Leadership Strategies Kpi Dashboard To Track Brand Performance Designs PDF. The first reason is you cannot spend time making everything from scratch, Thus, Slidegeeks has made presentation templates for you too. You can easily download these templates from our website easily.
Determining Crisis Management BCP Financial Performance Tracking Slide Ppt PowerPoint Presentation Layouts Guidelines PDF
This slide presents the dashboard which will help firm in tracking the fiscal performance. This dashboard displays revenues and expenses trends and payment received analysis. Deliver an awe inspiring pitch with this creative determining crisis management bcp financial performance tracking slide ppt powerpoint presentation layouts guidelines pdf. bundle. Topics like receivable analysis, revenue and expense trends, payment status, partially received, received. can be discussed with this completely editable template. It is available for immediate download depending on the needs and requirements of the user.

Dashboards For Visualizing Performance Powerpoint Layout
This is a dashboards for visualizing performance powerpoint layout. This is a four stage process. The stages in this process are tra score, view ability, ad fraud, brand safety, industry snapshot.
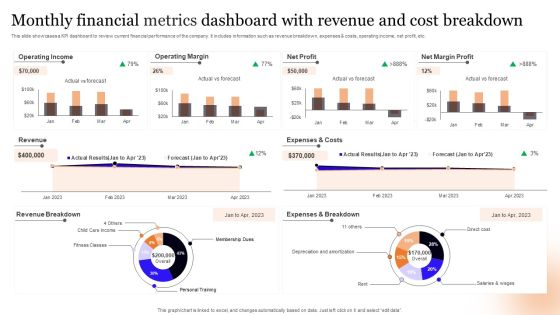
Monthly Financial Metrics Dashboard With Revenue And Cost Breakdown Information PDF
This slide showcases a KPI dashboard to review current financial performance of the company. It includes information such as revenue breakdown, expenses and costs, operating income, net profit, etc. Pitch your topic with ease and precision using this Monthly Financial Metrics Dashboard With Revenue And Cost Breakdown Information PDF. This layout presents information on Operating Income, Operating Margin, Net Profit. It is also available for immediate download and adjustment. So, changes can be made in the color, design, graphics or any other component to create a unique layout.

Financial KPI Dashboard With Liquidity Ratio Analysis And Current Assets Breakdown Ideas PDF
This showcases KPI dashboard the can help organization to evaluate the financial performance and analyze the liquidity ratios. Its key components are vendor payment error rate, budget variance and cash conversion cycle. Showcasing this set of slides titled. The topics addressed in these templates are Quick Status, Workning Capital, Budget Variance. All the content presented in this PPT design is completely editable. Download it and make adjustments in color, background, font etc. as per your unique business setting.

Business Profile Of It Company With Financial Performance Icon Ppt PowerPoint Presentation Infographic Template Smartart PDF
Presenting business profile of it company with financial performance icon ppt powerpoint presentation infographic template smartart pdf to provide visual cues and insights. Share and navigate important information on three stages that need your due attention. This template can be used to pitch topics like business profile of it company with financial performance icon. In addtion, this PPT design contains high resolution images, graphics, etc, that are easily editable and available for immediate download.
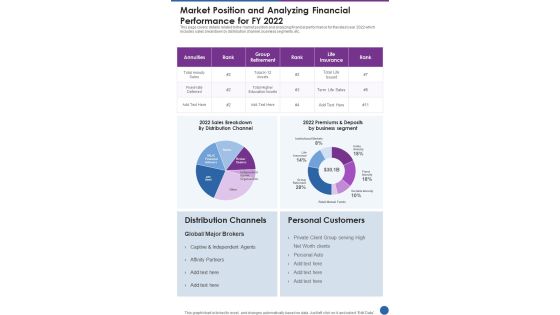
Market Position And Analyzing Financial Performance For FY 2022 One Pager Documents
This page covers details related to the market position and analyzing financial performance for the latest year 2022 which includes sales breakdown by distribution channel, business segments, etc. Presenting you an exemplary Market Position And Analyzing Financial Performance For FY 2022 One Pager Documents. Our one-pager comprises all the must-have essentials of an inclusive document. You can edit it with ease, as its layout is completely editable. With such freedom, you can tweak its design and other elements to your requirements. Download this Market Position And Analyzing Financial Performance For FY 2022 One Pager Documents brilliant piece now.
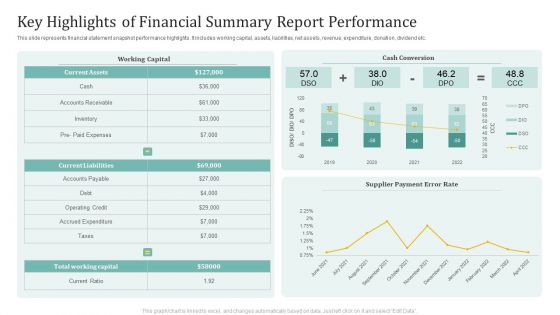
Key Highlights Of Financial Summary Report Performance Ppt Outline Slides PDF
This slide represents financial statement snapshot performance highlights. It includes working capital, assets, liabilities, net assets, revenue, expenditure, donation, dividend etc. Showcasing this set of slides titled Key Highlights Of Financial Summary Report Performance Ppt Outline Slides PDF. The topics addressed in these templates are Working Capital, Cash Conversion, Supplier Payment, Error Rate. All the content presented in this PPT design is completely editable. Download it and make adjustments in color, background, font etc. as per your unique business setting.

Hospital Administration Financial Performance Key Trends Ppt Inspiration Clipart Images PDF
Deliver an awe inspiring pitch with this creative hospital administration financial performance key trends ppt inspiration clipart images pdf bundle. Topics like data analytics, avoid overbuilding, cybersecurity investment, value based payments, updating the financial leadership model can be discussed with this completely editable template. It is available for immediate download depending on the needs and requirements of the user.

Financial Performance Measures Ppt PowerPoint Presentation Infographic Template File Formats Cpb
Presenting this set of slides with name financial performance measures ppt powerpoint presentation infographic template file formats cpb. This is an editable Powerpoint seven stages graphic that deals with topics like financial performance measures to help convey your message better graphically. This product is a premium product available for immediate download and is 100 percent editable in Powerpoint. Download this now and use it in your presentations to impress your audience.
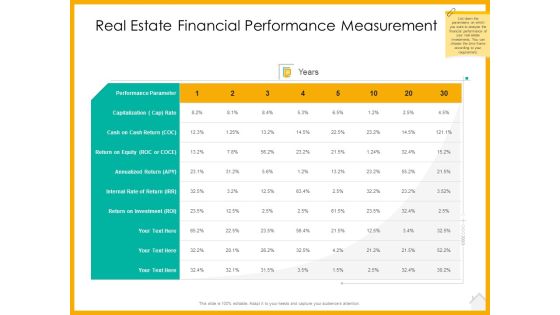
Real Estate Property Management System Real Estate Financial Performance Measurement Ppt Infographic Template Pictures PDF
Deliver an awe inspiring pitch with this creative real estate property management system real estate financial performance measurement ppt infographic template pictures pdf bundle. Topics like performance parameter, capitalization, return on investment, cash on cash return can be discussed with this completely editable template. It is available for immediate download depending on the needs and requirements of the user.

Selling Home Property Real Estate Financial Performance Measurement Ppt Infographics Themes PDF
Deliver and pitch your topic in the best possible manner with this selling home property real estate financial performance measurement ppt infographics themes pdf. Use them to share invaluable insights on performance, equity, investment, cash return and impress your audience. This template can be altered and modified as per your expectations. So, grab it now.
 Home
Home