Financial Performance Dashboard

Sales Performance Dashboard Top Opportunities Ppt PowerPoint Presentation Layouts Template
This is a sales performance dashboard top opportunities ppt powerpoint presentation layouts template. This is a eight stage process. The stages in this process are revenue, new customer, gross profit, customer satisfaction, brand profitability.
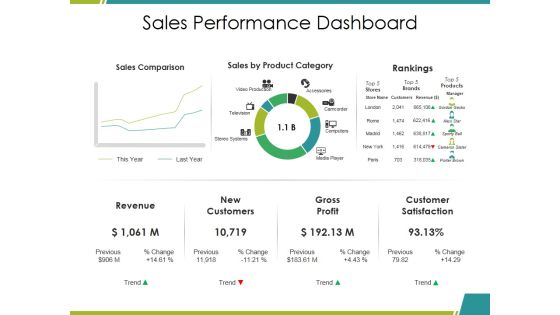
Sales Performance Dashboard Ppt PowerPoint Presentation Infographics Mockup
This is a sales performance dashboard ppt powerpoint presentation infographics mockup. This is a three stage process. The stages in this process are sales comparison, sales by product category, rankings, revenue, gross profit.

Sales Performance Dashboard Ppt PowerPoint Presentation Outline File Formats
This is a sales performance dashboard ppt powerpoint presentation outline file formats. This is a three stage process. The stages in this process are revenue, new customers, gross profit, customer satisfaction, rankings.
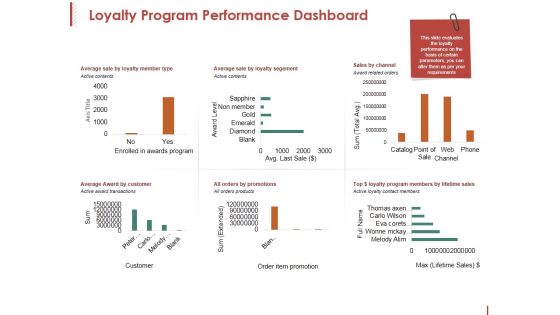
Loyalty Program Performance Dashboard Ppt PowerPoint Presentation Pictures Clipart
This is a loyalty program performance dashboard ppt powerpoint presentation pictures clipart. This is a six stage process. The stages in this process are axis title, award level, sum, active contents, channel.

Sales Performance Dashboard Ppt PowerPoint Presentation Ideas Portfolio
This is a sales performance dashboard ppt powerpoint presentation ideas portfolio. This is a three stage process. The stages in this process are revenue, new customers, gross profit, customer satisfaction, sales comparison.
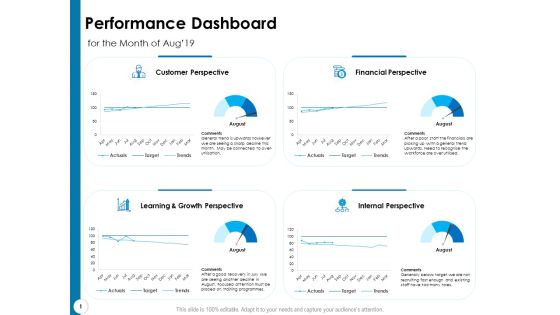
Strategy Execution Balanced Scorecard Performance Dashboard Elements PDF
Presenting this set of slides with name strategy execution balanced scorecard performance dashboard elements pdf. The topics discussed in these slides are customer perspective, financial perspective, internal perspective, learning and growth perspective. This is a completely editable PowerPoint presentation and is available for immediate download. Download now and impress your audience.

Performance Dashboard Template 2 Ppt PowerPoint Presentation Model Format
This is a performance dashboard template 2 ppt powerpoint presentation model format. This is a four stage process. The stages in this process are dashboard, finance, business, marketing.

Brand Performance Dashboard Template 2 Ppt PowerPoint Presentation Gallery
This is a brand performance dashboard template 2 ppt powerpoint presentation gallery. This is a two stage process. The stages in this process are business, finance, performance, location, strategy, success.
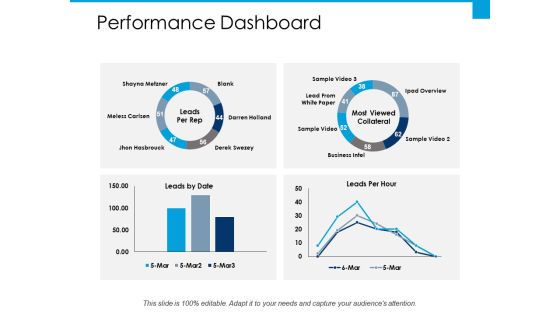
Performance Dashboard Ppt PowerPoint Presentation File Design Templates
This is a performance dashboard ppt powerpoint presentation file design templates. This is a four stage process. The stages in this process are percentage, product, management, marketing, business.
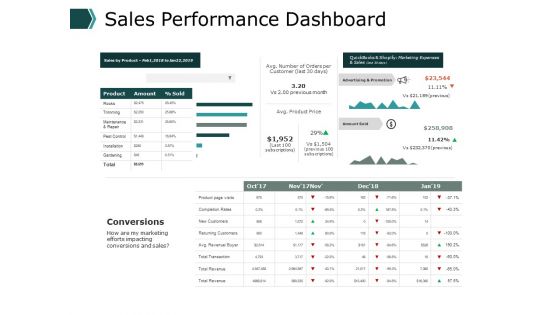
Sales Performance Dashboard Ppt PowerPoint Presentation Gallery Outline
This is a sales performance dashboard ppt powerpoint presentation gallery outline. This is a three stage process. The stages in this process are finance, marketing, management, investment, analysis.
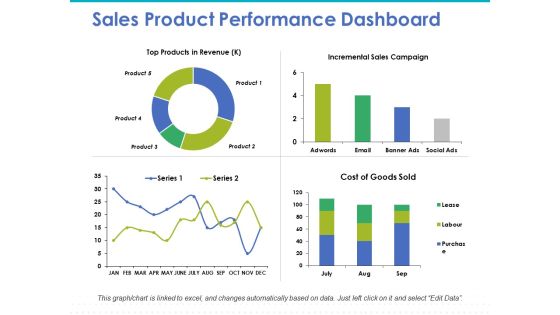
Sales Product Performance Dashboard Ppt PowerPoint Presentation Model Graphics Design
This is a sales product performance dashboard ppt powerpoint presentation model graphics design. This is a four stage process. The stages in this process are top products in revenue, incremental sales, cost of goods.
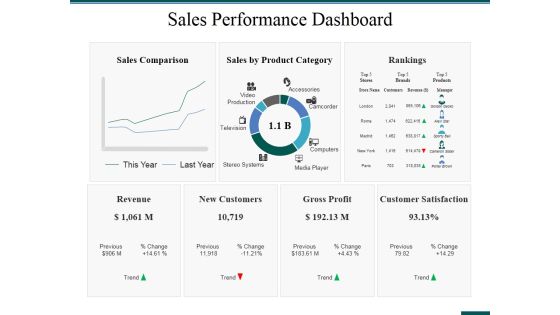
Sales Performance Dashboard Ppt PowerPoint Presentation Ideas Format Ideas
This is a sales performance dashboard ppt powerpoint presentation ideas format ideas. This is a three stage process. The stages in this process are rankings, revenue, new customers, gross profit, customer satisfaction.
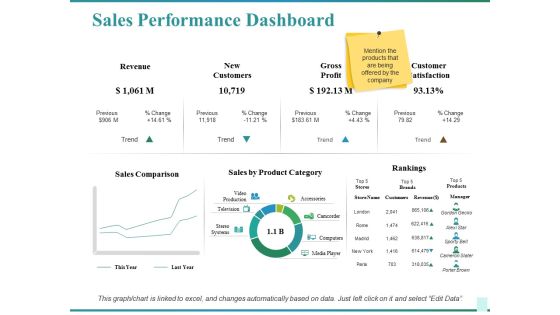
Sales Performance Dashboard Ppt PowerPoint Presentation Show Graphics Design
This is a sales performance dashboard ppt powerpoint presentation show graphics design. This is a two stage process. The stages in this process are sales comparison, sales by product category, rankings, customer satisfaction, revenue.

Sales Performance Dashboard Template Ppt PowerPoint Presentation Professional Elements
This is a sales performance dashboard template ppt powerpoint presentation professional elements. This is a eight stage process. The stages in this process are sales comparison, sales by product category, sales by month, brand profitability, revenue.

Company Sales And Performance Dashboard Ppt PowerPoint Presentation Show Structure
This is a company sales and performance dashboard ppt powerpoint presentation show structure. This is a four stage process. The stages in this process are year product sales, month growth in revenue, profit margins graph, year profits.

Brand Performance Dashboard Template 2 Ppt PowerPoint Presentation Template
This is a brand performance dashboard template 2 ppt powerpoint presentation template. This is a five stage process. The stages in this process are marketing, business, social, icons, management.
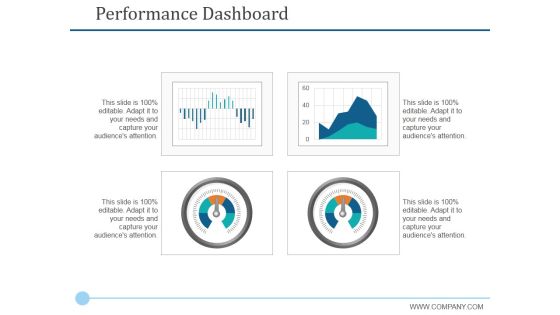
Performance Dashboard Template 2 Ppt PowerPoint Presentation Styles Graphics Tutorials
This is a performance dashboard template 2 ppt powerpoint presentation styles graphics tutorials. This is a four stage process. The stages in this process are finance, business, marketing, management.
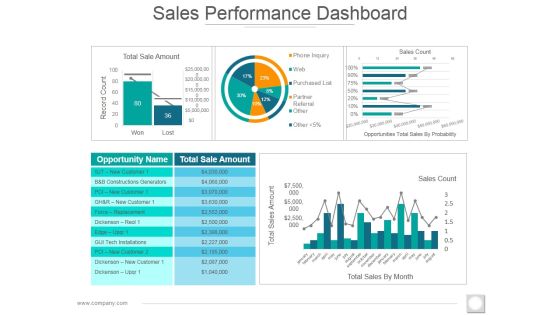
Sales Performance Dashboard Ppt PowerPoint Presentation Styles Images
This is a sales performance dashboard ppt powerpoint presentation styles images. This is a five stage process. The stages in this process are total sale amount, record count, sales count, total sales amount, total sales by month.

Change Management Performance Dashboard Ppt PowerPoint Presentation Layouts Master Slide
This is a change management performance dashboard ppt powerpoint presentation layouts master slide. This is a three stage process. The stages in this process are critical, high, low, medium, none.

Change Management Performance Dashboard Ppt PowerPoint Presentation Summary Background Image
This is a change management performance dashboard ppt powerpoint presentation summary background image. This is a three stage process. The stages in this process are high risk changes, average change, implementation time, emergency changes, average cost per change, change rejected.
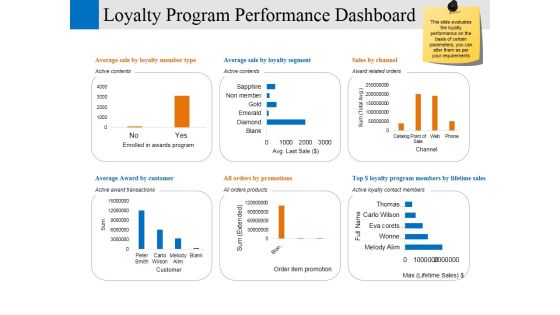
Loyalty Program Performance Dashboard Ppt PowerPoint Presentation Professional Model
This is a loyalty program performance dashboard ppt powerpoint presentation professional model. This is a six stage process. The stages in this process are enrolled in awards program, customer, order item promotion, channel, business.

Sales Performance Dashboard Template Ppt PowerPoint Presentation Slides Example File
This is a sales performance dashboard template ppt powerpoint presentation slides example file. This is a eight stage process. The stages in this process are business, marketing, strategy, finance, planning.
Sales Performance Dashboard Ppt PowerPoint Presentation Professional Icons
This is a sales performance dashboard template ppt powerpoint presentation slides example file. This is a six stage process. The stages in this process are business, marketing, strategy, finance, planning.

Change Management Performance Dashboard Ppt PowerPoint Presentation Professional Slides
This is a change management performance dashboard ppt powerpoint presentation professional slides. This is a three stage process. The stages in this process are finance, marketing, management, investment, analysis.
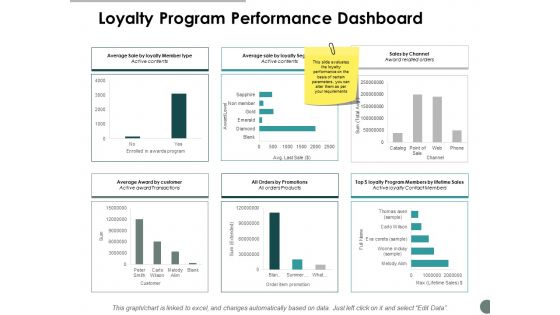
Loyalty Program Performance Dashboard Ppt Powerpoint Presentation Professional Templates
This is a loyalty program performance dashboard ppt powerpoint presentation professional templates. This is a six stage process. The stages in this process are finance, marketing, management, investment, analysis.
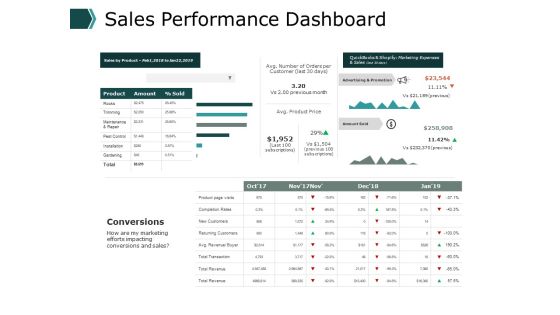
Sales Performance Dashboard Business Ppt PowerPoint Presentation Pictures Visuals
This is a sales performance dashboard business ppt powerpoint presentation pictures visuals . This is a three stage process. The stages in this process are finance, marketing, management, investment, analysis.

Loyalty Program Performance Dashboard Ppt Powerpoint Presentation Gallery Inspiration
This is a loyalty program performance dashboard ppt powerpoint presentation gallery inspiration. This is a six stage process. The stages in this process are finance, marketing, analysis, investment, strategy.

Performance Analysis Dashboard Icon For Email Communication Kpis Introduction PDF
Persuade your audience using this Performance Analysis Dashboard Icon For Email Communication Kpis Introduction PDF. This PPT design covers four stages, thus making it a great tool to use. It also caters to a variety of topics including Performance Analysis, Dashboard Icon, Email Communication, Kpis. Download this PPT design now to present a convincing pitch that not only emphasizes the topic but also showcases your presentation skills.

Loyalty Program Performance Dashboard Ppt PowerPoint Presentation Summary Grid
This is a loyalty program performance dashboard ppt powerpoint presentation summary grid. This is a six stage process. The stages in this process are average sale by loyalty member type, average award by customer, all orders by promotions, average sale by loyalty segment, sales by channel.
Sales Product Performance Dashboard Ppt PowerPoint Presentation Summary Icon
This is a sales product performance dashboard ppt powerpoint presentation infographics samples. This is a four stage process. The stages in this process are top products in revenue, incremental sales campaign, sales product performance, cost of goods sold.
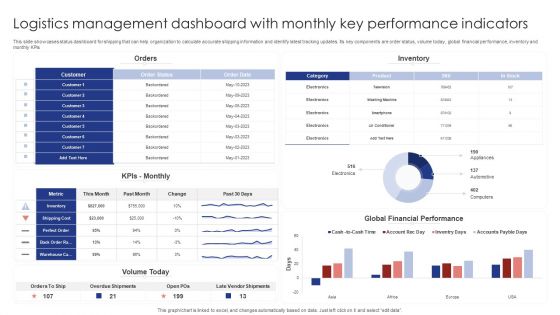
Logistics Management Dashboard With Monthly Key Performance Indicators Rules PDF
This slide showcases status dashboard for shipping that can help organization to calculate accurate shipping information and identify latest tracking updates. Its key components are order status, volume today, global financial performance, inventory and monthly KPIs. Pitch your topic with ease and precision using this Logistics Management Dashboard With Monthly Key Performance Indicators Rules PDF. This layout presents information on Orders, Inventory, Kpis Monthly. It is also available for immediate download and adjustment. So, changes can be made in the color, design, graphics or any other component to create a unique layout.

Co Variety Advertisement Partners Performance Assessment Dashboard Introduction PDF
This slide provides information regarding the dashboard for partners performance assessment in terms of revenue generated, etc. Presenting co variety advertisement partners performance assessment dashboard introduction pdf to provide visual cues and insights. Share and navigate important information on three stages that need your due attention. This template can be used to pitch topics like revenue generated, marketing progress, plan. In addition, this PPT design contains high-resolution images, graphics, etc, that are easily editable and available for immediate download.

Partners Performance Assessment Dashboard Ppt Infographic Template Elements PDF
This slide provides information regarding the dashboard for partners performance assessment in terms of revenue generated, etc. Deliver an awe-inspiring pitch with this creative partners performance assessment dashboard ppt infographic template elements pdf bundle. Topics like partners performance assessment dashboard can be discussed with this completely editable template. It is available for immediate download depending on the needs and requirements of the user.

Company Performance Dashboard With Quarterly Revenue Download PDF
This slide showcases the quarterly organizational performance dashboard. It include campaign performance, acquisitions by campaign and sales performance. Showcasing this set of slides titled company performance dashboard with quarterly revenue download pdf. The topics addressed in these templates are marketing, performance. All the content presented in this PPT design is completely editable. Download it and make adjustments in color, background, font etc. as per your unique business setting.

Annual Sales Team Performance And Collaboration Dashboard Themes PDF
This slide signifies the dashboard on sales team performance and coordination. It includes total revenue generated, employee performance pie chart, Products sold and income by customer location Showcasing this set of slides titled Annual Sales Team Performance And Collaboration Dashboard Themes PDF The topics addressed in these templates are Annual Sales, Team Performance, Collaboration Dashboard All the content presented in this PPT design is completely editable. Download it and make adjustments in color, background, font etc. as per your unique business setting.

B2B Sales Representatives Performance Tracking Dashboard Elements PDF
This slide provides information regarding B2B sales representatives performance tracking dashboard to measure leads by region, revenue breakdown, top performers by leads, revenues, etc. Deliver an awe inspiring pitch with this creative B2B Sales Representatives Performance Tracking Dashboard Elements PDF bundle. Topics like Revenue Actual, Sales Representatives Performance, Tracking Dashboard can be discussed with this completely editable template. It is available for immediate download depending on the needs and requirements of the user.

B2B Sales Representatives Performance Tracking Dashboard Pictures PDF
This slide provides information regarding B2B sales representatives performance tracking dashboard to measure leads by region, revenue breakdown, top performers by leads, revenues, etc. Deliver and pitch your topic in the best possible manner with this b2b sales representatives performance tracking dashboard pictures pdf Use them to share invaluable insights on b2b prospects performance measurement dashboard and impress your audience. This template can be altered and modified as per your expectations. So, grab it now.

Sales Strategy Performance Dashboard With Revenue And Target Designs PDF
This slide shows a Sales Strategy Performance Dashboard with variables such as new customers acquired, revenue generated, revenue vs target comparison etc. Deliver and pitch your topic in the best possible manner with this sales strategy performance dashboard with revenue and target designs pdf. Use them to share invaluable insights on sales strategy performance dashboard with revenue and target and impress your audience. This template can be altered and modified as per your expectations. So, grab it now.

Brand Development Manual Business Performance KPI Dashboard Background PDF
Following slide covers business performance dashboard of the firm. It include KPIs such as average weekly sales revenue, above sales target, sales revenue and profit generated.Deliver an awe inspiring pitch with this creative Brand Development Manual Business Performance KPI Dashboard Background PDF bundle. Topics like Business Performance KPI Dashboard can be discussed with this completely editable template. It is available for immediate download depending on the needs and requirements of the user.

Graphical Representation Of Research IT Sales Performance Dashboard Sample PDF
This slide depicts the dashboard for sales performance after the implementation of visualization research based on revenue, quantity, regional sales. Deliver and pitch your topic in the best possible manner with this graphical representation of research it sales performance dashboard sample pdf. Use them to share invaluable insights on sales performance dashboard after visualization research implementation and impress your audience. This template can be altered and modified as per your expectations. So, grab it now.

B2B Sales Representatives Performance Tracking Dashboard Background PDF
This slide provides information regarding B2B sales representatives performance tracking dashboard to measure leads by region, revenue breakdown, top performers by leads, revenues, etc. Deliver and pitch your topic in the best possible manner with this B2B Sales Representatives Performance Tracking Dashboard Background PDF. Use them to share invaluable insights on Individual Performance, Achieved Highest, Revenue Relative and impress your audience. This template can be altered and modified as per your expectations. So, grab it now.
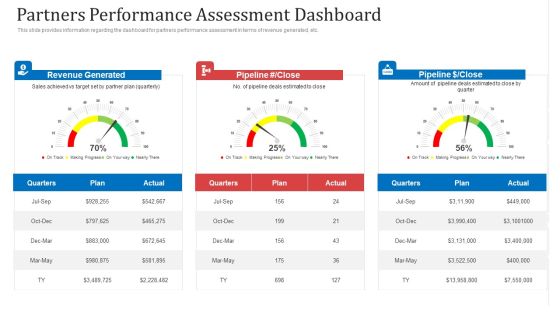
Partners Performance Assessment Dashboard Ppt File Format PDF
This slide provides information regarding the dashboard for partners performance assessment in terms of revenue generated, etc. Deliver an awe inspiring pitch with this creative partners performance assessment dashboard ppt file format pdf bundle. Topics like revenue generated, plan, sales can be discussed with this completely editable template. It is available for immediate download depending on the needs and requirements of the user.
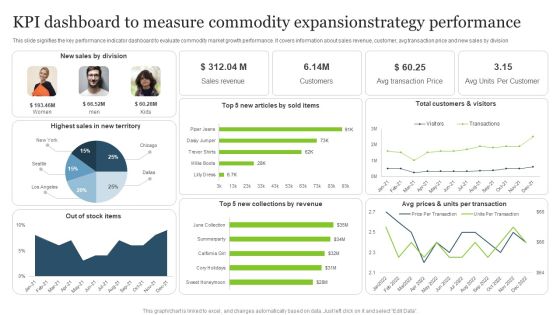
KPI Dashboard To Measure Commodity Expansionstrategy Performance Mockup PDF
This slide signifies the key performance indicator dashboard to evaluate commodity market growth performance. It covers information about sales revenue, customer, avg transaction price and new sales by division.Showcasing this set of slides titled KPI Dashboard To Measure Commodity Expansionstrategy Performance Mockup PDF. The topics addressed in these templates are Highest Sales, Sales Division, New Collections. All the content presented in this PPT design is completely editable. Download it and make adjustments in color, background, font etc. as per your unique business setting.

Campaign Sessions And Conversion Performance Dashboard Ppt Inspiration Styles PDF
Following slide illustrates campaign session and conversion performance dashboard. It covers details such as revenues, cost per click, transactions, impressions, sessions and conversion performance. Deliver an awe-inspiring pitch with this creative campaign sessions and conversion performance dashboard ppt inspiration styles pdf. bundle. Topics like cost per click, transactions, impressions, sessions, revenue can be discussed with this completely editable template. It is available for immediate download depending on the needs and requirements of the user.
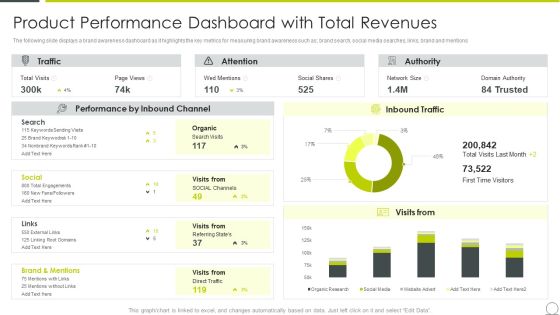
Examining Product Characteristics Brand Messaging Product Performance Dashboard Information PDF
The following slide displays a brand awareness dashboard as it highlights the key metrics for measuring brand awareness such as brand search, social media searches, links, brand and mentions Deliver an awe inspiring pitch with this creative examining product characteristics brand messaging product performance dashboard information pdf bundle. Topics like product performance dashboard with total revenues can be discussed with this completely editable template. It is available for immediate download depending on the needs and requirements of the user.

Dashboard For Tracking Direct Mail Advertising Campaign Performance Inspiration PDF
This slide represents dashboard showcasing direct mail marketing campaign performance progress. It provides information regarding click through rate, campaign performance, web conversions, total revenue etc. Showcasing this set of slides titled Dashboard For Tracking Direct Mail Advertising Campaign Performance Inspiration PDF. The topics addressed in these templates are Product Delivery Rate, Deliverables, App Uninstalls. All the content presented in this PPT design is completely editable. Download it and make adjustments in color, background, font etc. as per your unique business setting.

Dashboard For Web Development Project Performance Microsoft PDF
This slide depicts the dashboard for the web development, and it covers the details of yearly turnover, clients information, and revenues, analytics, and statistics of the organization.Deliver an awe inspiring pitch with this creative Dashboard For Web Development Project Performance Microsoft PDF bundle. Topics like Dashboard For Web Development Project Performance can be discussed with this completely editable template. It is available for immediate download depending on the needs and requirements of the user.

KPI Dashboard To Measure Strategic Monetary Performance Graphics PDF
This slide shows KPI dashboard to measure strategic monetary performance. It includes gross profit margin, opex ratio, operating profit margin, revenue, etc. Pitch your topic with ease and precision using this KPI Dashboard To Measure Strategic Monetary Performance Graphics PDF. This layout presents information on Gross Profit Margin, Opex Ratio, Operating Profit Margin. It is also available for immediate download and adjustment. So, changes can be made in the color, design, graphics or any other component to create a unique layout.
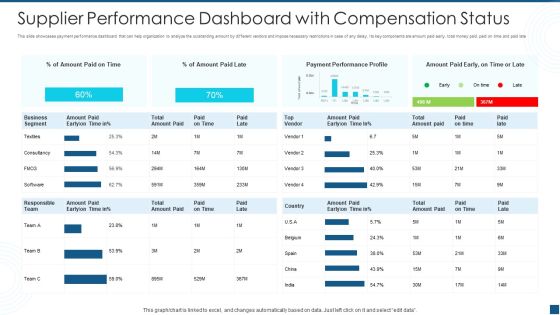
Supplier Performance Dashboard With Compensation Status Themes PDF
This slide showcases payment performance dashboard that can help organization to analyze the outstanding amount by different vendors and impose necessary restrictions in case of any delay. Its key components are amount paid early, total money paid, paid on time and paid late. Pitch your topic with ease and precision using this supplier performance dashboard with compensation status themes pdf. This layout presents information on supplier performance dashboard with compensation status. It is also available for immediate download and adjustment. So, changes can be made in the color, design, graphics or any other component to create a unique layout.
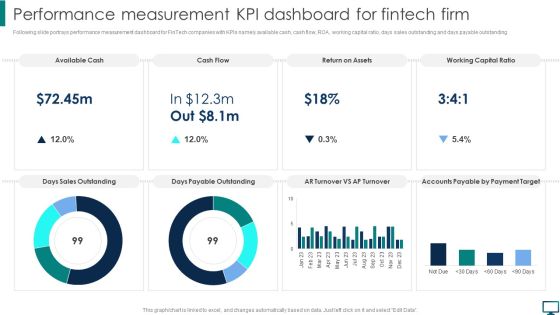
Performance Measurement KPI Dashboard For Fintech Firm Topics PDF
Following slide portrays performance measurement dashboard for FinTech companies with KPIs namely available cash, cash flow, ROA, working capital ratio, days sales outstanding and days payable outstanding. Create an editable Performance Measurement KPI Dashboard For Fintech Firm Topics PDF that communicates your idea and engages your audience. Whether you are presenting a business or an educational presentation, pre designed presentation templates help save time. Performance Measurement KPI Dashboard For Fintech Firm Topics PDF is highly customizable and very easy to edit, covering many different styles from creative to business presentations. Slidegeeks has creative team members who have crafted amazing templates. So, go and get them without any delay.
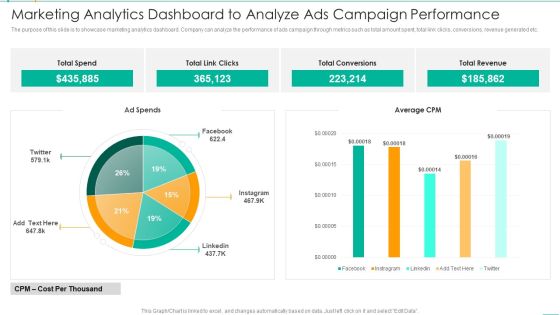
Marketing Analytics Dashboard To Analyze Ads Campaign Performance Microsoft PDF
The purpose of this slide is to showcase marketing analytics dashboard. Company can analyze the performance of ads campaign through metrics such as total amount spent, total link clicks, conversions, revenue generated etc. Showcasing this set of slides titled Marketing Analytics Dashboard To Analyze Ads Campaign Performance Microsoft PDF. The topics addressed in these templates are Marketing Analytics Dashboard To Analyze Ads Campaign Performance. All the content presented in this PPT design is completely editable. Download it and make adjustments in color, background, font etc. as per your unique business setting.
Product Management Team Performance Tracking KPI Dashboard Pictures PDF
This slide provides performance tracking dashboard for product development project team. It provides information regarding hours spent on project, deadlines, employee responsible, new leads and revenue generated. Pitch your topic with ease and precision using this Product Management Team Performance Tracking KPI Dashboard Pictures PDF. This layout presents information on Tracking KPI Dashboard, Product Management Team Performance. It is also available for immediate download and adjustment. So, changes can be made in the color, design, graphics or any other component to create a unique layout.
Optimize Brand Valuation Product Branding Performance Tracking Dashboard Background PDF
This slide provides information regarding product branding performance tracking dashboard in terms of revenues, new customers, customer satisfaction rate. Create an editable Optimize Brand Valuation Product Branding Performance Tracking Dashboard Background PDF that communicates your idea and engages your audience. Whether you are presenting a business or an educational presentation, pre-designed presentation templates help save time. Optimize Brand Valuation Product Branding Performance Tracking Dashboard Background PDF is highly customizable and very easy to edit, covering many different styles from creative to business presentations. Slidegeeks has creative team members who have crafted amazing templates. So, go and get them without any delay.

Consumption Based Pricing Model Business Performance Dashboard Demonstration PDF
The following slide display a business performance dashboard that highlights the average revenue per unit, customer acquisition cost and profit earned. Crafting an eye catching presentation has never been more straightforward. Let your presentation shine with this tasteful yet straightforward Consumption Based Pricing Model Business Performance Dashboard Demonstration PDF template. It offers a minimalistic and classy look that is great for making a statement. The colors have been employed intelligently to add a bit of playfulness while still remaining professional. Construct the ideal Consumption Based Pricing Model Business Performance Dashboard Demonstration PDF that effortlessly grabs the attention of your audience. Begin now and be certain to wow your customers.
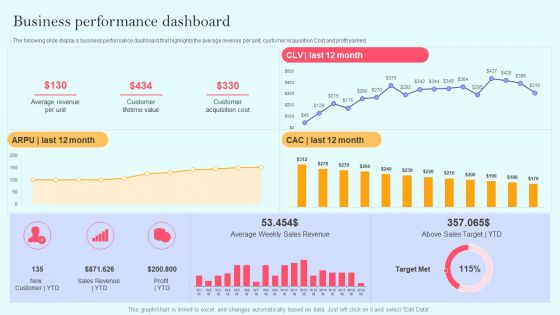
Recurring Income Generation Model Business Performance Dashboard Clipart PDF
The following slide display a business performance dashboard that highlights the average revenue per unit, customer Acquisition Cost and profit earned. Crafting an eye catching presentation has never been more straightforward. Let your presentation shine with this tasteful yet straightforward Recurring Income Generation Model Business Performance Dashboard Clipart PDF template. It offers a minimalistic and classy look that is great for making a statement. The colors have been employed intelligently to add a bit of playfulness while still remaining professional. Construct the ideal Recurring Income Generation Model Business Performance Dashboard Clipart PDF that effortlessly grabs the attention of your audience. Begin now and be certain to wow your customers.

Manufactured Products Sales Performance Monitoring Dashboard Information PDF
This slide shows the dashboard the data related to the sales performance of the products manufactured by the organization in order to effectively measure and monitor the performance of the sales team. It shows details related to revenue generated and units sold etc.Pitch your topic with ease and precision using this Manufactured Products Sales Performance Monitoring Dashboard Information PDF. This layout presents information on Monthly Revenue, Manufactured Products, Sales Performance Monitoring. It is also available for immediate download and adjustment. So, changes can be made in the color, design, graphics or any other component to create a unique layout.
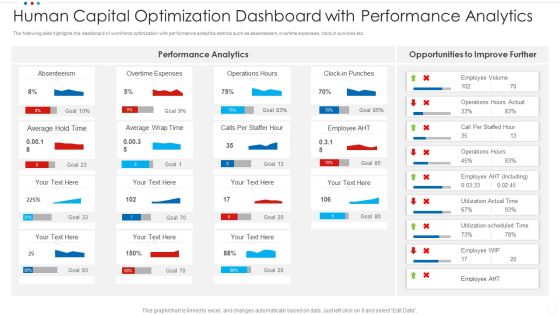
Human Capital Optimization Dashboard With Performance Analytics Infographics PDF
The following slide highlights the dashboard of workforce optimization with performance analytics metrics such as absenteeism, overtime expenses, clock in punches etc. Showcasing this set of slides titled human capital optimization dashboard with performance analytics infographics pdf. The topics addressed in these templates are average, overtime expenses, absenteeism. All the content presented in this PPT design is completely editable. Download it and make adjustments in color, background, font etc. as per your unique business setting.

Membership Based Revenue Plan Business Performance Dashboard Ideas PDF
The following slide display a business performance dashboard that highlights the average revenue per unit, customer Acquisition Cost and profit earned. There are so many reasons you need a Membership Based Revenue Plan Business Performance Dashboard Ideas PDF. The first reason is you cant spend time making everything from scratch, Thus, Slidegeeks has made presentation templates for you too. You can easily download these templates from our website easily.

Capital Investment Options Project Team Performance Kpi Dashboard Topics PDF
This slide shows a KPI dashboard to monitor project team performance. KPIs covered are task, billable hours, billable cost, days lapsed, milestones achieved. Deliver and pitch your topic in the best possible manner with this Capital Investment Options Project Team Performance Kpi Dashboard Topics PDF. Use them to share invaluable insights on Team Members, Project Manager, Employee and impress your audience. This template can be altered and modified as per your expectations. So, grab it now.
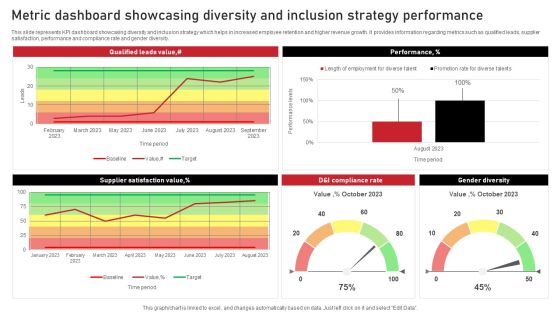
Metric Dashboard Showcasing Diversity And Inclusion Strategy Performance Background PDF
This slide represents KPI dashboard showcasing diversity and inclusion strategy which helps in increased employee retention and higher revenue growth. It provides information regarding metrics such as qualified leads, supplier satisfaction, performance and compliance rate and gender diversity. Showcasing this set of slides titled Metric Dashboard Showcasing Diversity And Inclusion Strategy Performance Background PDF. The topics addressed in these templates are Performance, Gender Diversity, Performance. All the content presented in this PPT design is completely editable. Download it and make adjustments in color, background, font etc. as per your unique business setting.
 Home
Home