Financial Performance Dashboard
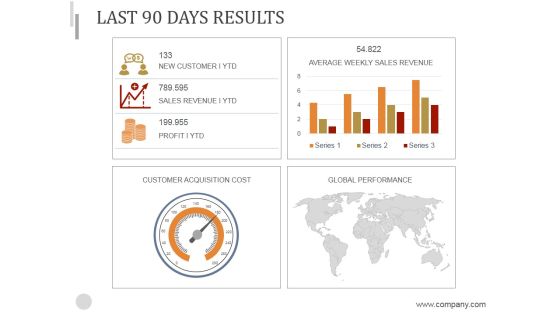
Last 90 Days Results Ppt PowerPoint Presentation Background Image
This is a last 90 days results ppt powerpoint presentation background image. This is a four stage process. The stages in this process are customer acquisition cost, global performance, average weekly sales revenue.
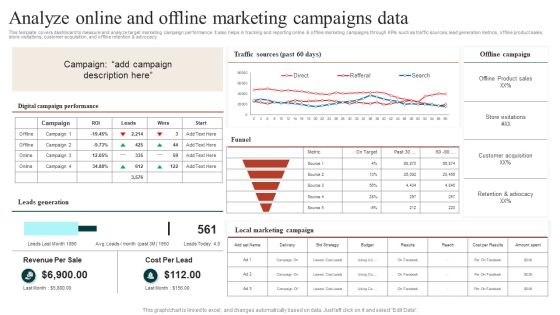
Target Marketing Techniques Analyze Online And Offline Marketing Campaigns Data Ideas PDF
This template covers dashboard to measure and analyze target marketing campaign performance. It also helps in tracking and reporting online and offline marketing campaigns through KPIs such as traffic sources, lead generation metrics, offline product sales, store visitations, customer acquisition, and offline retention and advocacy Find a pre designed and impeccable Target Marketing Techniques Evaluating Growth Rate For Target Marketing Slides PDF. The templates can ace your presentation without additional effort. You can download these easy to edit presentation templates to make your presentation stand out from others. So, what are you waiting for Download the template from Slidegeeks today and give a unique touch to your presentation.

Product Data Insights Analysis Sheet Infographics PDF
The following slide depicts the annual performance of multiple products in terms of profit or loss to track whether they are doing well or not. The analysis sheet includes element such as cost, units, selling price, sales etc. Pitch your topic with ease and precision using this Product Data Insights Analysis Sheet Infographics PDF. This layout presents information on Unit Sold, Selling Price, Total Sales. It is also available for immediate download and adjustment. So, changes can be made in the color, design, graphics or any other component to create a unique layout.

Feature Development Data Associated Activities Guidelines PDF
This slide exhibits survey of data scientists to understand feature engineering activities that helps to improve performance of machine learning business models. It includes activities such as data cleaning, organizing, collection, mining, refining algorithms etc. Pitch your topic with ease and precision using this Feature Development Data Associated Activities Guidelines PDF. This layout presents information on Programming, Developing Training Sets, Gathering Data Sets. It is also available for immediate download and adjustment. So, changes can be made in the color, design, graphics or any other component to create a unique layout.

Effectiveness Of Social Media Data Insights For Marketers Ideas PDF
The following slide depicts the effectiveness of social media insights for marketers. This data analysis helps them to formulate strategies, understand the target audience, evaluate campaign performance, assess ROI etc. Showcasing this set of slides titled Effectiveness Of Social Media Data Insights For Marketers Ideas PDF. The topics addressed in these templates are Effectiveness, Social Media, Marketers. All the content presented in this PPT design is completely editable. Download it and make adjustments in color, background, font etc. as per your unique business setting.

Last 90 Days Results Ppt PowerPoint Presentation Graphics
This is a last 90 days results ppt powerpoint presentation graphics. This is a five stage process. The stages in this process are new customer ytd, average weekly sales revenue, above sales target i ytd, customer acquisition cost, global performance.
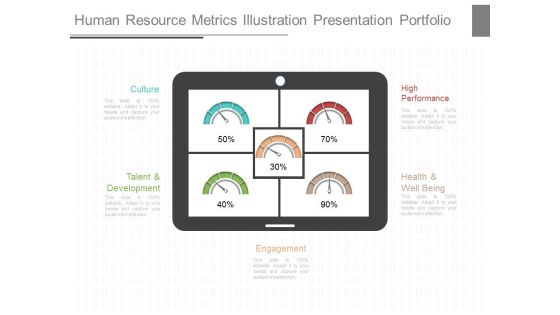
Human Resource Metrics Illustration Presentation Portfolio
This is a human resource metrics illustration presentation portfolio. This is a five stage process. The stages in this process are culture, high performance, talent and development, health and well being, engagement.
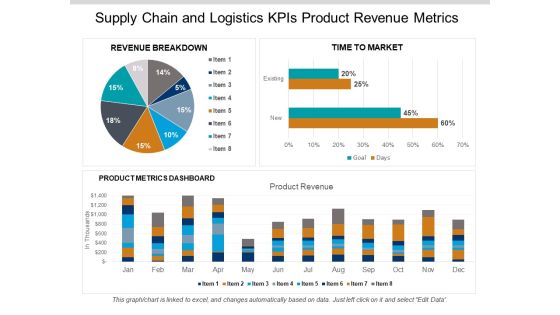
Supply Chain And Logistics Kpis Product Revenue Metrics Ppt PowerPoint Presentation Gallery Aids
This is a supply chain and logistics kpis product revenue metrics ppt powerpoint presentation gallery aids. This is a three stage process. The stages in this process are logistics performance, logistics dashboard, logistics kpis.
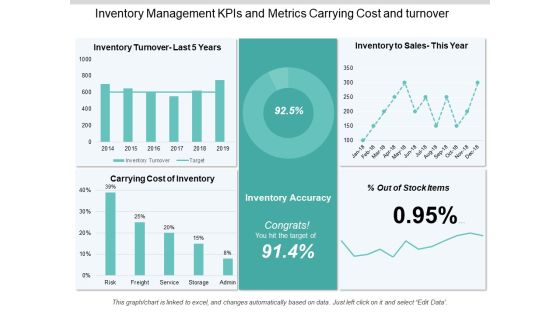
Inventory Management Kpis And Metrics Carrying Cost And Turnover Ppt PowerPoint Presentation Information
This is a inventory management kpis and metrics carrying cost and turnover ppt powerpoint presentation information. This is a five stage process. The stages in this process are logistics performance, logistics dashboard, logistics kpis.

Kpis In Shipping Perfect Order Rate And On Time Shipment Ppt PowerPoint Presentation Show Guide
This is a kpis in shipping perfect order rate and on time shipment ppt powerpoint presentation show guide. This is a six stage process. The stages in this process are logistics performance, logistics dashboard, logistics kpis.
Logistics Kpis And Metrics Percentage Of Orders Delivered Ppt PowerPoint Presentation Icon
This is a logistics kpis and metrics percentage of orders delivered ppt powerpoint presentation icon. This is a five stage process. The stages in this process are logistics performance, logistics dashboard, logistics kpis.

Two Weeks Schedule Showing Highlighting Business Tasks Ppt PowerPoint Presentation Pictures Background Designs PDF
Presenting this set of slides with name two weeks schedule showing highlighting business tasks ppt powerpoint presentation pictures background designs pdf. This is a two stage process. The stages in this process are announcement of financial statements, payment of dividends, financial performance review, monthly financial reporting, expense audit, ledger review, financial planning, budget optimization. This is a completely editable PowerPoint presentation and is available for immediate download. Download now and impress your audience.
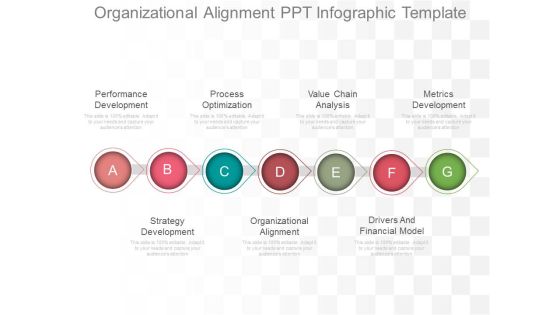
Organizational Alignment Ppt Infographic Template
This is a organizational alignment ppt infographic template. This is a seven stage process. The stages in this process are performance development, process optimization, value chain analysis, metrics development, strategy development, organizational alignment, drivers and financial model.

Advisors Investment Management Process Flow Diagram Ppt Example
This is a advisors investment management process flow diagram ppt example. This is a three stage process. The stages in this process are investment strategy, portfolio management, performance reporting, holistic financial plan.
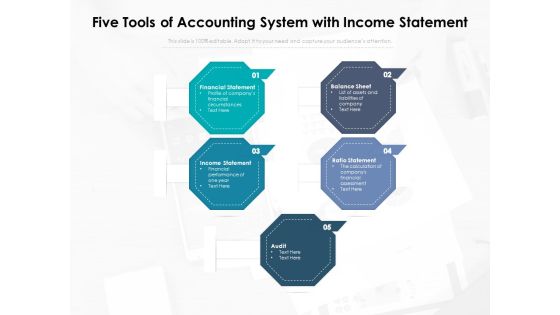
Five Tools Of Accounting System With Income Statement Ppt PowerPoint Presentation Infographic Template Rules PDF
Presenting this set of slides with name five tools of accounting system with income statement ppt powerpoint presentation infographic template rules pdf. This is a five stage process. The stages in this process are financial statement, profile of companys financial, circumstances, balance sheet, list of assets and liabilities of company, income statement, financial performance of one year, ratio statement, the calculation of companys financial assessment, audit. This is a completely editable PowerPoint presentation and is available for immediate download. Download now and impress your audience.
Energy Tracking Device Motivate Ppt PowerPoint Presentation Infographics Graphics Design PDF
Presenting energy tracking device motivate ppt powerpoint presentation infographics graphics design pdf to provide visual cues and insights. Share and navigate important information on six stages that need your due attention. This template can be used to pitch topics like internal competition, recognition, financial bonus and prizes, environmental responsibility, financial responsibility, performance standards. In addtion, this PPT design contains high-resolution images, graphics, etc, that are easily editable and available for immediate download.

Stakeholder Engagement Assessment For Project Management Services Graphics PDF
The following slide exhibits key metrics for evaluating service supply chain performance which can be used to track processes and fulfil company objectives.It covers assessment areas, criteria and performance metrics. Showcasing this set of slides titled Stakeholder Engagement Assessment For Project Management Services Graphics PDF. The topics addressed in these templates are Communications, Financial Administration, Employment. All the content presented in this PPT design is completely editable. Download it and make adjustments in color, background, font etc. as per your unique business setting.

Data Processing And Analysis Powerpoint Slides
This is a data processing and analysis powerpoint slides. This is a five stage process. The stages in this process are financial reporting and business excellence, competitive intelligence and strategy support, analysis and tool creation, planning and performance management support, data processing and analysis.
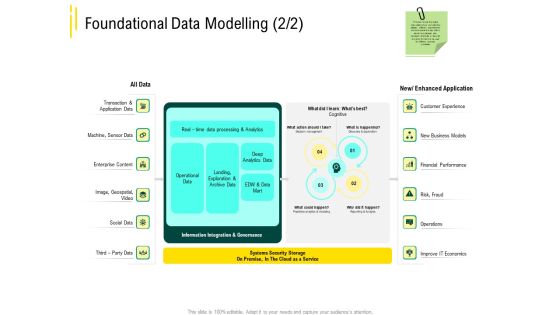
Expert Systems Foundational Data Modelling Analytics Diagrams PDF
Deliver an awe-inspiring pitch with this creative expert systems foundational data modelling analytics diagrams pdf bundle. Topics like socia, edw and data mart, operations, new business models, financial performance can be discussed with this completely editable template. It is available for immediate download depending on the needs and requirements of the user.
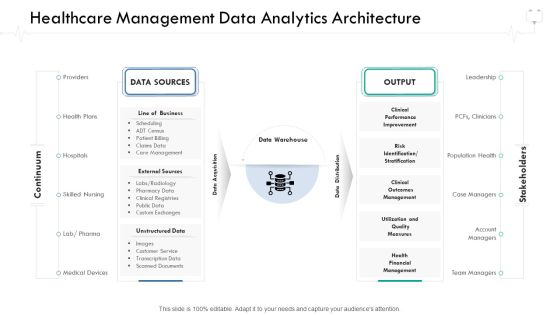
Wellness Management Healthcare Management Data Analytics Architecture Infographics PDF
Deliver an awe-inspiring pitch with this creative wellness management healthcare management data analytics architecture infographics pdf bundle. Topics like health financial management, risk identification or stratification, clinical performance improvement can be discussed with this completely editable template. It is available for immediate download depending on the needs and requirements of the user.
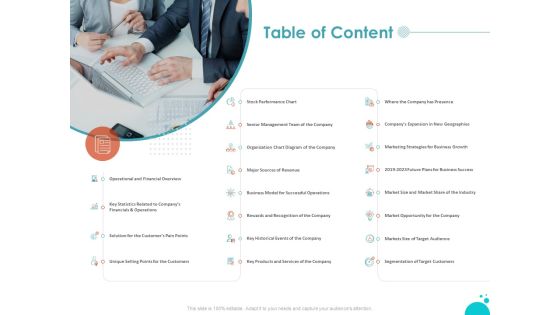
Investment Pitch For Aftermarket Table Of Content Ppt PowerPoint Presentation Infographics Graphic Tips PDF
Presenting this set of slides with name investment pitch for aftermarket table of content ppt powerpoint presentation infographics graphic tips pdf. This is a one stage process. The stages in this process are operational and financial overview, statistics related to companys financials and operations, solution customers pain points, key historical events company, stock performance chart, major sources revenue. This is a completely editable PowerPoint presentation and is available for immediate download. Download now and impress your audience.

Benefits Of Manpower Analytics For Enhancement In Employee Engagement Guidelines PDF
This slide covers various benefits of data analytics for engagement among workforce. It includes control over unconditional visibility, distributed rescheduling, optimal resource health and objective performance appraisals. Persuade your audience using this Benefits Of Manpower Analytics For Enhancement In Employee Engagement Guidelines PDF. This PPT design covers four stages, thus making it a great tool to use. It also caters to a variety of topics including Control Over, Unconditional Visibility, Distributed Rescheduling, Objective Performance Appraisals. Download this PPT design now to present a convincing pitch that not only emphasizes the topic but also showcases your presentation skills.
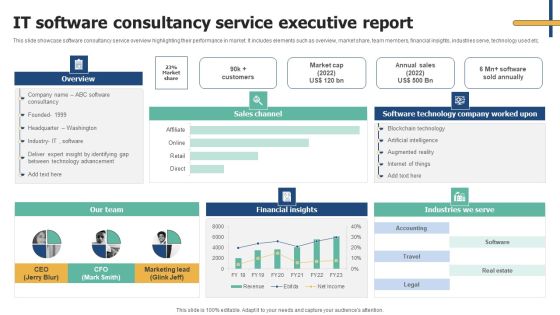
IT Software Consultancy Service Executive Report Structure PDF
This slide showcase software consultancy service overview highlighting their performance in market. It includes elements such as overview, market share, team members, financial insights, industries serve, technology used etc. Pitch your topic with ease and precision using this IT Software Consultancy Service Executive Report Structure PDF. This layout presents information on Financial Insights, Our Team, Industries We Serve. It is also available for immediate download and adjustment. So, changes can be made in the color, design, graphics or any other component to create a unique layout.
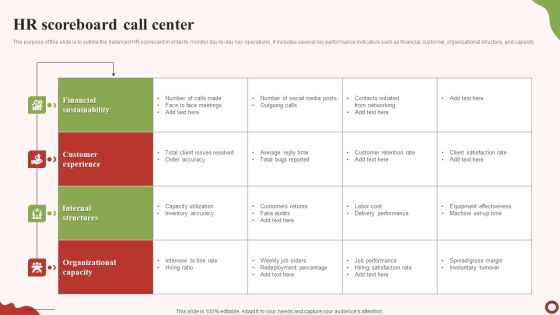
HR Scoreboard Call Center Template PDF
The purpose of this slide is to outline the balanced HR scorecard in order to monitor day-to-day key operations. It includes several key performance indicators such as financial, customer, organizational structure, and capacity. Showcasing this set of slides titled HR Scoreboard Call Center Template PDF. The topics addressed in these templates are Financial Sustainability, Customer Experience, Internal Structures. All the content presented in this PPT design is completely editable. Download it and make adjustments in color, background, font etc. as per your unique business setting.
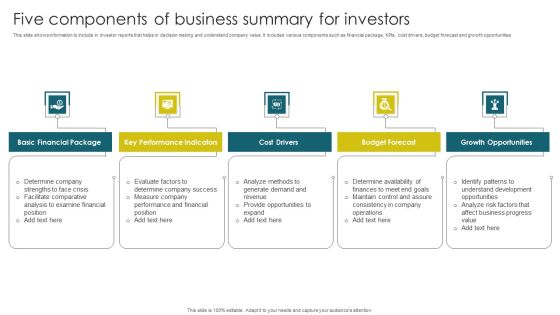
Five Components Of Business Summary For Investors Summary PDF
This slide shows information to include in investor reports that helps in decision making and understand company value. It includes various components such as financial package, KPIs, cost drivers, budget forecast and growth opportunities.Presenting Five Components Of Business Summary For Investors Summary PDF to dispense important information. This template comprises five stages. It also presents valuable insights into the topics including Financial Package, Performance Indicators, Budget Forecast. This is a completely customizable PowerPoint theme that can be put to use immediately. So, download it and address the topic impactfully.

Customer Satisfaction Template 1 Ppt PowerPoint Presentation Portfolio Graphics Example
This is a customer satisfaction template 1 ppt powerpoint presentation portfolio graphics example. This is a three stage process. The stages in this process are overall satisfaction with service, satisfaction with value for money, overall satisfaction with relationship, key performance indicators, business, percentage.

Big Data Analytics Procedure For Management Accounting Formats PDF
This slide illustrate big data analysis process for management accounting to generate financial reports for decision making. It includes elements such as cost accounting balance scorecards, performance measurement etc. Showcasing this set of slides titled Big Data Analytics Procedure For Management Accounting Formats PDF. The topics addressed in these templates are Accounting, Internal Data, Social Media. All the content presented in this PPT design is completely editable. Download it and make adjustments in color, background, font etc. as per your unique business setting.
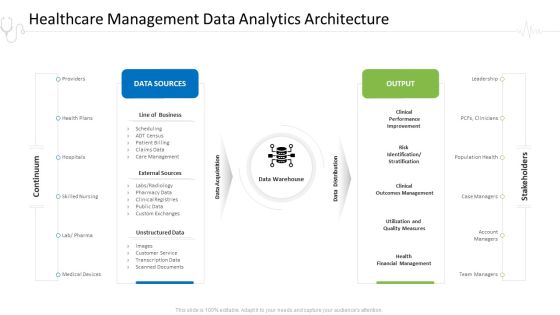
Hospital Administration Healthcare Management Data Analytics Architecture Ppt Infographics Information PDF
This is a hospital administration healthcare management data analytics architecture ppt infographics information pdf template with various stages. Focus and dispense information on two stages using this creative set, that comes with editable features. It contains large content boxes to add your information on topics like line of business, external sources, management, performance improvement, financial management. You can also showcase facts, figures, and other relevant content using this PPT layout. Grab it now.

Hospital Management Healthcare Management Data Analytics Architecture Ppt Model Tips PDF
This is a hospital management healthcare management data analytics architecture ppt model tips pdf template with various stages. Focus and dispense information on two stages using this creative set, that comes with editable features. It contains large content boxes to add your information on topics like line of business, external sources, management, performance improvement, financial management. You can also showcase facts, figures, and other relevant content using this PPT layout. Grab it now.

Health Centre Management Business Plan Healthcare Management Data Analytics Architecture Clipart PDF
This is a health centre management business plan healthcare management data analytics architecture clipart pdf template with various stages. Focus and dispense information on two stages using this creative set, that comes with editable features. It contains large content boxes to add your information on topics like line of business, external sources, management, performance improvement, financial management. You can also showcase facts, figures, and other relevant content using this PPT layout. Grab it now.
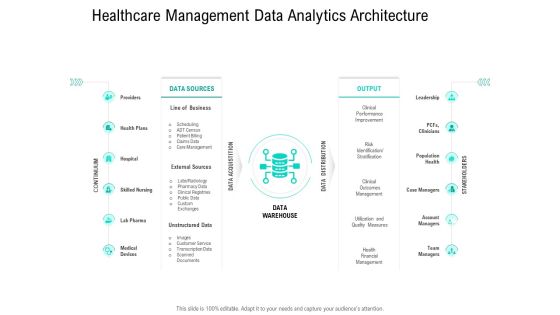
Nursing Administration Healthcare Management Data Analytics Architecture Ppt Visual Aids Pictures PDF
This is a nursing administration healthcare management data analytics architecture ppt visual aids pictures pdf template with various stages. Focus and dispense information on two stages using this creative set, that comes with editable features. It contains large content boxes to add your information on topics like line of business, external sources, management, performance improvement, financial management. You can also showcase facts, figures, and other relevant content using this PPT layout. Grab it now.
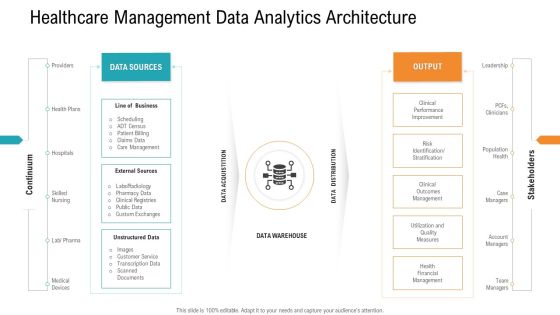
E Healthcare Management System Healthcare Management Data Analytics Architecture Portrait PDF
This is a e healthcare management system healthcare management data analytics architecture portrait pdf template with various stages. Focus and dispense information on two stages using this creative set, that comes with editable features. It contains large content boxes to add your information on topics like line of business, external sources, management, performance improvement, financial management. You can also showcase facts, figures, and other relevant content using this PPT layout. Grab it now.
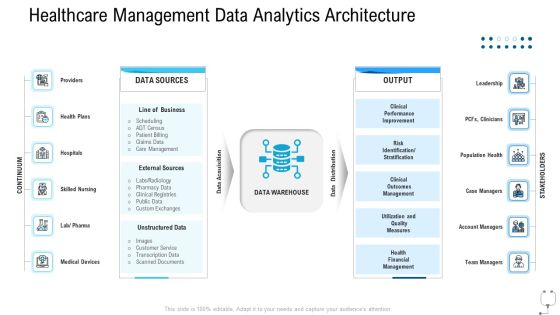
Healthcare Management Healthcare Management Data Analytics Architecture Ppt File Visuals PDF
This is a healthcare management healthcare management data analytics architecture ppt file visuals pdf template with various stages. Focus and dispense information on two stages using this creative set, that comes with editable features. It contains large content boxes to add your information on topics like line of business, external sources, management, performance improvement, financial management. You can also showcase facts, figures, and other relevant content using this PPT layout. Grab it now.
Pharmaceutical Management Healthcare Management Data Analytics Architecture Ppt Icon Picture PDF
This is a pharmaceutical management healthcare management data analytics architecture ppt icon picture pdf template with various stages. Focus and dispense information on two stages using this creative set, that comes with editable features. It contains large content boxes to add your information on topics like line of business, external sources, management, performance improvement, financial management. You can also showcase facts, figures, and other relevant content using this PPT layout. Grab it now.

Managers Scorecard Indicators For Finance Executives Topics PDF
This slide mentions financial key performance indicators used to formulate a balanced scorecard. It includes reducing operating costs, minimizing debts and efficient billing systems. Presenting Managers Scorecard Indicators For Finance Executives Topics PDF to dispense important information. This template comprises three stages. It also presents valuable insights into the topics including Executives, Managers, Finance. This is a completely customizable PowerPoint theme that can be put to use immediately. So, download it and address the topic impactfully.

Advantages And Disadvantages Of Balanced Scorecard Strategy Mapping Ppt PowerPoint Presentation Infographics Slideshow PDF
Presenting this set of slides with name advantages and disadvantages of balanced scorecard strategy mapping ppt powerpoint presentation infographics slideshow pdf. This is a two stage process. The stages in this process are benefits, better management information, improved performance reporting, increase customer focus, lack of well defined strategy, no focus on external factors and competitors, high financial cost investment, drawbacks. This is a completely editable PowerPoint presentation and is available for immediate download. Download now and impress your audience.

Table Of Contents For Debt Collection Improvement Plan Download PDF
This is a table of contents for debt collection improvement plan download pdf template with various stages. Focus and dispense information on one stages using this creative set, that comes with editable features. It contains large content boxes to add your information on topics like detailed financial analysis, balance sheet overview organization, our key performance indicators balance sheet, understanding our cash flow statements. You can also showcase facts, figures, and other relevant content using this PPT layout. Grab it now.

Advantages And Disadvantages Of Balanced Scorecard Ppt PowerPoint Presentation Styles Deck PDF
Presenting this set of slides with name advantages and disadvantages of balanced scorecard ppt powerpoint presentation styles deck pdf. This is a two stage process. The stages in this process are benefit, drawback, requires skillful planning, lack of risk analysis, lack of external factors and competitors, improved financial performance reporting. This is a completely editable PowerPoint presentation and is available for immediate download. Download now and impress your audience.

Company Overview Contd Operating Manual Ppt Infographic Template Layouts PDF
The purpose of this slide is to provide glimpse about the key promoters and the financial highlights of the firm as an financial overview of firms performance. Deliver and pitch your topic in the best possible manner with this company overview contd operating manual ppt infographic template layouts pdf. Use them to share invaluable insights on revenue, net income, financial and impress your audience. This template can be altered and modified as per your expectations. So, grab it now

Positive Impact Of Effective Marketing Kpis To Track Success Of Event Demonstration PDF
From laying roadmaps to briefing everything in detail, our templates are perfect for you. You can set the stage with your presentation slides. All you have to do is download these easy-to-edit and customizable templates. Positive Impact Of Effective Marketing Kpis To Track Success Of Event Demonstration PDF will help you deliver an outstanding performance that everyone would remember and praise you for. Do download this presentation today.

Tactical Planning And Analyzing Organizational Goals Icon Infographics PDF
This slide defines the dashboard for analyzing the sales key performance indicators KPIs. It includes information related to the number of sales, revenue, profit, and cost. Showcasing this set of slides titled Tactical Planning And Analyzing Organizational Goals Icon Infographics PDF. The topics addressed in these templates are Cost Breakdown, Sales Revenue, Accumulated Revenue. All the content presented in this PPT design is completely editable. Download it and make adjustments in color, background, font etc. as per your unique business setting.
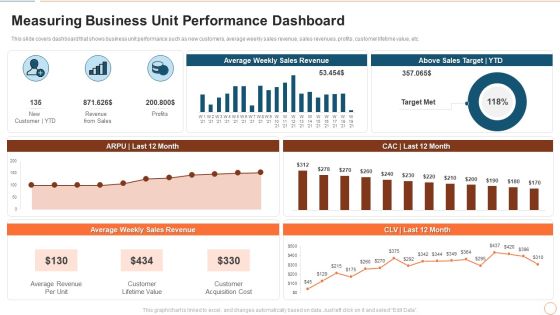
Illustrating Product Leadership Plan Incorporating Innovative Techniques Measuring Business Unit Professional PDF
This slide covers dashboard that shows business unit performance such as new customers, average weekly sales revenue, sales revenues, profits, customer lifetime value, etc. Deliver an awe inspiring pitch with this creative illustrating product leadership plan incorporating innovative techniques measuring business unit professional pdf bundle. Topics like average revenue per unit, customer lifetime value, customer acquisition cost can be discussed with this completely editable template. It is available for immediate download depending on the needs and requirements of the user.

Formulating Competitive Plan Of Action For Effective Product Leadership Measuring Business Unit Slides PDF
This slide covers dashboard that shows business unit performance such as new customers, average weekly sales revenue, sales revenues, profits, customer lifetime value, etc. Deliver an awe inspiring pitch with this creative formulating competitive plan of action for effective product leadership measuring business unit slides pdf bundle. Topics like average revenue per unit, customer lifetime value, customer acquisition cost can be discussed with this completely editable template. It is available for immediate download depending on the needs and requirements of the user.

Commodity Adoption Metrics For Technique Development Microsoft PDF
This slide highlights various key performance indicators to identify product adoption rate for user acquisition strategy development. It includes key metrics such as net promoter score, client retention rate, active user percentage, customer lifetime value and churn rate. Presenting Commodity Adoption Metrics For Technique Development Microsoft PDF to dispense important information. This template comprises four stages. It also presents valuable insights into the topics including Build Customer, Onboarding Process, Analysis. This is a completely customizable PowerPoint theme that can be put to use immediately. So, download it and address the topic impactfully.
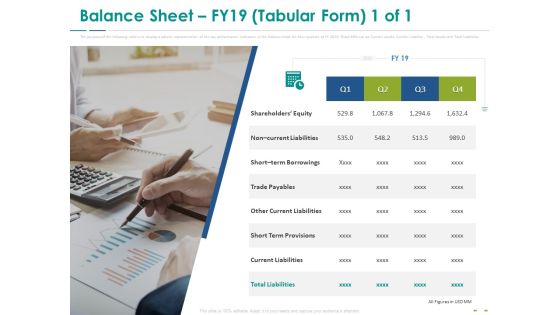
Stock Market Research Report Balance Sheet FY19 Tabular Form Equity Information PDF
The purpose of the following slide is to display the key performance indicators of the balance sheet for four quarters of FY 2019. These KPIs can be Current assets, Current Liability , Total Assets and Total Liabilities. Presenting stock market research report balance sheet fy19 tabular form equity information pdf to provide visual cues and insights. Share and navigate important information on one stages that need your due attention. This template can be used to pitch topics like non current liabilities, short term borrowings, trade payables, other current liabilities, short term provisions. In addition, this PPT design contains high-resolution images, graphics, etc, that are easily editable and available for immediate download.

Six Sigma Continuous Process Kpis To Measure The Growth Of Operational Strategy Rules PDF
Purpose of the following slide is to show the KPIs or key performance indicators for measuring the progress of operational strategy. These KPIs can be customer satisfaction rate, net promoter score, Downtime etc. This is a Six Sigma Continuous Process Kpis To Measure The Growth Of Operational Strategy Rules PDF template with various stages. Focus and dispense information on four stages using this creative set, that comes with editable features. It contains large content boxes to add your information on topics like Customer KPIs, Employee KPIs, Production KPIs. You can also showcase facts, figures, and other relevant content using this PPT layout. Grab it now.
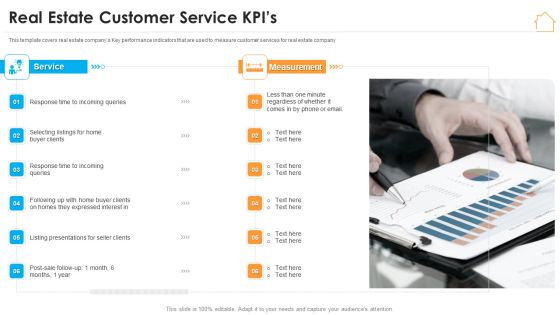
Real Estate Marketing Strategy Vendors Real Estate Customer Service Kpis Topics PDF
This template covers real estate companys Key performance indicators that are used to measure customer services for real estate company. Presenting real estate marketing strategy vendors real estate customer service kpis topics pdf to provide visual cues and insights. Share and navigate important information on six stages that need your due attention. This template can be used to pitch topics like measurement, buyer clients, service. In addtion, this PPT design contains high resolution images, graphics, etc, that are easily editable and available for immediate download.

Identifying Key Metrics To Measure Success Of Our Marketing Efforts Download PDF
Purpose of the following slide is to identify the key metrics that the organization can use to track performance of their marketing efforts, these metrics are cost of acquisition, click through rate etc. Presenting Identifying Key Metrics To Measure Success Of Our Marketing Efforts Download PDF to provide visual cues and insights. Share and navigate important information on one stages that need your due attention. This template can be used to pitch topics like Social Media, Cost Per Acquisition, Key Marketing Metrics. In addtion, this PPT design contains high resolution images, graphics, etc, that are easily editable and available for immediate download.

Data Monetization And Management Data Collection Preparation And Preprocessing Mockup PDF
Once the insights are identified, data collection sources are selected for further predictive modeling. After that, dataset is prepared with a set of attributes representing behavior patterns related to customer engagement level for specific product or service. From laying roadmaps to briefing everything in detail, our templates are perfect for you. You can set the stage with your presentation slides. All you have to do is download these easy-to-edit and customizable templates. Data Monetization And Management Data Collection Preparation And Preprocessing Mockup PDF will help you deliver an outstanding performance that everyone would remember and praise you for. Do download this presentation today.

Major Metrics To Manage Cash Flow Ppt Infographics Portfolio PDF
This slide showcases main performance metric for cashflow management and improvement. The KPIs covered are account receivable turnover, sustainable growth rate, cash conversion cycle and quick ratio. Presenting Major Metrics To Manage Cash Flow Ppt Infographics Portfolio PDF to dispense important information. This template comprises four stages. It also presents valuable insights into the topics including Account Receivable Turnover, Sustainable Growth Rate, Cash Conversion Cycle. This is a completely customizable PowerPoint theme that can be put to use immediately. So, download it and address the topic impactfully.

Information Security Track Record Of Our Company Themes PDF
This slide highlights our past track record as a data privacy provider company and outlines that we promise 100 percent client satisfaction. From laying roadmaps to briefing everything in detail, our templates are perfect for you. You can set the stage with your presentation slides. All you have to do is download these easy to edit and customizable templates. Information Security Track Record Of Our Company Themes PDF will help you deliver an outstanding performance that everyone would remember and praise you for. Do download this presentation today.

Price Architecture Cost Sheet Ratio Cont Ppt PowerPoint Presentation Portfolio Guidelines PDF
These four key performance indicator calculates a gross profit margin. Presenting price architecture cost sheet ratio cont ppt powerpoint presentation portfolio guidelines pdf to provide visual cues and insights. Share and navigate important information on four stages that need your due attention. This template can be used to pitch topics like gross profit margin, direct material cost per unit, direct labor cost per unit, fixed overhead cost per unit, sales volume, sales revenue. In addition, this PPT design contains high-resolution images, graphics, etc, that are easily editable and available for immediate download.

Earned Value Management Analysis Of Different Activities Ppt Infographic Template Slides PDF
This slide represents earned value management analysis of different activities illustrating activities, budget at completion, planned value, actual cost etc use for valuing each activity performance in a project. Presenting Earned Value Management Analysis Of Different Activities Ppt Infographic Template Slides PDF to dispense important information. This template comprises one stages. It also presents valuable insights into the topics including Develop Scope, Develop Task Schedule, Create Risk Plan. This is a completely customizable PowerPoint theme that can be put to use immediately. So, download it and address the topic impactfully.

Factory Costs Components Cost Sheet Ratio Cont Ppt Gallery Images PDF
These four key performance indicator calculates a gross profit margin .This is a factory costs components cost sheet ratio cont ppt gallery images pdf. template with various stages. Focus and dispense information on four stages using this creative set, that comes with editable features. It contains large content boxes to add your information on topics like direct material cost per unit, gross profit margin, direct labor cost per unit, sales volume. You can also showcase facts, figures, and other relevant content using this PPT layout. Grab it now.

Multiple Challenges In Internal Cloud Computing Assessment Ppt Visual Aids Model PDF
The slide highlights the barriers faced in cloud auditing to analyse the performance of the vendor. Various challenges included are scope definition, third party dependence, expertise required and data access. Presenting Multiple Challenges In Internal Cloud Computing Assessment Ppt Visual Aids Model PDF to dispense important information. This template comprises one stages. It also presents valuable insights into the topics including Scope Definition, Third Party Dependence, Expertise Required, Data Access. This is a completely customizable PowerPoint theme that can be put to use immediately. So, download it and address the topic impactfully.

Embed Diversity And Inclusion Impact Of Diversity And Inclusion In Company Designs PDF
This infographic provides impact of D And I in business performance which leads to enhanced innovation, creativity, reputation, engagement, and results. This is a Embed Diversity And Inclusion Impact Of Diversity And Inclusion In Company Designs PDF template with various stages. Focus and dispense information on six stages using this creative set, that comes with editable features. It contains large content boxes to add your information on topics like Increased Creativity, Better Outcomes, Workplace Happiness, Stakeholder Support. You can also showcase facts, figures, and other relevant content using this PPT layout. Grab it now.
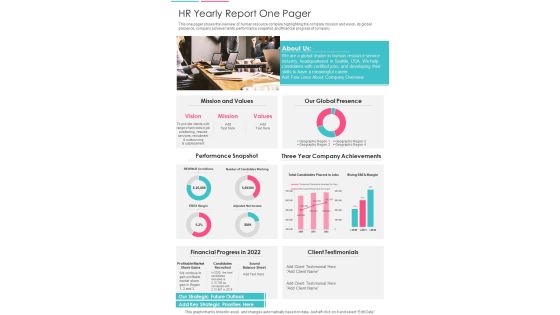
HR Yearly Report One Pager One Pager Documents
This one pager shows the overview of human resource company highlighting the company mission and vision, its global presence, company achievements, performance snapshot, and financial progress of company. Presenting you an exemplary HR Yearly Report One Pager One Pager Documents. Our one-pager comprises all the must-have essentials of an inclusive document. You can edit it with ease, as its layout is completely editable. With such freedom, you can tweak its design and other elements to your requirements. Download this HR Yearly Report One Pager One Pager Documents brilliant piece now.
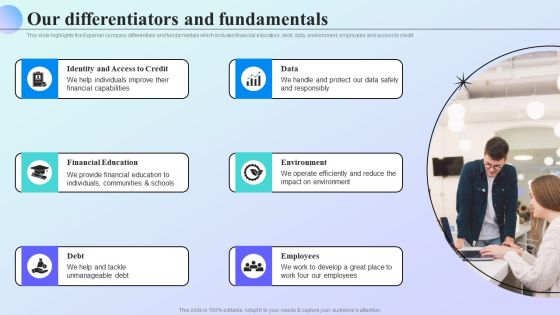
Information Analytics Company Outline Our Differentiators And Fundamentals Professional PDF
This slide highlights the Experian company differentials and fundamentals which includes financial education, debt, data, environment, employees and access to credit. From laying roadmaps to briefing everything in detail, our templates are perfect for you. You can set the stage with your presentation slides. All you have to do is download these easy to edit and customizable templates. Information Analytics Company Outline Our Differentiators And Fundamentals Professional PDF will help you deliver an outstanding performance that everyone would remember and praise you for. Do download this presentation today.
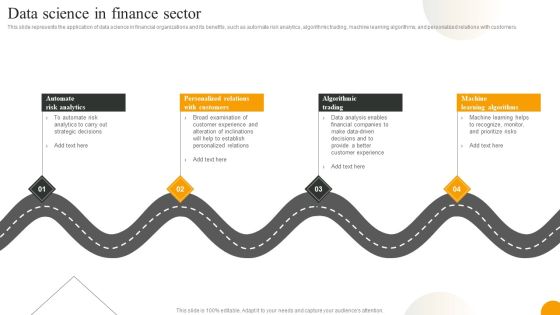
Using Data Science Technologies For Business Transformation Data Science In Finance Sector Slides PDF
This slide represents the application of data science in financial organizations and its benefits, such as automate risk analytics, algorithmic trading, machine learning algorithms, and personalized relations with customers. From laying roadmaps to briefing everything in detail, our templates are perfect for you. You can set the stage with your presentation slides. All you have to do is download these easy to edit and customizable templates. Using Data Science Technologies For Business Transformation Data Science In Finance Sector Slides PDF will help you deliver an outstanding performance that everyone would remember and praise you for. Do download this presentation today.

Allocated Budget Analysis For Influencer Marketing Strategy Plan Infographics PDF
This slide showcases graphs that can help organization to identify the variance in spent vs allocated budget and estimate future financial forecasts. Its can also help to keep track of further expenses for influencer marketing strategy.Showcasing this set of slides titled Allocated Budget Analysis For Influencer Marketing Strategy Plan Infographics PDF. The topics addressed in these templates are Allocated Budget, Date Organization, Performance Media Budget. All the content presented in this PPT design is completely editable. Download it and make adjustments in color, background, font etc. as per your unique business setting.

 Home
Home