Financial Performance Dashboard
Dashboard To Track Automated Manufacturing Workflow Progress Professional PDF
Following slide demonstrates KPI dashboard for monitoring automated manufacturing processes performance which can be used by businesses to increase organization efficiency. It includes key components such as total business revenue, Number of customers, total units produced, production rate, monthly production by manufacturing lines, etc. Showcasing this set of slides titled Dashboard To Track Automated Manufacturing Workflow Progress Professional PDF. The topics addressed in these templates are Machine Utilization, Product Delivery, Defective Units Produced. All the content presented in this PPT design is completely editable. Download it and make adjustments in color, background, font etc. as per your unique business setting.
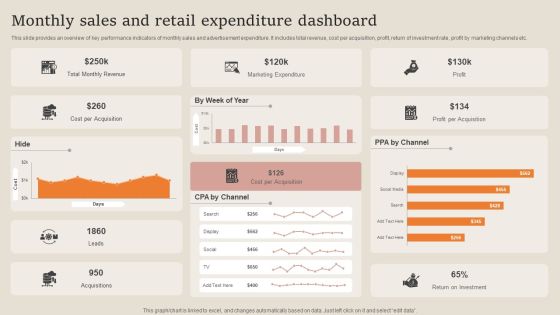
Monthly Sales And Retail Expenditure Dashboard Summary PDF
This slide provides an overview of key performance indicators of monthly sales and advertisement expenditure. It includes total revenue, cost per acquisition, profit, return of investment rate, profit by marketing channels etc. Pitch your topic with ease and precision using this Monthly Sales And Retail Expenditure Dashboard Summary PDF. This layout presents information on Marketing Expenditure, Revenue, Cost Per Acquisition. It is also available for immediate download and adjustment. So, changes can be made in the color, design, graphics or any other component to create a unique layout.

Kpi Dashboard To Track Digital Transformation Initiatives Formats PDF
Following slide provides dashboard that can be used by the businesses to measure the performance of digital transformation initiatives with the help of different KPIs. KPIs covered are social presence, click through rate, sales revenue, churn amount etc. Crafting an eye catching presentation has never been more straightforward. Let your presentation shine with this tasteful yet straightforward Kpi Dashboard To Track Digital Transformation Initiatives Formats PDF template. It offers a minimalistic and classy look that is great for making a statement. The colors have been employed intelligently to add a bit of playfulness while still remaining professional. Construct the ideal Kpi Dashboard To Track Digital Transformation Initiatives Formats PDF that effortlessly grabs the attention of your audience Begin now and be certain to wow your customers.

Dashboard For RPA Implementation For Healthcare Management Slides PDF
This slide provides a detailed information about performance of RPA bots on various processes of organization. It includes time saved by bots, money saved by process, total hours saved, total bot run time etc. Formulating a presentation can take up a lot of effort and time, so the content and message should always be the primary focus. The visuals of the PowerPoint can enhance the presenters message, so our Dashboard For RPA Implementation For Healthcare Management Slides PDF was created to help save time. Instead of worrying about the design, the presenter can concentrate on the message while our designers work on creating the ideal templates for whatever situation is needed. Slidegeeks has experts for everything from amazing designs to valuable content, we have put everything into Dashboard For RPA Implementation For Healthcare Management Slides PDF.

Strategies To Select Effective Price Optimization Dashboard Graphics PDF
This template covers the details of price optimization which focuses on number of visitors, customers, revenues, performance by devices, etc. Here you can discover an assortment of the finest PowerPoint and Google Slides templates. With these templates, you can create presentations for a variety of purposes while simultaneously providing your audience with an eye-catching visual experience. Download Strategies To Select Effective Price Optimization Dashboard Graphics PDF to deliver an impeccable presentation. These templates will make your job of preparing presentations much quicker, yet still, maintain a high level of quality. Slidegeeks has experienced researchers who prepare these templates and write high-quality content for you. Later on, you can personalize the content by editing the Strategies To Select Effective Price Optimization Dashboard Graphics PDF.

KPI Dashboard For Modernizing Hospitality Business Inspiration PDF
The following slide showcases dashboard to track data and perform analytics for managing staff, ordering supplies and to maintain customer satisfaction. It presents information related to expenses, sales, etc. Pitch your topic with ease and precision using this KPI Dashboard For Modernizing Hospitality Business Inspiration PDF. This layout presents information on Fiscal Year, Labor, Modernizing Hospitality. It is also available for immediate download and adjustment. So, changes can be made in the color, design, graphics or any other component to create a unique layout.
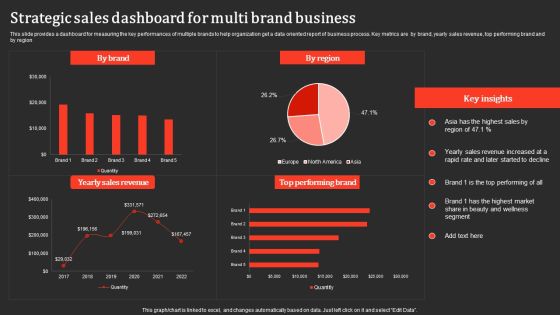
Strategic Sales Dashboard For Multi Brand Business Professional PDF
This slide provides a dashboard for measuring the key performances of multiple brands to help organization get a data oriented report of business process. Key metrics are by brand, yearly sales revenue, top performing brand and by region. Pitch your topic with ease and precision using this Strategic Sales Dashboard For Multi Brand Business Professional PDF. This layout presents information on Yearly Sales Revenue, Performing Brand. It is also available for immediate download and adjustment. So, changes can be made in the color, design, graphics or any other component to create a unique layout.

E Commerce Project Campaign Planning And Management Dashboard Structure PDF
The following slide highlights the ecommerce project campaign planning and management dashboard illustrating key headings which includes revenue, onsite behaviour, mobile revenue and average order value, revenue by channel, top performing campaigns, high bounce mobile devices and mobile vs site revenue Showcasing this set of slides titled E Commerce Project Campaign Planning And Management Dashboard Structure PDF. The topics addressed in these templates are E Commerce Project Campaign Planning And Management Dashboard. All the content presented in this PPT design is completely editable. Download it and make adjustments in color, background, font etc. as per your unique business setting.
Marketing And Operation KPI Dashboard To Increase Efficiency Icons PDF
This slide covers sales and operations KPI dashboard to increase efficiency. It involves performance, increase in profit, target, monthly profit and quarterly revenue trend. Pitch your topic with ease and precision using this Marketing And Operation KPI Dashboard To Increase Efficiency Icons PDF. This layout presents information on Profit By Monthly, Target, Performance. It is also available for immediate download and adjustment. So, changes can be made in the color, design, graphics or any other component to create a unique layout.

Customer Attrition In A Bpo - Dashboard Icons PDF
Deliver an awe-inspiring pitch with this creative customer attrition in a bpo - dashboard icons pdf. bundle. Topics like web chart performance, telecom churn overview metrics, customer care call performance, telecom churn overview metrics, monthly revenue lost can be discussed with this completely editable template. It is available for immediate download depending on the needs and requirements of the user.

Online Marketing Activities KPI Dashboard To Improve Sales Ideas PDF
This slide covers online marketing dashboard to improve sales. It involves details such as web performance, conversion funnel, revenue this month, traffic sources and number of followers on social media.Pitch your topic with ease and precision using this Online Marketing Activities KPI Dashboard To Improve Sales Ideas PDF. This layout presents information on Email Performance, Web Performance, Cost Conversion. It is also available for immediate download and adjustment. So, changes can be made in the color, design, graphics or any other component to create a unique layout.

Investment Project KPI Dashboard For Production Analysis Ideas PDF
This slide covers capital project KPI tracking dashboard. It also include metrics such as production vs. target quantity, manufacturing, runtime vs. downtime, production cost, overall equipment effectiveness, etc. Showcasing this set of slides titled Investment Project KPI Dashboard For Production Analysis Ideas PDF. The topics addressed in these templates are Project, Performance, Quality, Overall Equipment Effectiveness. All the content presented in this PPT design is completely editable. Download it and make adjustments in color, background, font etc. as per your unique business setting.

B2B Lead Generation KPI Dashboard Actual Sample PDF
Deliver an awe inspiring pitch with this creative b2b lead generation kpi dashboard actual sample pdf bundle. Topics like performance, sales, revenue, leads actual can be discussed with this completely editable template. It is available for immediate download depending on the needs and requirements of the user.

Customer Attrition In A Bpo Dashboard Ppt Model Ideas PDF
Deliver and pitch your topic in the best possible manner with this customer attrition in a bpo dashboard ppt model ideas pdf. Use them to share invaluable insights on telecom churn overview metrics, customer care call performance, monthly revenue lost and impress your audience. This template can be altered and modified as per your expectations. So, grab it now.

Dashboard Highlighting Product Kpis For Enhancement Strategy Structure PDF
This slide illustrates dashboard indicating product kpis for improvement plan which can be referred by organizations to review sales campaign performance. It includes information about top products in revenue, online vs. Offline transactions, increased sales by campaign and cost of products sold. Showcasing this set of slides titled Dashboard Highlighting Product Kpis For Enhancement Strategy Structure PDF. The topics addressed in these templates are Revenue, Products, Cost. All the content presented in this PPT design is completely editable. Download it and make adjustments in color, background, font etc. as per your unique business setting.

Digital Marketing KPI Dashboard With Engagement Rate Background PDF
The following slide showcases a comprehensive KPI dashboard which allows the company to track the digital marketing performance. Total visits, cost per click, engagement rate, total impressions, product sales trend, revenue by various channels are some of the key metrics mentioned in the slide. Showcasing this set of slides titled Digital Marketing KPI Dashboard With Engagement Rate Background PDF. The topics addressed in these templates are Demographics, Revenue, Sales. All the content presented in this PPT design is completely editable. Download it and make adjustments in color, background, font etc. as per your unique business setting.

Real Estate Property Management Dashboard With Leasing Status Graphics PDF
This slide shows real estate property management dashboard with leasing status which can be referred by companies to have an overview about their performance. It includes information about revenue, properties, recent tasks, expired leases, outstanding balances, etc.Pitch your topic with ease and precision using this real estate property management dashboard with leasing status graphics pdf This layout presents information on property revenue overview, leases which are expiring, recent tasks It is also available for immediate download and adjustment. So, changes can be made in the color, design, graphics or any other component to create a unique layout.
Facebook Analytics Pixel Marketing Plan Dashboard Professional PDF
This slide exhibits dashboard which offers free point of view for optimization and in-depth analysis of visitors. This template helps in tracking social media and campaigns performance. It involves information related to revenue, age factor, etc. Showcasing this set of slides titled Facebook Analytics Pixel Marketing Plan Dashboard Professional PDF Graphics. The topics addressed in these templates are People Metrics, Lifetime Value, Purchases Repeated. All the content presented in this PPT design is completely editable. Download it and make adjustments in color, background, font etc. as per your unique business setting.
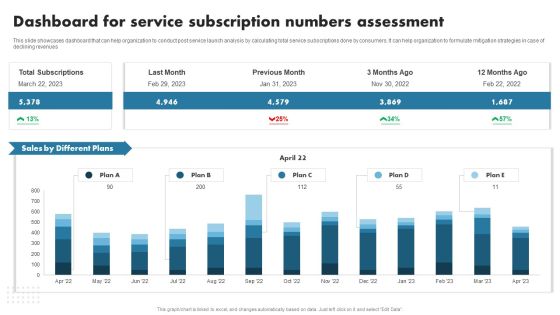
Enhancing Customer Outreach Dashboard For Service Subscription Numbers Template PDF
This slide showcases dashboard that can help organization to conduct post service launch analysis by calculating total service subscriptions done by consumers. It can help organization to formulate mitigation strategies in case of declining revenues. This Enhancing Customer Outreach Dashboard For Service Subscription Numbers Template PDF from Slidegeeks makes it easy to present information on your topic with precision. It provides customization options, so you can make changes to the colors, design, graphics, or any other component to create a unique layout. It is also available for immediate download, so you can begin using it right away. Slidegeeks has done good research to ensure that you have everything you need to make your presentation stand out. Make a name out there for a brilliant performance.
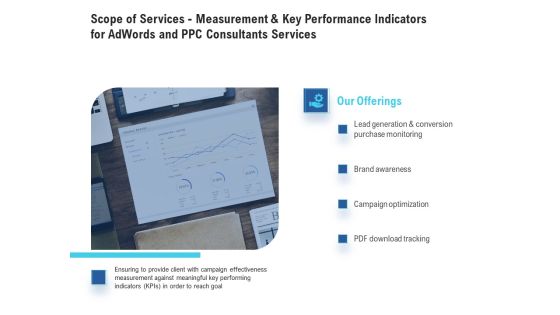
Scope Of Services - Measurement And Key Performance Indicators For Adwords And PPC Consultants Services Brochure PDF
Presenting this set of slides with name scope of services - measurement and key performance indicators for adwords and ppc consultants services brochure pdf. This is a four stage process. The stages in this process are lead generation and conversion purchase monitoring, brand awareness, campaign optimization, pdf download tracking. This is a completely editable PowerPoint presentation and is available for immediate download. Download now and impress your audience.

Monetary Planning And Evaluation Guide KPI Metrics Dashboard Highlighting Organization Revenue Profitability And Liquidity Ppt Diagram Images PDF
The following slide outlines key performance indicator KPI dashboard showcasing various financial metrics of the organization. The key metrics are gross revenue, product revenue, service revenue, gross profit, net profit etc. Coming up with a presentation necessitates that the majority of the effort goes into the content and the message you intend to convey. The visuals of a PowerPoint presentation can only be effective if it supplements and supports the story that is being told. Keeping this in mind our experts created Monetary Planning And Evaluation Guide KPI Metrics Dashboard Highlighting Organization Revenue Profitability And Liquidity Ppt Diagram Images PDF to reduce the time that goes into designing the presentation. This way, you can concentrate on the message while our designers take care of providing you with the right template for the situation.

Strategic Plan To Increase Sales Volume And Revenue Sales Key Performance Indicators Of The Company Before Strategy Implementation Download PDF
This slide shows the current Sales Performance Indicators of the company before adopting an effective strategy. These stats are related to Sales Growth, Average Sales Cycle Length, Profit Margin, Customer Churn Rate, Overall Company Sales etc. from the years 2019 to 2021 along with key takeaways. Deliver and pitch your topic in the best possible manner with this strategic plan to increase sales volume and revenue sales key performance indicators of the company before strategy implementation download pdf. Use them to share invaluable insights on sales, growth, profit margin, performance and impress your audience. This template can be altered and modified as per your expectations. So, grab it now.

Case Competition Reduction In Existing Customer Of Telecommunication Company Key Performance Indicators Ppt Layouts Graphics Pictures PDF
This is a case competition reduction in existing customer of telecommunication company key performance indicators ppt layouts graphics pictures pdf template with various stages. Focus and dispense information on seven stages using this creative set, that comes with editable features. It contains large content boxes to add your information on topics like key performance indicator, subscribers, technology users, average revenue, customer satisfaction level . You can also showcase facts, figures, and other relevant content using this PPT layout. Grab it now.

Dual Branding Campaign To Boost Sales Of Product Or Services Kpis To Track Product Performance Introduction PDF
This slide showcases KPIs that can help organization to track the performance of product after dual branding campaign. KPIs are units sold, sales revenue and repeat purchase rate. Boost your pitch with our creative Dual Branding Campaign To Boost Sales Of Product Or Services Kpis To Track Product Performance Introduction PDF. Deliver an awe inspiring pitch that will mesmerize everyone. Using these presentation templates you will surely catch everyones attention. You can browse the ppts collection on our website. We have researchers who are experts at creating the right content for the templates. So you do not have to invest time in any additional work. Just grab the template now and use them.
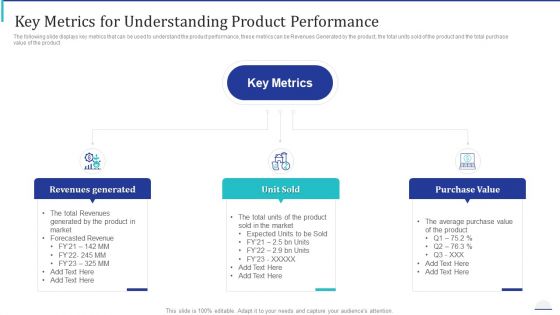
How Make Impactful Product Marketing Message Build Product Differentiation Key Metrics For Understanding Product Performance Rules PDF
The following slide displays key metrics that can be used to understand the product performance, these metrics can be Revenues Generated by the product, the total units sold of the product and the total purchase value of the product. This is a how make impactful product marketing message build product differentiation key metrics for understanding product performance rules pdf template with various stages. Focus and dispense information on three stages using this creative set, that comes with editable features. It contains large content boxes to add your information on topics like revenues generated, unit sold, purchase value. You can also showcase facts, figures, and other relevant content using this PPT layout. Grab it now.

Agriculture Marketing Strategy To Improve Revenue Performance Negative Impact Of Ineffective Farm Marketing On Sales Clipart PDF
This slide provides an overview of the decreased sales and increase customer acquisition cost. Major reasons covered are ineffective marketing strategies, lack of market data, improper budgeting, high competition and poor relationship with the audience. Slidegeeks has constructed Agriculture Marketing Strategy To Improve Revenue Performance Negative Impact Of Ineffective Farm Marketing On Sales Clipart PDF after conducting extensive research and examination. These presentation templates are constantly being generated and modified based on user preferences and critiques from editors. Here, you will find the most attractive templates for a range of purposes while taking into account ratings and remarks from users regarding the content. This is an excellent jumping off point to explore our content and will give new users an insight into our top notch PowerPoint Templates.

Logistics Dashboard For XYZ Logistic Company Orders Ppt Infographic Template Diagrams PDF
The slide shows the logistic measurement dashboard for measuring order status, total orders, overdue shipments, global financial performance etc. Deliver and pitch your topic in the best possible manner with this logistics dashboard for xyz logistic company orders ppt infographic template diagrams pdf. Use them to share invaluable insights on global financial performance, orders, inventory and impress your audience. This template can be altered and modified as per your expectations. So, grab it now.

Logistics Dashboard For XYZ Logistic Company Inventory Ppt Infographic Template Background PDF
The slide shows the logistic measurement dashboard for measuring order status, total orders, overdue shipments, global financial performance etc.Deliver and pitch your topic in the best possible manner with this logistics dashboard for XYZ logistic company inventory ppt infographic template background pdf. Use them to share invaluable insights on global financial performance, orders, volume today and impress your audience. This template can be altered and modified as per your expectations. So, grab it now.
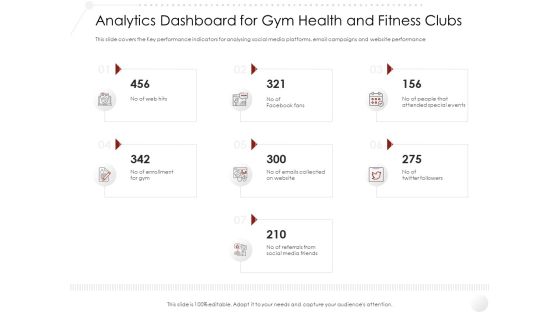
Market Entry Strategy Clubs Industry Analytics Dashboard For Gym Health And Fitness Clubs Summary PDF
This slide covers the Key performance indicators for analysing social media platforms, email campaigns and website performance. Presenting market entry strategy clubs industry analytics dashboard for gym health and fitness clubs summary pdf to provide visual cues and insights. Share and navigate important information on seven stages that need your due attention. This template can be used to pitch topics like Analytics Dashboard for Gym Health and Fitness Clubs. In addtion, this PPT design contains high-resolution images, graphics, etc, that are easily editable and available for immediate download.

CRM Pipeline Administration Customer Deal Tracking In Sales Pipeline Dashboard Ppt Inspiration Template PDF
This slide covers information regarding dashboard for tracking various customer deals in sales pipeline. From laying roadmaps to briefing everything in detail, our templates are perfect for you. You can set the stage with your presentation slides. All you have to do is download these easy-to-edit and customizable templates. CRM Pipeline Administration Customer Deal Tracking In Sales Pipeline Dashboard Ppt Inspiration Template PDF will help you deliver an outstanding performance that everyone would remember and praise you for. Do download this presentation today.

Logistics KPI Status Dashboard With Monthly KPI Ppt Infographic Template Layout PDF
The following slide highlights the transportation status dashboard with monthly KPI illustrating order status with customer, order date and delivery date. It shows financial performance for four quarters as well as todays order, inventory and monthly KPI with Inventory, shipping cost for past 30 days. Pitch your topic with ease and precision using this Logistics KPI Status Dashboard With Monthly KPI Ppt Infographic Template Layout PDF. This layout presents information on Order Status, Today Order, Inventory, Monthly KPI. It is also available for immediate download and adjustment. So, changes can be made in the color, design, graphics or any other component to create a unique layout.

Cash Management Dashboard With Sales Outstanding And Liquidity Ratio Analysis Information PDF
This showcases dashboard that can help organization in cash management and track KPIs to evaluate the financial performance of company. It key components are liquidity ratios, cash balance. days sales outstanding, days inventory outstanding and days payable outstanding. Pitch your topic with ease and precision using this Cash Management Dashboard With Sales Outstanding And Liquidity Ratio Analysis Information PDF. This layout presents information on Cash Conversion, Working Capital, Cash Balance. It is also available for immediate download and adjustment. So, changes can be made in the color, design, graphics or any other component to create a unique layout.
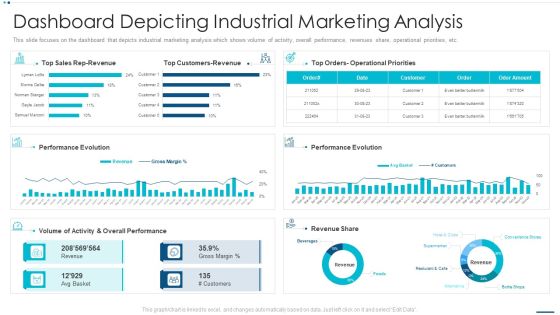
Strategic B2B Marketing Plan Dashboard Depicting Industrial Marketing Analysis Introduction PDF
This slide focuses on the dashboard that depicts industrial marketing analysis which shows volume of activity, overall performance, revenues share, operational priorities, etc.Deliver and pitch your topic in the best possible manner with this strategic b2b marketing plan dashboard depicting industrial marketing analysis introduction pdf Use them to share invaluable insights on performance evolution, volume of activity, overall performance and impress your audience. This template can be altered and modified as per your expectations. So, grab it now.

Web Analytics Dashboard Click Through And Conversion Rate Ppt PowerPoint Presentation Professional
This is a web analytics dashboard click through and conversion rate ppt powerpoint presentation professional. This is a three stage process. The stages in this process are marketing analytics, marketing performance, marketing discovery.
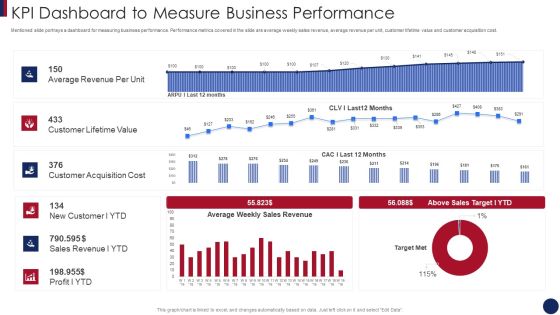
Post Merger Information Technology Service Delivery Amalgamation KPI Dashboard To Measure Business Template PDF
Mentioned slide portrays a dashboard for measuring business performance. Performance metrics covered in the slide are average weekly sales revenue, average revenue per unit, customer lifetime value and customer acquisition cost. Deliver an awe inspiring pitch with this creative post merger information technology service delivery amalgamation kpi dashboard to measure business template pdf bundle. Topics like kpi dashboard to measure business performance can be discussed with this completely editable template. It is available for immediate download depending on the needs and requirements of the user.

Closed Loop Supply Chain Management Reverse Logistics Dashboard Inventory Ppt Tips PDF
Presenting this set of slides with name closed loop supply chain management reverse logistics dashboard inventory ppt tips pdf. The topics discussed in these slides are customer, order status, order date, product, financial performance. This is a completely editable PowerPoint presentation and is available for immediate download. Download now and impress your audience.
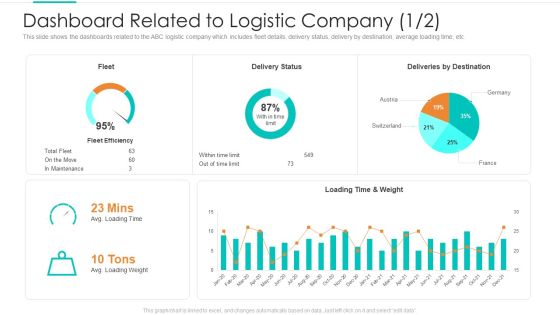
Planning Logistic Technique Superior Supply Chain Execution Dashboard Related To Logistic Company Professional PDF
Deliver an awe-inspiring pitch with this creative planning logistic technique superior supply chain execution dashboard related to logistic company professional pdf bundle. Topics like global financial performance, volume, inventory details can be discussed with this completely editable template. It is available for immediate download depending on the needs and requirements of the user.
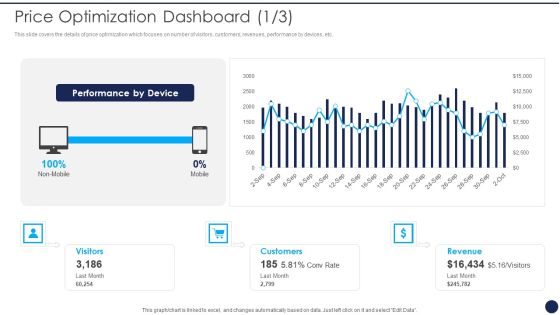
Product Pricing Strategies Analysis Price Optimization Dashboard Ppt File Background Image PDF
This slide covers the details of price optimization which focuses on number of visitors, customers, revenues, performance by devices, etc. Deliver an awe inspiring pitch with this creative Product Pricing Strategies Analysis Price Optimization Dashboard Ppt File Background Image PDF bundle. Topics like Visitors Customers Revenue, Performance By Device can be discussed with this completely editable template. It is available for immediate download depending on the needs and requirements of the user.
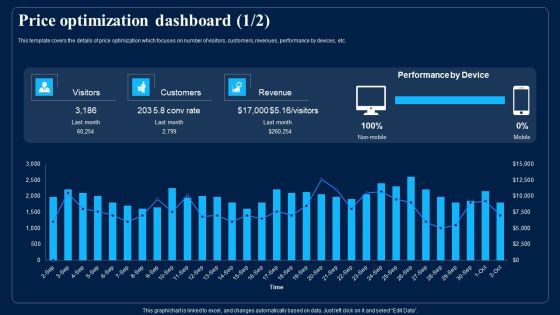
Identifying Optimum Pricing Methods For Business Price Optimization Dashboard Professional PDF
This template covers the details of price optimization which focuses on number of visitors, customers, revenues, performance by devices, etc. Deliver an awe inspiring pitch with this creative Identifying Optimum Pricing Methods For Business Price Optimization Dashboard Professional PDF bundle. Topics like Revenue, Customers, Performance By Device can be discussed with this completely editable template. It is available for immediate download depending on the needs and requirements of the user.

Developing Functional Logistic Plan Business Dashboard Related To Logistic Company Inspiration PDF
This slide shows the dashboard related to the ABC logistic company which includes order status, global financial performance, volume, inventory details, etc. Deliver and pitch your topic in the best possible manner with this developing functional logistic plan business dashboard related to logistic company inspiration pdf. Use them to share invaluable insights on dashboard related to logistic company and impress your audience. This template can be altered and modified as per your expectations. So, grab it now.
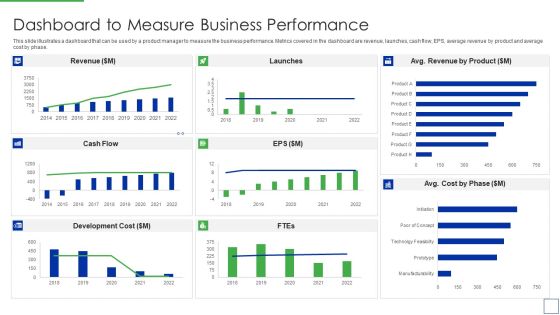
Product Portfolio Management For New Target Region Dashboard To Measure Business Rules PDF
This slide illustrates a dashboard that can be used by a product manager to measure the business performance. Metrics covered in the dashboard are revenue, launches, cash flow, EPS, average revenue by product and average cost by phase.Deliver and pitch your topic in the best possible manner with this Product Portfolio Management For New Target Region Dashboard To Measure Business Rules PDF Use them to share invaluable insights on Dashboard to Measure Business Performance and impress your audience. This template can be altered and modified as per your expectations. So, grab it now.

KPI Dashboard To Track Borrowing System Management System Ppt Visual Aids Portfolio PDF
This slide depicts a dashboard which can be used by banks or financial institutions to track the status of loan activities and management systems. Key performing indicators include existing customers, ongoing loans, loan trends etc. Showcasing this set of slides titled KPI Dashboard To Track Borrowing System Management System Ppt Visual Aids Portfolio PDF. The topics addressed in these templates are Existing Customers, Ongoing Loans, Todays Payment Received. All the content presented in this PPT design is completely editable. Download it and make adjustments in color, background, font etc. as per your unique business setting.
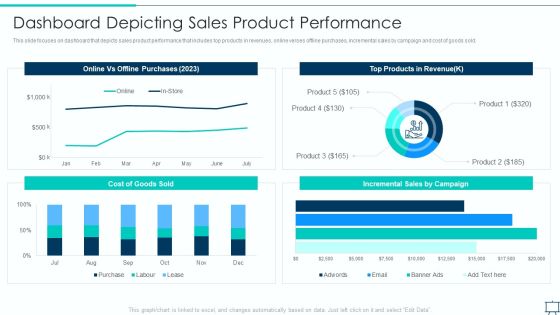
Formulating Competitive Plan Of Action For Effective Product Leadership Dashboard Depicting Sales Topics PDF
This slide focuses on dashboard that depicts sales product performance that includes top products in revenues, online verses offline purchases, incremental sales by campaign and cost of goods sold. Deliver and pitch your topic in the best possible manner with this formulating competitive plan of action for effective product leadership dashboard depicting sales topics pdf. Use them to share invaluable insights on dashboard depicting sales product performance and impress your audience. This template can be altered and modified as per your expectations. So, grab it now.
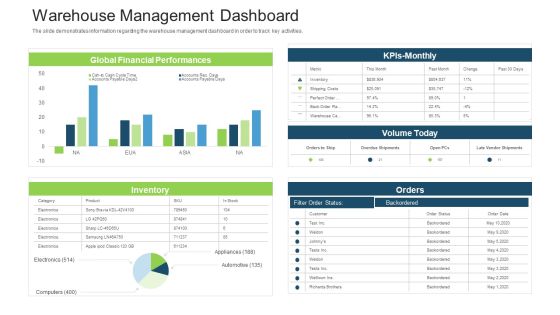
Stock Control System Warehouse Management Dashboard Ppt Visual Aids Outline PDF
The slide demonstrates information regarding the warehouse management dashboard in order to track key activities. Deliver and pitch your topic in the best possible manner with this stock control system warehouse management dashboard ppt visual aids outline pdf. Use them to share invaluable insights on kpls monthly, orders, inventory, global financial performances, volume today and impress your audience. This template can be altered and modified as per your expectations. So, grab it now.

Stock Repository Management For Inventory Control Warehouse Management Dashboard Brochure PDF
The slide demonstrates information regarding the warehouse management dashboard in order to track key activities. Deliver and pitch your topic in the best possible manner with this stock repository management for inventory control warehouse management dashboard brochure pdf. Use them to share invaluable insights on financial performances, inventory, warehouse and impress your audience. This template can be altered and modified as per your expectations. So, grab it now.
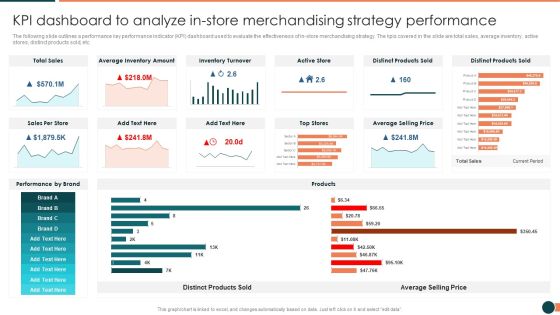
Developing Retail Marketing Strategies To Increase Revenue KPI Dashboard To Analyze Instore Information PDF
The following slide outlines a performance key performance indicator KPI dashboard used to evaluate the effectiveness of in store merchandising strategy. The kpis covered in the slide are total sales, average inventory, active stores, distinct products sold, etc.Deliver an awe inspiring pitch with this creative Developing Retail Marketing Strategies To Increase Revenue KPI Dashboard To Analyze Instore Information PDF bundle. Topics like Inventory Turnover, Distinct Products, Average Inventory can be discussed with this completely editable template. It is available for immediate download depending on the needs and requirements of the user.
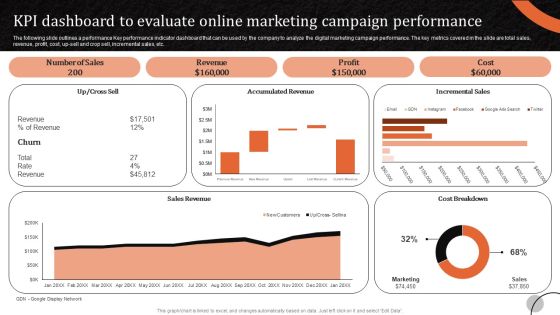
Marketing Tactics To Increase KPI Dashboard To Evaluate Online Marketing Campaign Infographics PDF
The following slide outlines a performance Key performance indicator dashboard that can be used by the company to analyze the digital marketing campaign performance. The key metrics covered in the slide are total sales, revenue, profit, cost, up-sell and crop sell, incremental sales, etc. Want to ace your presentation in front of a live audience Our Marketing Tactics To Increase KPI Dashboard To Evaluate Online Marketing Campaign Infographics PDF can help you do that by engaging all the users towards you. Slidegeeks experts have put their efforts and expertise into creating these impeccable powerpoint presentations so that you can communicate your ideas clearly. Moreover, all the templates are customizable, and easy-to-edit and downloadable. Use these for both personal and commercial use.

KPI Dashboard To Measure Effectiveness Of Real Estate Marketing Strategies Inspiration PDF
The following slide outlines performance key performance indicator KPI dashboard that can assist marketers to evaluate online and offline real estate promotional techniques performance. The metrics covered are quarterly sales, deals won, expired contracts, revenue, conversion rates, etc. Coming up with a presentation necessitates that the majority of the effort goes into the content and the message you intend to convey. The visuals of a PowerPoint presentation can only be effective if it supplements and supports the story that is being told. Keeping this in mind our experts created KPI Dashboard To Measure Effectiveness Of Real Estate Marketing Strategies Inspiration PDF to reduce the time that goes into designing the presentation. This way, you can concentrate on the message while our designers take care of providing you with the right template for the situation.
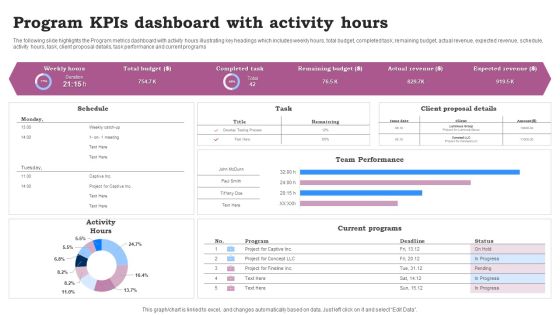
Program Kpis Dashboard With Activity Hours Ppt Infographics Clipart Images PDF
The following slide highlights the Program metrics dashboard with activity hours illustrating key headings which includes weekly hours, total budget, completed task, remaining budget, actual revenue, expected revenue, schedule, activity hours, task, client proposal details, task performance and current programs. Pitch your topic with ease and precision using this Program Kpis Dashboard With Activity Hours Ppt Infographics Clipart Images PDF. This layout presents information on Team Performance, Current Programs, Activity Hours. It is also available for immediate download and adjustment. So, changes can be made in the color, design, graphics or any other component to create a unique layout.
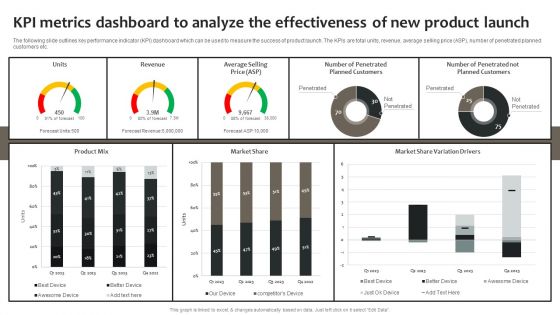
Effective Online And Offline Promotional Kpi Metrics Dashboard To Analyze The Effectiveness Of New Portrait PDF
The following slide outlines key performance indicator KPI dashboard which can be used to measure the success of product launch. The KPIs are total units, revenue, average selling price ASP, number of penetrated planned customers etc. From laying roadmaps to briefing everything in detail, our templates are perfect for you. You can set the stage with your presentation slides. All you have to do is download these easy-to-edit and customizable templates. Effective Online And Offline Promotional Kpi Metrics Dashboard To Analyze The Effectiveness Of New Portrait PDF will help you deliver an outstanding performance that everyone would remember and praise you for. Do download this presentation today.
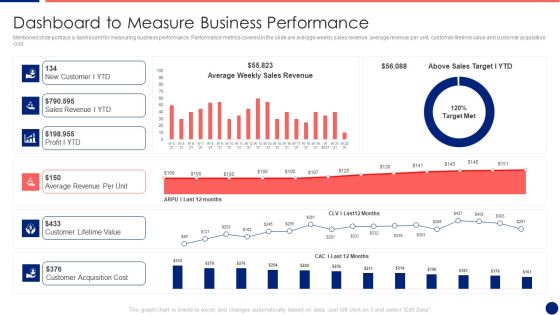
Information Technology Service Integration Post Acquisition Merger Dashboard To Measure Business Pictures PDF
Mentioned slide portrays a dashboard for measuring business performance. Performance metrics covered in the slide are average weekly sales revenue, average revenue per unit, customer lifetime value and customer acquisition cost. Deliver and pitch your topic in the best possible manner with this information technology service integration post acquisition merger dashboard to measure business pictures pdf. Use them to share invaluable insights on sales revenue, average, cost and impress your audience. This template can be altered and modified as per your expectations. So, grab it now.
Market Evaluation Of IT Industry Marketing Campaign Dashboard For B2b Marketers Icons PDF
The following slide showcases key performance indicator KPI dashboard that can assist managers to evaluate digital marketing campaign performance. The key metrics mentioned in the slide are click through rate CTR, conversion rate, cost per click CPC, etc. Make sure to capture your audiences attention in your business displays with our gratis customizable Market Evaluation Of IT Industry Marketing Campaign Dashboard For B2b Marketers Icons PDF. These are great for business strategies, office conferences, capital raising or task suggestions. If you desire to acquire more customers for your tech business and ensure they stay satisfied, create your own sales presentation with these plain slides.

Direct Marketing Techniques To Enhance Business Presence Social Media Marketing Dashboard To Evaluate Rules PDF
The purpose of this slide is to highlight key performance indicator KPI dashboard which will assist marketers to analyze company performance across social media platforms. The kpis outlined in slide are social media followers, page likes, etc. Make sure to capture your audiences attention in your business displays with our gratis customizable Direct Marketing Techniques To Enhance Business Presence Social Media Marketing Dashboard To Evaluate Rules PDF. These are great for business strategies, office conferences, capital raising or task suggestions. If you desire to acquire more customers for your tech business and ensure they stay satisfied, create your own sales presentation with these plain slides.
SAC Planning And Implementation SAP Analytics Cloud Dashboard For Product Sales Analysis Icons PDF
This slide illustrates the SAP Analytics Cloud dashboard to monitor product sales performance. It provides information regarding the gross margin and net revenue earned, product performance state wise and year wise. Deliver and pitch your topic in the best possible manner with this SAC Planning And Implementation SAP Analytics Cloud Dashboard For Product Sales Analysis Icons PDF. Use them to share invaluable insights on Gross Margin, Earned Quarter Wise, Gross Margin, Net Revenue and impress your audience. This template can be altered and modified as per your expectations. So, grab it now.

Dashboard To Compare Google Adwords Strategic Campaign With Facebook Microsoft PDF
This slide showcases KPI dashboard to compare performance of google adwords campaign to identify the most efficient one. It includes KPIs such as cost, conversions, channel performance overview, clicks, impressions, etc. Showcasing this set of slides titled Dashboard To Compare Google Adwords Strategic Campaign With Facebook Microsoft PDF. The topics addressed in these templates are Cost, Conversions, Revenue. All the content presented in this PPT design is completely editable. Download it and make adjustments in color, background, font etc. as per your unique business setting.

Business Profitability And Growth Dashboard For Capital Fundraising Ppt Slides Guide PDF
This slide illustrates graphical representation of company growth journey for investors. It includes profitability graph of 15 years, cash usage pie-chart, and share performance line graph. Showcasing this set of slides titled Business Profitability And Growth Dashboard For Capital Fundraising Ppt Slides Guide PDF. The topics addressed in these templates are Judicious Cash Usage, Share Performance, Respect To Benchmark. All the content presented in this PPT design is completely editable. Download it and make adjustments in color, background, font etc. as per your unique business setting.
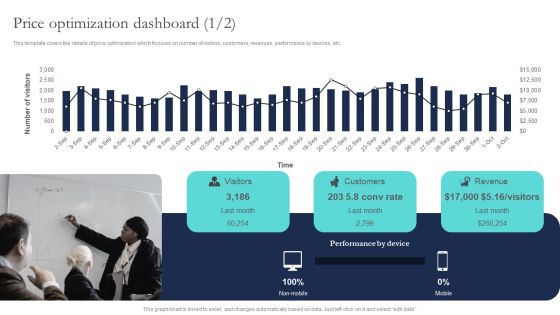
Optimizing Smart Pricing Tactics To Improve Sales Price Optimization Dashboard Infographics PDF
This template covers the details of price optimization which focuses on number of visitors, customers, revenues, performance by devices, etc. From laying roadmaps to briefing everything in detail, our templates are perfect for you. You can set the stage with your presentation slides. All you have to do is download these easy to edit and customizable templates. Optimizing Smart Pricing Tactics To Improve Sales Price Optimization Dashboard Infographics PDF will help you deliver an outstanding performance that everyone would remember and praise you for. Do download this presentation today.

Customer Retention With Email Advertising Campaign Plan KPI Dashboard To Monitor Email Marketing Structure PDF
Mentioned slide demonstrates KPI showcasing email marketing performance which can be used by businesses to determine organisation future growth opportunities. It includes key performance indictors such as conversion rate, open rate, click through rate, bounce rate, and email list growth rate. Make sure to capture your audiences attention in your business displays with our gratis customizable Customer Retention With Email Advertising Campaign Plan KPI Dashboard To Monitor Email Marketing Structure PDF. These are great for business strategies, office conferences, capital raising or task suggestions. If you desire to acquire more customers for your tech business and ensure they stay satisfied, create your own sales presentation with these plain slides.
Sales Process Catalogue Template Sales Management Activities Tracking Dashboard Summary PDF
This slide provides information regarding various metrics catered to track sales team performance in terms of average revenue per account, win rate, NPS, along with sales representative performance tracking through number of opportunities created, lead response time, etc. Deliver an awe inspiring pitch with this creative sales process catalogue template sales management activities tracking dashboard summary pdf bundle. Topics like sales pipeline, sales activity by sales rep, sales pipeline by sales rep, closed business, month over month growth, forecast by month can be discussed with this completely editable template. It is available for immediate download depending on the needs and requirements of the user.
Marketing Playbook To Maximize ROI Sales Management Activities Tracking Dashboard Guidelines PDF
This slide provides information regarding various metrics catered to track sales team performance in terms of average revenue per account, win rate, NPS, along with sales representative performance tracking through number of opportunities created, lead response time, etc. Deliver and pitch your topic in the best possible manner with this marketing playbook to maximize roi sales management activities tracking dashboard guidelines pdf. Use them to share invaluable insights on closed business, sales pipeline, month over month growth, sales activity by sales rep and impress your audience. This template can be altered and modified as per your expectations. So, grab it now.

 Home
Home