Financial Metrics

How To Build A Revenue Funnel Present Performance Delivery Gap Formats PDF
This slide provides information regarding the present delivery gap that firm is facing in terms of its performance as compared to the industry standards. The firms performance is assessed on metrics such as response rate, forecast accuracy, lead qualification rate, etc. Deliver an awe inspiring pitch with this creative how to build a revenue funnel present performance delivery gap formats pdf bundle. Topics like present performance delivery gap can be discussed with this completely editable template. It is available for immediate download depending on the needs and requirements of the user.

Sales Funnel Management For Revenue Generation Addressing Present Performance Delivery Gap Pictures PDF
This slide provides information regarding the present delivery gap that firm is facing in terms of its performance as compared to the industry standards. The firms performance is assessed on metrics such as response rate, forecast accuracy, lead qualification rate, etc. Deliver and pitch your topic in the best possible manner with this sales funnel management for revenue generation addressing present performance delivery gap pictures pdf Use them to share invaluable insights on marketing effectiveness, lead qualification rate, sales effectiveness and impress your audience. This template can be altered and modified as per your expectations. So, grab it now.
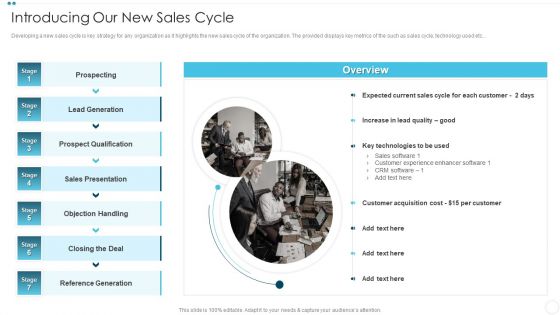
Company Sales Lead Qualification Procedure To Enhance Revenue Introducing Our New Sales Cycle Ideas PDF
Developing a new sales cycle is key strategy for any organization as it highlights the new sales cycle of the organization. The provided displays key metrics of the such as sales cycle, technology used etc.Deliver an awe inspiring pitch with this creative Company Sales Lead Qualification Procedure To Enhance Revenue Introducing Our New Sales Cycle Ideas PDF bundle. Topics like Lead Generation, Prospect Qualification, Sales Presentation can be discussed with this completely editable template. It is available for immediate download depending on the needs and requirements of the user.
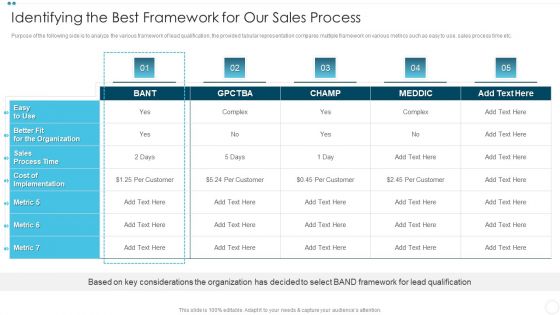
Company Sales Lead Qualification Procedure To Enhance Revenue Identifying The Best Framework Themes PDF
Purpose of the following side is to analyze the various framework of lead qualification, the provided tabular representation compares multiple framework on various metrics such as easy to use, sales process time etc. Deliver an awe inspiring pitch with this creative Company Sales Lead Qualification Procedure To Enhance Revenue Identifying The Best Framework Themes PDF bundle. Topics like Cost Implementation, Sales Process, Considerations The Organization can be discussed with this completely editable template. It is available for immediate download depending on the needs and requirements of the user.

Stock Market Analysis Dashboard With Market Capitalization And Net Profit Elements PDF
Following slide showcase comprehensive stock market dashboard which will assist companies for the comparison purpose. The metrics covered in the slide are top stocks by market capitalization, EPS, net profit and PE ratio. Pitch your topic with ease and precision using this Stock Market Analysis Dashboard With Market Capitalization And Net Profit Elements PDF. This layout presents information on Company, Net Profit, Market Capitalization. It is also available for immediate download and adjustment. So, changes can be made in the color, design, graphics or any other component to create a unique layout.
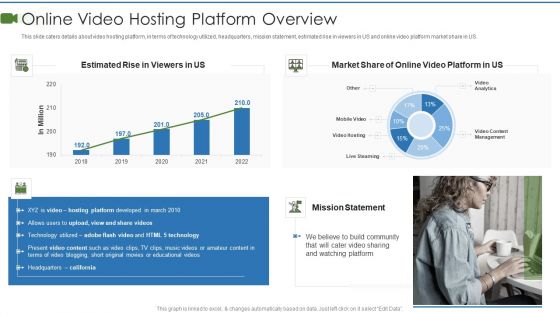
Private Video Streaming Platform Capital Fundraising Pitch Deck Online Video Hosting Platform Summary PDF
This slide caters details about video hosting platform, in terms of technology utilized, headquarters, mission statement, estimated rise in viewers in US and online video platform market share in US. Deliver and pitch your topic in the best possible manner with this private video streaming platform capital fundraising pitch deck key statistics associated to video mockup pdf. Use them to share invaluable insights on private video streaming platform capital fundraising pitch deck various metrics determining download pdf and impress your audience. This template can be altered and modified as per your expectations. So, grab it now.
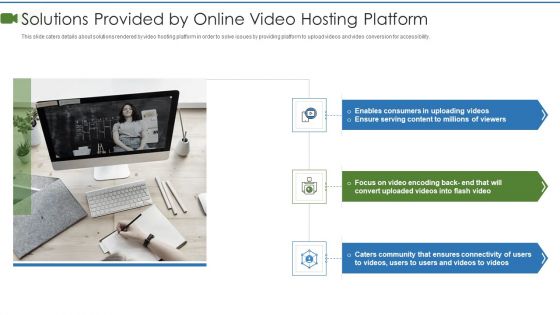
Private Video Streaming Platform Capital Fundraising Pitch Deck Solutions Provided By Online Themes PDF
This slide caters details about solutions rendered by video hosting platform in order to solve issues by providing platform to upload videos and video conversion for accessibility. This is a private video streaming platform capital fundraising pitch deck solutions provided by online themes pdf template with various stages. Focus and dispense information on three stages using this creative set, that comes with editable features. It contains large content boxes to add your information on topics like private video streaming platform capital fundraising pitch deck various metrics determining download pdf. You can also showcase facts, figures, and other relevant content using this PPT layout. Grab it now.
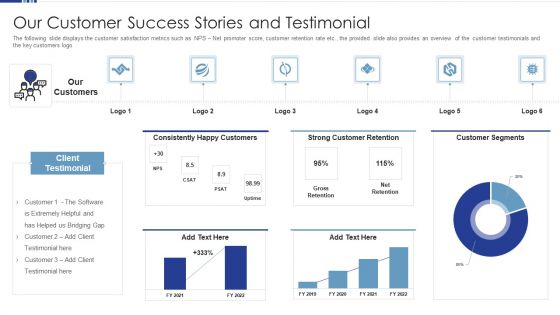
HR Software Solution Capital Funding Pitch Deck Our Customer Success Stories And Testimonial Mockup PDF
The following slide displays the customer satisfaction metrics such as NPS Net promoter score, customer retention rate etc, the provided slide also provides an overview of the customer testimonials and the key customers logo Deliver an awe inspiring pitch with this creative hr software solution capital funding pitch deck our customer success stories and testimonial mockup pdf bundle. Topics like consistently happy customers, strong customer retention, customer segments can be discussed with this completely editable template. It is available for immediate download depending on the needs and requirements of the user.
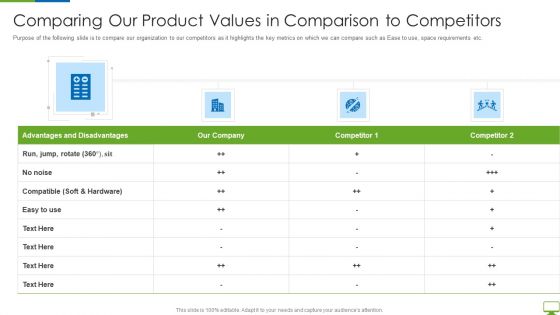
Cyber Network Simulation Platform Capital Funding Pitch Deck Comparing Our Product Values Portrait PDF
Purpose of the following slide is to compare our organization to our competitors as it highlights the key metrics on which we can compare such as Ease to use, space requirements etc. Deliver and pitch your topic in the best possible manner with this cyber network simulation platform capital funding pitch deck comparing our product values portrait pdf Use them to share invaluable insights on comparing our product values in comparison to competitors and impress your audience. This template can be altered and modified as per your expectations. So, grab it now.

Facebook Original Capital Funding Key Statistics Of Facebook Site Usage Topics PDF
This slide provides details of the Facebook site usage using metrics such as daily unique users, monthly unique users, and daily traffic in page views. It also includes information regarding the total number of students that are using the social networking site. Presenting facebook original capital funding key statistics of facebook site usage topics pdf to provide visual cues and insights. Share and navigate important information on three stages that need your due attention. This template can be used to pitch topics like key statistics of facebook site usage. In addtion, this PPT design contains high resolution images, graphics, etc, that are easily editable and available for immediate download.
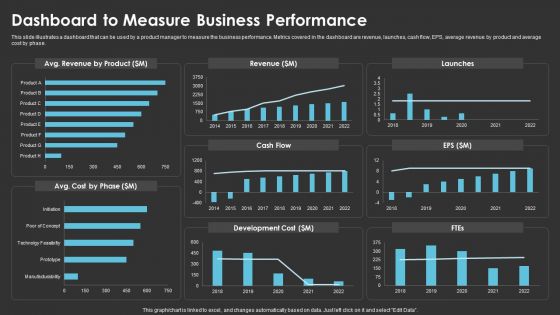
Method To Introduce New Product Offerings In The Industry Dashboard To Measure Business Performance Pictures PDF
This slide illustrates a dashboard that can be used by a product manager to measure the business performance. Metrics covered in the dashboard are revenue, launches, cash flow, EPS, average revenue by product and average cost by phase. Deliver and pitch your topic in the best possible manner with this Method To Introduce New Product Offerings In The Industry Dashboard To Measure Business Performance Pictures PDF. Use them to share invaluable insights on Revenue, Cash Flow, Development Cost and impress your audience. This template can be altered and modified as per your expectations. So, grab it now.
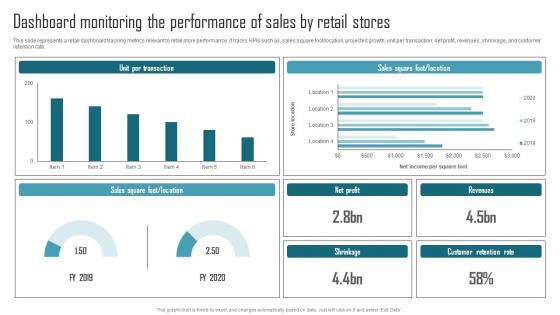
Effective Product Adaptation Dashboard Monitoring The Performance Of Sales By Retail Stores Designs PDF
This slide represents a retail dashboard tracking metrics relevant to retail store performance. It tracks KPIs such as, sales square footlocation, projected growth, unit per transaction, net profit, revenues, shrinkage, and customer retention rate. If your project calls for a presentation, then Slidegeeks is your go-to partner because we have professionally designed, easy-to-edit templates that are perfect for any presentation. After downloading, you can easily edit Effective Product Adaptation Dashboard Monitoring The Performance Of Sales By Retail Stores Designs PDF and make the changes accordingly. You can rearrange slides or fill them with different images. Check out all the handy templates
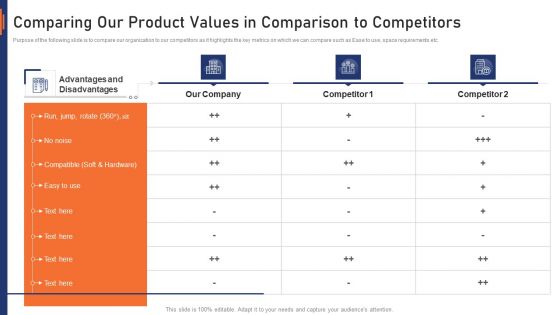
VR Market Capital Raising Elevator Pitch Deck Comparing Our Product Values In Comparison To Competitors Clipart PDF
Purpose of the following slide is to compare our organization to our competitors as it highlights the key metrics on which we can compare such as Ease to use, space requirements etc. Deliver an awe inspiring pitch with this creative vr market capital raising elevator pitch deck comparing our product values in comparison to competitors clipart pdf bundle. Topics like comparing our product values in comparison to competitors can be discussed with this completely editable template. It is available for immediate download depending on the needs and requirements of the user.
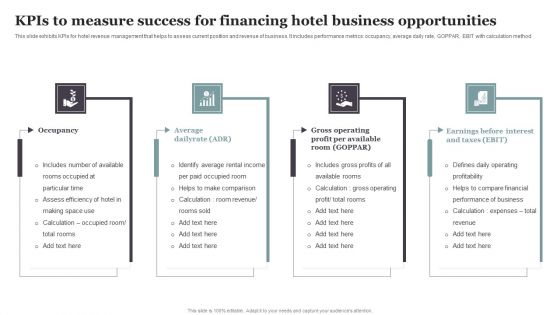
Kpis To Measure Success For Financing Hotel Business Opportunities Professional PDF
This slide exhibits KPIs for hotel revenue management that helps to assess current position and revenue of business. It includes performance metrics occupancy, average daily rate, GOPPAR, EBIT with calculation method. Presenting Kpis To Measure Success For Financing Hotel Business Opportunities Professional PDF to dispense important information. This template comprises Four stages. It also presents valuable insights into the topics including Occupancy, Average Dailyrate, Gross Operating. This is a completely customizable PowerPoint theme that can be put to use immediately. So, download it and address the topic impactfully.

Dashboard To Measure Business Performance Creating And Offering Multiple Product Ranges In New Business Introduction PDF
This slide illustrates a dashboard that can be used by a product manager to measure the business performance. Metrics covered in the dashboard are revenue, launches, cash flow, EPS, average revenue by product and average cost by phase.There are so many reasons you need a Dashboard To Measure Business Performance Creating And Offering Multiple Product Ranges In New Business Introduction PDF. The first reason is you can notspend time making everything from scratch, Thus, Slidegeeks has made presentation templates for you too. You can easily download these templates from our website easily.

Generic Growth Playbook How To Measure The Product Performance Topics PDF
Purpose of the following slide is to show multiple metrics that the organization can use to track performance of their product, these can be revenue generated, unit sold and purchase value etc.This is a generic growth playbook how to measure the product performance topics pdf template with various stages. Focus and dispense information on three stages using this creative set, that comes with editable features. It contains large content boxes to add your information on topics like revenues generated, purchase value, generated by the product You can also showcase facts, figures, and other relevant content using this PPT layout. Grab it now.

How To Measure The Product Performance Strategic Playbook For Internal Sales Advancement Designs PDF
Purpose of the following slide is to show multiple metrics that the organization can use to track performance of their product, these can be revenue generated, unit sold and purchase value etc.Presenting How To Measure The Product Performance Strategic Playbook For Internal Sales Advancement Designs PDF to provide visual cues and insights. Share and navigate important information on one stage that need your due attention. This template can be used to pitch topics like Revenues Generated, Purchase Value, Value Product. In addtion, this PPT design contains high resolution images, graphics, etc, that are easily editable and available for immediate download.
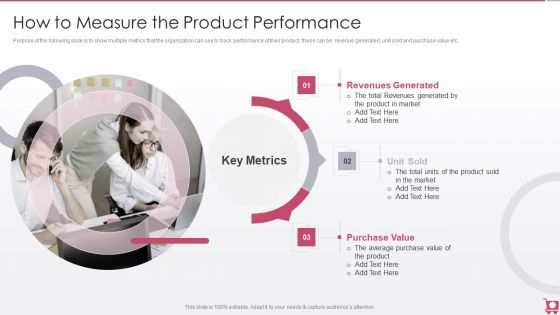
Playbook For Sales Growth Strategies How To Measure The Product Performance Mockup PDF
Purpose of the following slide is to show multiple metrics that the organization can use to track performance of their product, these can be revenue generated, unit sold and purchase value etc. This is a Playbook For Sales Growth Strategies How To Measure The Product Performance Mockup PDF template with various stages. Focus and dispense information on three stages using this creative set, that comes with editable features. It contains large content boxes to add your information on topics like Revenues Generated, Unit Sold, Purchase Value. You can also showcase facts, figures, and other relevant content using this PPT layout. Grab it now.

Promoting Growth Internal Operations Techniques Playbook How To Measure The Product Performance Ideas PDF
Purpose of the following slide is to show multiple metrics that the organization can use to track performance of their product, these can be revenue generated, unit sold and purchase value etc. This is a Promoting Growth Internal Operations Techniques Playbook How To Measure The Product Performance Ideas PDF template with various stages. Focus and dispense information on three stages using this creative set, that comes with editable features. It contains large content boxes to add your information on topics like Unit Sold, Revenues Generated, Purchase Value. You can also showcase facts, figures, and other relevant content using this PPT layout. Grab it now.
Kpis To Measure Display Ads Performance Ppt PowerPoint Presentation File Icon PDF
The following slide presents various metrics to analyze and measure performance of display advertisements. It provides information about KPIs such as display impressions, display reach, display click through rate and conversion rate. qMake sure to capture your audiences attention in your business displays with our gratis customizable Kpis To Measure Display Ads Performance Ppt PowerPoint Presentation File Icon PDF. These are great for business strategies, office conferences, capital raising or task suggestions. If you desire to acquire more customers for your tech business and ensure they stay satisfied, create your own sales presentation with these plain slides.
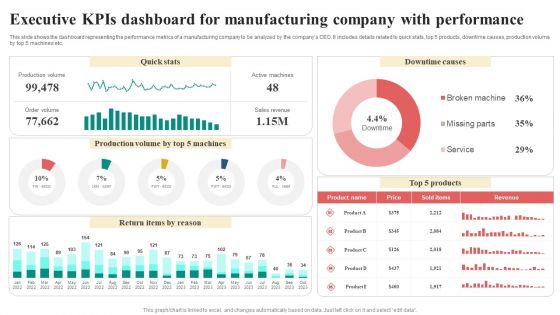
Executive Kpis Dashboard For Manufacturing Company With Performance Infographics PDF
This slide shows the dashboard representing the performance metrics of a manufacturing company to be analyzed by the companys CEO. It includes details related to quick stats, top 5 products, downtime causes, production volume by top 5 machines etc. Showcasing this set of slides titled Executive Kpis Dashboard For Manufacturing Company With Performance Infographics PDF. The topics addressed in these templates are Return Items By Reason, Quick Stats, Downtime Causes, Revenue. All the content presented in this PPT design is completely editable. Download it and make adjustments in color, background, font etc. as per your unique business setting.

Competitor Analysis International Trade Of Products And Services PPT Sample CP SS V
This slide showcases the Alibaba competitors comparison. It includes key metrics such as number of employees, founding year, valuation, revenue, net income, cost of goods, gross profit and number of stores. From laying roadmaps to briefing everything in detail, our templates are perfect for you. You can set the stage with your presentation slides. All you have to do is download these easy-to-edit and customizable templates. Competitor Analysis International Trade Of Products And Services PPT Sample CP SS V will help you deliver an outstanding performance that everyone would remember and praise you for. Do download this presentation today.
Monthly Sales Performance Tracking And Monitoring Dashboard Diagrams PDF
This slide showcases a dashboard presenting various metrics to measure and analyze sales performance for revenue growth. It includes key components such as number of sales, revenue, profit, cost, sales revenue, sales increment, cost analysis and cross sell. Make sure to capture your audiences attention in your business displays with our gratis customizable Monthly Sales Performance Tracking And Monitoring Dashboard Diagrams PDF. These are great for business strategies, office conferences, capital raising or task suggestions. If you desire to acquire more customers for your tech business and ensure they stay satisfied, create your own sales presentation with these plain slides.
Monthly Sales Performance Tracking And Monitoring Dashboard Designs PDF
This slide showcases a dashboard presenting various metrics to measure and analyze sales performance for revenue growth. It includes key components such as number of sales, revenue, profit, cost, sales revenue, sales increment, cost analysis and cross sell. Make sure to capture your audiences attention in your business displays with our gratis customizable Monthly Sales Performance Tracking And Monitoring Dashboard Designs PDF. These are great for business strategies, office conferences, capital raising or task suggestions. If you desire to acquire more customers for your tech business and ensure they stay satisfied, create your own sales presentation with these plain slides.

Creating New Product Launch Campaign Strategy Dashboard To Measure Sales Rep Performance Introduction PDF
This slide illustrates sales representative performance measurement dashboard with key metrics such as average first contact resolution rate, occupancy rate, NPS and top agents by solved tickets. Make sure to capture your audiences attention in your business displays with our gratis customizable Creating New Product Launch Campaign Strategy Dashboard To Measure Sales Rep Performance Introduction PDF. These are great for business strategies, office conferences, capital raising or task suggestions. If you desire to acquire more customers for your tech business and ensure they stay satisfied, create your own sales presentation with these plain slides.

Inspecting Sales Optimization Areas Sales Analysis Dashboard To Measure Performance Demonstration PDF
This slide showcases a dashboard presenting various metrics to measure and analyze sales performance for revenue growth. It includes key components such as number of annual new customer, sales revenue, customer satisfaction, customer acquisition cost, product wise sales, month wise sales and sales comparison. From laying roadmaps to briefing everything in detail, our templates are perfect for you. You can set the stage with your presentation slides. All you have to do is download these easy-to-edit and customizable templates. Inspecting Sales Optimization Areas Sales Analysis Dashboard To Measure Performance Demonstration PDF will help you deliver an outstanding performance that everyone would remember and praise you for. Do download this presentation today.
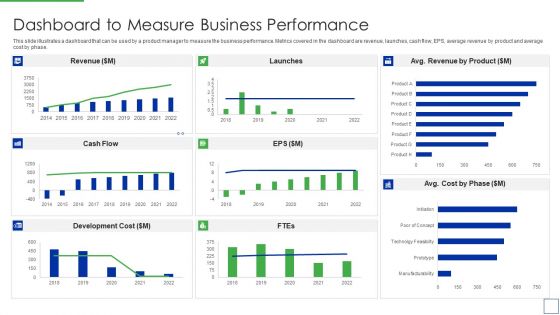
Product Portfolio Management For New Target Region Dashboard To Measure Business Rules PDF
This slide illustrates a dashboard that can be used by a product manager to measure the business performance. Metrics covered in the dashboard are revenue, launches, cash flow, EPS, average revenue by product and average cost by phase.Deliver and pitch your topic in the best possible manner with this Product Portfolio Management For New Target Region Dashboard To Measure Business Rules PDF Use them to share invaluable insights on Dashboard to Measure Business Performance and impress your audience. This template can be altered and modified as per your expectations. So, grab it now.
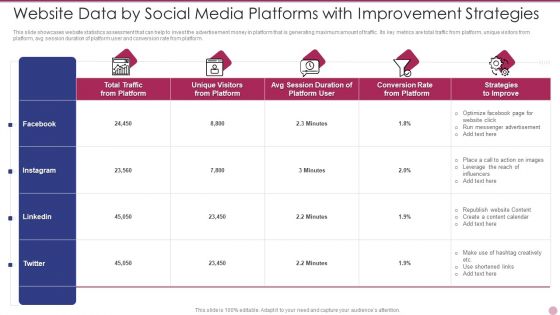
Website Data By Social Media Platforms With Improvement Strategies Diagrams PDF
This slide showcases website statistics assessment that can help to invest the advertisement money in platform that is generating maximum amount of traffic. Its key metrics are total traffic from platform, unique visitors from platform, avg session duration of platform user and conversion rate from platform. Showcasing this set of slides titled Website Data By Social Media Platforms With Improvement Strategies Diagrams PDF. The topics addressed in these templates are Strategies To Improve, Advertisement, Optimize. All the content presented in this PPT design is completely editable. Download it and make adjustments in color, background, font etc. as per your unique business setting.
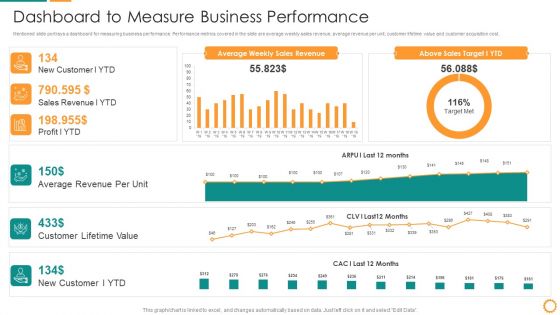
IT Consolidation Post Mergers And Acquisition Dashboard To Measure Business Performance Clipart PDF
Mentioned slide portrays a dashboard for measuring business performance. Performance metrics covered in the slide are average weekly sales revenue, average revenue per unit, customer lifetime value and customer acquisition cost. Deliver and pitch your topic in the best possible manner with this IT Consolidation Post Mergers And Acquisition Dashboard To Measure Business Performance Clipart PDF. Use them to share invaluable insights on Average Revenue, Customer Lifetime Value, Sales Revenue, Sales Target and impress your audience. This template can be altered and modified as per your expectations. So, grab it now.

Business Performance Review Dashboard To Measure Overall Business Performance Formats PDF
The following slide highlights a comprehensive quarterly business review QBR dashboard which can be used by the organization to evaluate business performance. The metrics used for review are total revenue, new customers, gross profit, overall costs, sales comparison, sales by different products and top performing channels. Showcasing this set of slides titled Business Performance Review Dashboard To Measure Overall Business Performance Formats PDF. The topics addressed in these templates are Sales Comparison, Sales Product, High Performing. All the content presented in this PPT design is completely editable. Download it and make adjustments in color, background, font etc. as per your unique business setting.
Performance Analysis Of New Product Development Product Performance Dashboards Icons PDF
The following slide displays the dashboard which highlights the performance of the product, multiple metrics such as Revenues, New customer, gross profit, customer satisfaction and global sales breakdown. Deliver and pitch your topic in the best possible manner with this performance analysis of new product development product performance dashboards icons pdf. Use them to share invaluable insights on revenue, sales comparison, customer satisfaction, gross profit, new customers, sale by product category and impress your audience. This template can be altered and modified as per your expectations. So, grab it now.
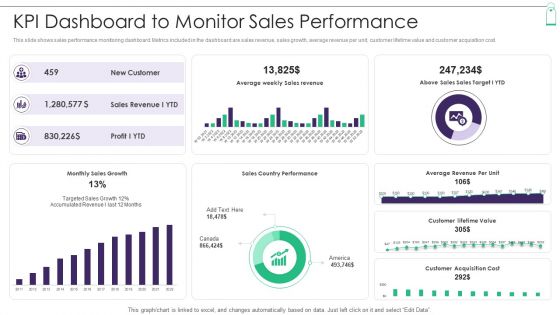
New Product Sales Strategy And Marketing KPI Dashboard To Monitor Sales Performance Information PDF
This slide shows sales performance monitoring dashboard. Metrics included in the dashboard are sales revenue, sales growth, average revenue per unit, customer lifetime value and customer acquisition cost. Deliver an awe inspiring pitch with this creative New Product Sales Strategy And Marketing KPI Dashboard To Monitor Sales Performance Information PDF bundle. Topics like Sales Revenue, Monthly Sales Growth, Sales Country Performance can be discussed with this completely editable template. It is available for immediate download depending on the needs and requirements of the user.

IT Service Incorporation And Administration Dashboard To Measure Business Performance Portrait PDF
Mentioned slide portrays a dashboard for measuring business performance. Performance metrics covered in the slide are average weekly sales revenue, average revenue per unit, customer lifetime value and customer acquisition cost. Deliver and pitch your topic in the best possible manner with this it service incorporation and administration dashboard to measure business performance portrait pdf. Use them to share invaluable insights on sales, revenue, target, acquisition cost and impress your audience. This template can be altered and modified as per your expectations. So, grab it now.
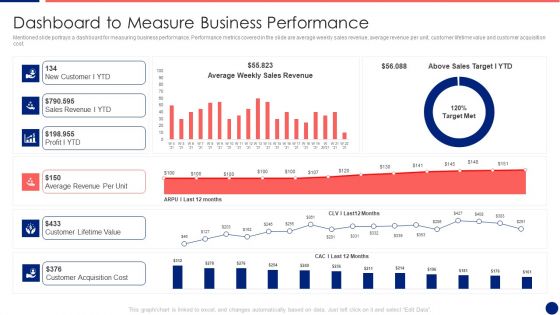
Information Technology Service Integration Post Acquisition Merger Dashboard To Measure Business Pictures PDF
Mentioned slide portrays a dashboard for measuring business performance. Performance metrics covered in the slide are average weekly sales revenue, average revenue per unit, customer lifetime value and customer acquisition cost. Deliver and pitch your topic in the best possible manner with this information technology service integration post acquisition merger dashboard to measure business pictures pdf. Use them to share invaluable insights on sales revenue, average, cost and impress your audience. This template can be altered and modified as per your expectations. So, grab it now.
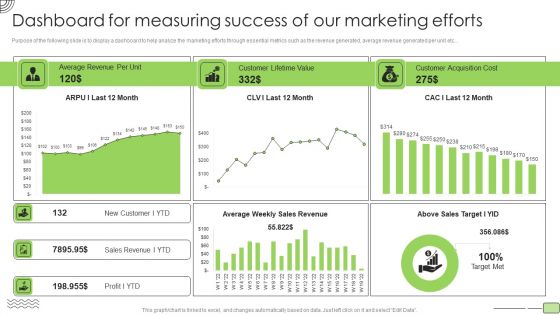
Organic Business Growth Strategies Dashboard For Measuring Success Of Our Marketing Efforts Diagrams PDF
Purpose of the following slide is to display a dashboard to help analyze the marketing efforts through essential metrics such as the revenue generated, average revenue generated per unit etc. Deliver an awe inspiring pitch with this creative Organic Business Growth Strategies Dashboard For Measuring Success Of Our Marketing Efforts Diagrams PDF bundle. Topics like Average Revenue, Customer Lifetime Value, Customer Acquisition Cost can be discussed with this completely editable template. It is available for immediate download depending on the needs and requirements of the user.
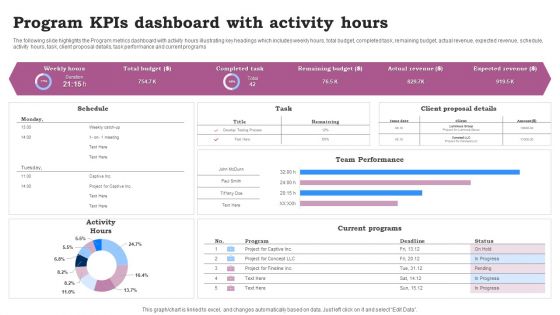
Program Kpis Dashboard With Activity Hours Ppt Infographics Clipart Images PDF
The following slide highlights the Program metrics dashboard with activity hours illustrating key headings which includes weekly hours, total budget, completed task, remaining budget, actual revenue, expected revenue, schedule, activity hours, task, client proposal details, task performance and current programs. Pitch your topic with ease and precision using this Program Kpis Dashboard With Activity Hours Ppt Infographics Clipart Images PDF. This layout presents information on Team Performance, Current Programs, Activity Hours. It is also available for immediate download and adjustment. So, changes can be made in the color, design, graphics or any other component to create a unique layout.

Effective Sales Plan For New Product Introduction In Market KPI Dashboard To Monitor Sales Performance Portrait PDF
This slide shows sales performance monitoring dashboard. Metrics included in the dashboard are sales revenue, sales growth, average revenue per unit, customer lifetime value and customer acquisition cost.Deliver an awe inspiring pitch with this creative Effective Sales Plan For New Product Introduction In Market KPI Dashboard To Monitor Sales Performance Portrait PDF bundle. Topics like Average Revenue, Country Performance, Customer Lifetime can be discussed with this completely editable template. It is available for immediate download depending on the needs and requirements of the user.
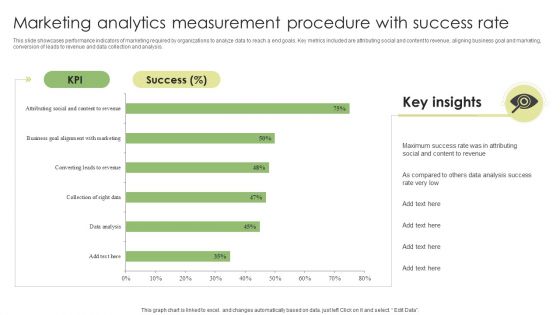
Marketing Analytics Measurement Procedure With Success Rate Guidelines PDF
This slide showcases performance indicators of marketing required by organizations to analyze data to reach a end goals. Key metrics included are attributing social and content to revenue, aligning business goal and marketing, conversion of leads to revenue and data collection and analysis. Showcasing this set of slides titled Marketing Analytics Measurement Procedure With Success Rate Guidelines PDF. The topics addressed in these templates areMarketing Analytics Measurement, Procedure With Success Rate. All the content presented in this PPT design is completely editable. Download it and make adjustments in color, background, font etc. as per your unique business setting.
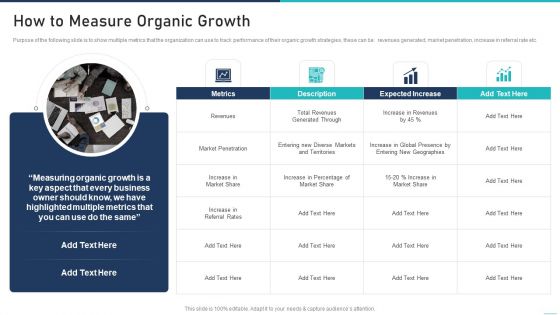
Generic Growth Playbook How To Measure Organic Growth Topics PDF
Purpose of the following slide is to show multiple metrics that the organization can use to track performance of their organic growth strategies, these can be revenues generated, market penetration, increase in referral rate etc.Deliver and pitch your topic in the best possible manner with this generic growth playbook how to measure organic growth topics pdf Use them to share invaluable insights on total revenues, increase in percentage, entering new geographies and impress your audience. This template can be altered and modified as per your expectations. So, grab it now.

Effective Company Event Communication Plan Email Marketing Action Steps And Best Practices Information PDF
This slide covers metrics for analyzing the event revenue and registrations. It includes KPIs such as gross revenue, gross revenue from promos, total refund, total registration, visits to purchase conversion, check-in- status, etc. Deliver and pitch your topic in the best possible manner with this Effective Company Event Communication Plan Email Marketing Action Steps And Best Practices Information PDF Use them to share invaluable insights on Registration Analysis, Revenue Analysis, Gross Revenue and impress your audience. This template can be altered and modified as per your expectations. So, grab it now.
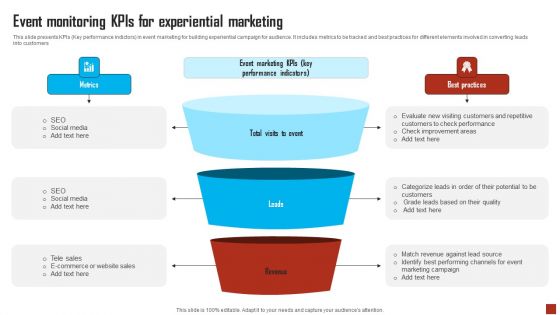
Event Monitoring Kpis For Experiential Marketing Topics PDF
This slide presents KPIs Key performance indictors in event marketing for building experiential campaign for audience. It includes metrics to be tracked and best practices for different elements involved in converting leads into customers. Presenting Event Monitoring Kpis For Experiential Marketing Topics PDF to dispense important information. This template comprises three stages. It also presents valuable insights into the topics including Revenue, Sales, E Commerce. This is a completely customizable PowerPoint theme that can be put to use immediately. So, download it and address the topic impactfully.
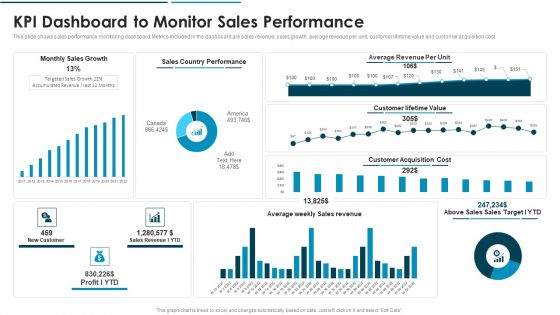
Go To Market Approach For New Product KPI Dashboard To Monitor Sales Performance Clipart PDF
This slide shows sales performance monitoring dashboard. Metrics included in the dashboard are sales revenue, sales growth, average revenue per unit, customer lifetime value and customer acquisition cost.Deliver and pitch your topic in the best possible manner with this Go To Market Approach For New Product KPI Dashboard To Monitor Sales Performance Clipart PDF Use them to share invaluable insights on Kpi Dashboard To Monitor Sales Performance and impress your audience. This template can be altered and modified as per your expectations. So, grab it now.
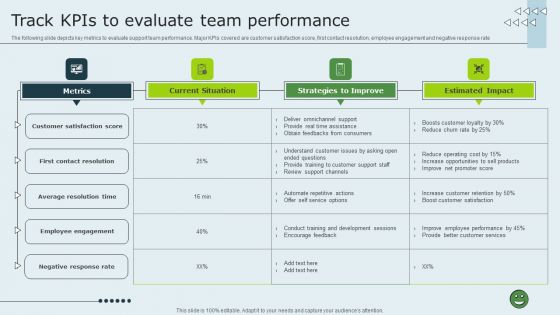
Enhancing Client Experience Track Kpis To Evaluate Team Performance Rules PDF
The following slide depicts key metrics to evaluate support team performance. Major KPIs covered are customer satisfaction score, first contact resolution, employee engagement and negative response rate. Make sure to capture your audiences attention in your business displays with our gratis customizable Enhancing Client Experience Track Kpis To Evaluate Team Performance Rules PDF. These are great for business strategies, office conferences, capital raising or task suggestions. If you desire to acquire more customers for your tech business and ensure they stay satisfied, create your own sales presentation with these plain slides.
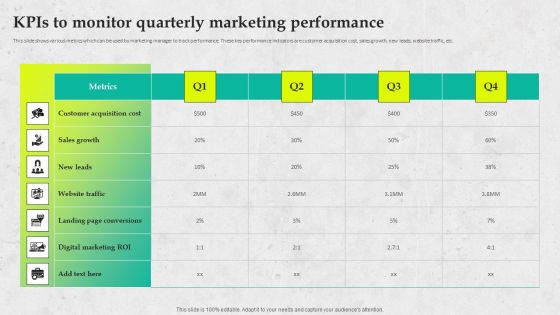
Service Promotion Plan Kpis To Monitor Quarterly Marketing Performance Diagrams PDF
This slide shows various metrics which can be used by marketing manager to track performance. These key performance indicators are customer acquisition cost, sales growth, new leads, website traffic, etc. Make sure to capture your audiences attention in your business displays with our gratis customizable Service Promotion Plan Kpis To Monitor Quarterly Marketing Performance Diagrams PDF. These are great for business strategies, office conferences, capital raising or task suggestions. If you desire to acquire more customers for your tech business and ensure they stay satisfied, create your own sales presentation with these plain slides.

Post Merger Information Technology Service Delivery Amalgamation KPI Dashboard To Measure Business Template PDF
Mentioned slide portrays a dashboard for measuring business performance. Performance metrics covered in the slide are average weekly sales revenue, average revenue per unit, customer lifetime value and customer acquisition cost. Deliver an awe inspiring pitch with this creative post merger information technology service delivery amalgamation kpi dashboard to measure business template pdf bundle. Topics like kpi dashboard to measure business performance can be discussed with this completely editable template. It is available for immediate download depending on the needs and requirements of the user.
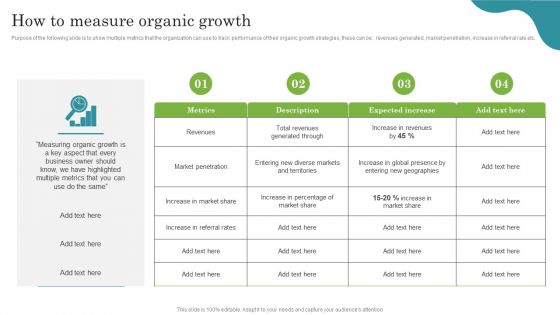
Promoting Growth Internal Operations Techniques Playbook How To Measure Organic Growth Elements PDF
Purpose of the following slide is to show multiple metrics that the organization can use to track performance of their organic growth strategies, these can be revenues generated, market penetration, increase in referral rate etc. Deliver and pitch your topic in the best possible manner with this Promoting Growth Internal Operations Techniques Playbook How To Measure Organic Growth Elements PDF. Use them to share invaluable insights on Measuring Organic Growth, Market Penetration, Revenues and impress your audience. This template can be altered and modified as per your expectations. So, grab it now.
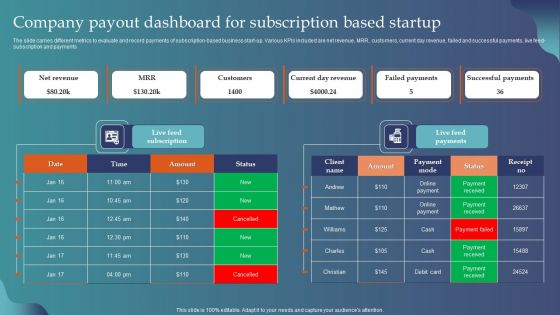
Company Payout Dashboard For Subscription Based Startup Designs PDF
The slide carries different metrics to evaluate and record payments of subscription-based business start-up. Various KPIs included are net revenue, MRR, customers, current day revenue, failed and successful payments, live feed- subscription and payments. Pitch your topic with ease and precision using this Company Payout Dashboard For Subscription Based Startup Designs PDF. This layout presents information on Net Revenue, MRR, Customers, Current Day Revenue. It is also available for immediate download and adjustment. So, changes can be made in the color, design, graphics or any other component to create a unique layout.
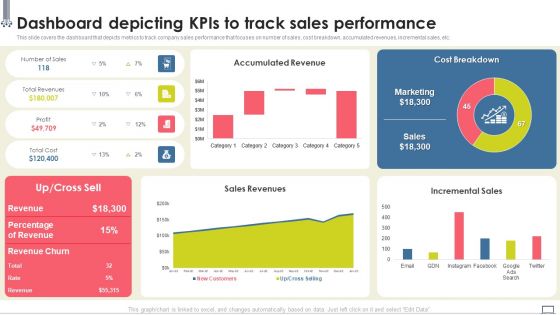
Change Management Strategy Dashboard Depicting Kpis To Track Sales Performance Ideas PDF
This slide covers the dashboard that depicts metrics to track company sales performance that focuses on number of sales, cost breakdown, accumulated revenues, incremental sales, etc. From laying roadmaps to briefing everything in detail, our templates are perfect for you. You can set the stage with your presentation slides. All you have to do is download these easy-to-edit and customizable templates. Change Management Strategy Dashboard Depicting Kpis To Track Sales Performance Ideas PDF will help you deliver an outstanding performance that everyone would remember and praise you for. Do download this presentation today.
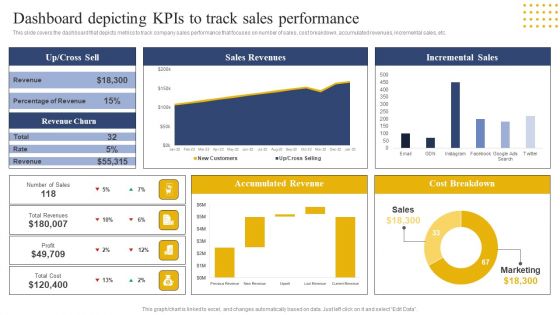
Transition Plan For Business Management Dashboard Depicting Kpis To Track Sales Performance Template PDF
This slide covers the dashboard that depicts metrics to track company sales performance that focuses on number of sales, cost breakdown, accumulated revenues, incremental sales, etc. From laying roadmaps to briefing everything in detail, our templates are perfect for you. You can set the stage with your presentation slides. All you have to do is download these easy-to-edit and customizable templates. Transition Plan For Business Management Dashboard Depicting Kpis To Track Sales Performance Template PDF will help you deliver an outstanding performance that everyone would remember and praise you for. Do download this presentation today.
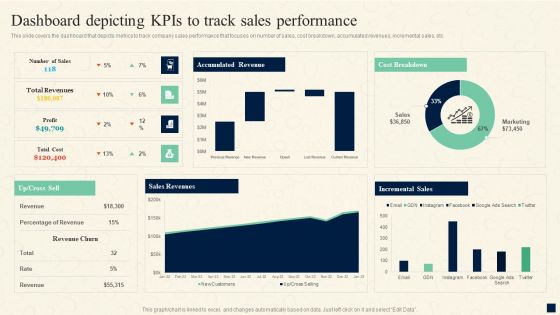
Change Management Process Dashboard Depicting Kpis To Track Sales Performance Introduction PDF
This slide covers the dashboard that depicts metrics to track company sales performance that focuses on number of sales, cost breakdown, accumulated revenues, incremental sales, etc. From laying roadmaps to briefing everything in detail, our templates are perfect for you. You can set the stage with your presentation slides. All you have to do is download these easy-to-edit and customizable templates. Change Management Process Dashboard Depicting Kpis To Track Sales Performance Introduction PDF will help you deliver an outstanding performance that everyone would remember and praise you for. Do download this presentation today.
Implementing Change Management Strategy To Transform Business Processes Dashboard Depicting Kpis To Track Icons PDF
This slide covers the dashboard that depicts metrics to track company sales performance that focuses on number of sales, cost breakdown, accumulated revenues, incremental sales, etc. Boost your pitch with our creative Implementing Change Management Strategy To Transform Business Processes Dashboard Depicting Kpis To Track Icons PDF. Deliver an awe-inspiring pitch that will mesmerize everyone. Using these presentation templates you will surely catch everyones attention. You can browse the ppts collection on our website. We have researchers who are experts at creating the right content for the templates. So you do not have to invest time in any additional work. Just grab the template now and use them.

Content Marketing Strategy Key Parameters To Measure Efficacy Of Content Strategy Sample PDF
This slide shows the key parameters to evaluate content efficacy across four phases such as educate, engage, convince and conversation with metrics like bounce rate, channel traffic, followers, subscribers, etc. Make sure to capture your audiences attention in your business displays with our gratis customizable Content Marketing Strategy Key Parameters To Measure Efficacy Of Content Strategy Sample PDF. These are great for business strategies, office conferences, capital raising or task suggestions. If you desire to acquire more customers for your tech business and ensure they stay satisfied, create your own sales presentation with these plain slides.

Supermarket Online Service Delivery And Management Dashboard Formats PDF
This slide shows the online grocery delivery dashboard of various products based on certain metrics and KPIs to achieve grocery retail revenue goals. It includes total orders, total customers total categories, and revenue. Showcasing this set of slides titled Supermarket Online Service Delivery And Management Dashboard Formats PDF. The topics addressed in these templates are Total Revenue, Total Customers, Dashboard. All the content presented in this PPT design is completely editable. Download it and make adjustments in color, background, font etc. as per your unique business setting.
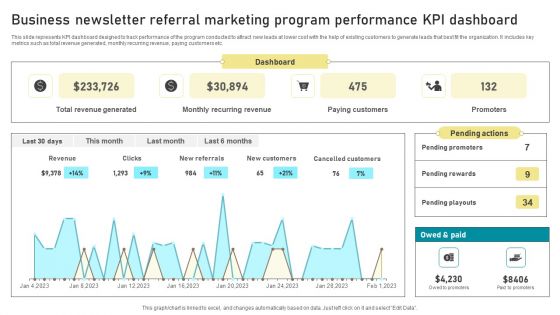
Business Newsletter Referral Marketing Program Performance KPI Dashboard Formats PDF
This slide represents KPI dashboard designed to track performance of the program conducted to attract new leads at lower cost with the help of existing customers to generate leads that best fit the organization. It includes key metrics such as total revenue generated, monthly recurring revenue, paying customers etc. Showcasing this set of slides titled Business Newsletter Referral Marketing Program Performance KPI Dashboard Formats PDF. The topics addressed in these templates are Dashboard, Paying Customers, Monthly Recurring Revenue, Total Revenue Generated. All the content presented in this PPT design is completely editable. Download it and make adjustments in color, background, font etc. as per your unique business setting.
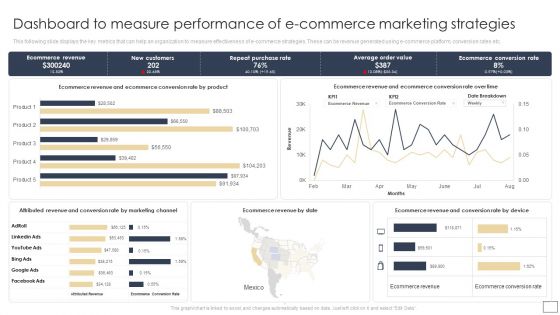
Dashboard To Measure Performance Of E Commerce Marketing Strategies Structure PDF
This following slide displays the key metrics that can help an organization to measure effectiveness of e-commerce strategies. These can be revenue generated using e-commerce platform, conversion rates etc.Create an editable Dashboard To Measure Performance Of E Commerce Marketing Strategies Structure PDF that communicates your idea and engages your audience. Whether you are presenting a business or an educational presentation, pre-designed presentation templates help save time. Dashboard To Measure Performance Of E Commerce Marketing Strategies Structure PDF is highly customizable and very easy to edit, covering many different styles from creative to business presentations. Slidegeeks has creative team members who have crafted amazing templates. So, go and get them without any delay.
Four Key Techniques To Measure Business Excellence Ppt Icon Inspiration PDF
This slide covers four diagnostics to measure commercial excellence. It includes tactics such as leadership team strategic alignment, asking for team suggestions, receiving feedback from right customers and use metrics beyond beyond revenue. Presenting Four Key Techniques To Measure Business Excellence Ppt Icon Inspiration PDF to dispense important information. This template comprises four stages. It also presents valuable insights into the topics including Leadership Team, Strategic Alignment, Feedback Right Customers. This is a completely customizable PowerPoint theme that can be put to use immediately. So, download it and address the topic impactfully.
Dashboard To Measure Performance Of E Commerce Retail Business Growth Marketing Techniques Icons PDF
This following slide displays the key metrics that can help an organization to measure effectiveness of e-commerce strategies. These can be revenue generated using e-commerce platform, conversion rates etc. If your project calls for a presentation, then Slidegeeks is your go to partner because we have professionally designed, easy to edit templates that are perfect for any presentation. After downloading, you can easily edit Dashboard To Measure Performance Of E Commerce Retail Business Growth Marketing Techniques Icons PDF and make the changes accordingly. You can rearrange slides or fill them with different images. Check out all the handy templates

How To Measure Organic Growth Strategic Playbook For Internal Sales Advancement Slides PDF
Purpose of the following slide is to show multiple metrics that the organization can use to track performance of their organic growth strategies, these can be revenues generated, market penetration, increase in referral rate etc.Deliver and pitch your topic in the best possible manner with this How To Measure Organic Growth Strategic Playbook For Internal Sales Advancement Slides PDF. Use them to share invaluable insights on Expected Increase, Entering Geographies, Increase Percentage and impress your audience. This template can be altered and modified as per your expectations. So, grab it now.

List Of Team Objectives For Organizational Success Ideas PDF
This slide showcases list of KPIs for companys successful working and growth. Key metrics covered are increase in revenue, productivity, customer retention and decrease in defects, schedule variance and cost. Showcasing this set of slides titled List Of Team Objectives For Organizational Success Ideas PDF. The topics addressed in these templates are Sales Team, Recurring Revenue, Goal. All the content presented in this PPT design is completely editable. Download it and make adjustments in color, background, font etc. as per your unique business setting.

Transportation And Logistics Services Company Profile Competitor Comparison By Operations Inspiration PDF
The slide showcases the competitor comparison by operations and revenue. It depicts comparison metrics which includes service coverage, fleet size, order size, total deliveries, workforce, revenue and net profit. Deliver and pitch your topic in the best possible manner with this Transportation And Logistics Services Company Profile Competitor Comparison By Operations Inspiration PDF. Use them to share invaluable insights on Service Coverage, Fleet Size, Workforce, Order Size, Revenue and impress your audience. This template can be altered and modified as per your expectations. So, grab it now.

 Home
Home