Financial Metrics
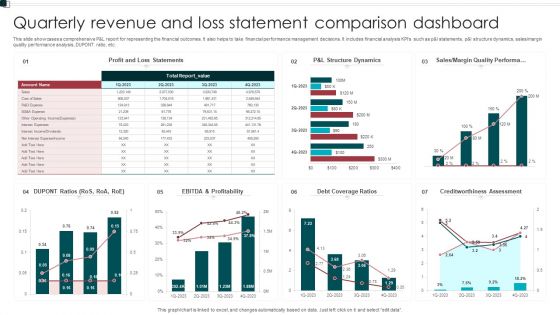
Quarterly Revenue And Loss Statement Comparison Dashboard Portrait PDF
This slide showcases a comprehensive P and L report for representing the financial outcomes. It also helps to take financial performance management decisions. It includes financial analysis KPIs such as p and l statements, p and l structure dynamics, sales or margin quality performance analysis, DUPONT ratio, etc. Showcasing this set of slides titled Quarterly Revenue And Loss Statement Comparison Dashboard Portrait PDF. The topics addressed in these templates are Profitability, Debt Coverage Ratios, Margin Quality Performa. All the content presented in this PPT design is completely editable. Download it and make adjustments in color, background, font etc. as per your unique business setting.

Essentials Of Statistics For Business And Economics Ppt Powerpoint Presentation Pictures Styles
This is a essentials of statistics for business and economics ppt powerpoint presentation pictures styles. This is a three stage process. The stages in this process are business metrics, business kpi, business dashboard.

Calculator With Business Reports For Operational Efficiency Ppt Powerpoint Presentation Ideas Infographic Template
This is a calculator with business reports for operational efficiency ppt powerpoint presentation ideas infographic template. This is a four stage process. The stages in this process are business metrics, business kpi, business dashboard.
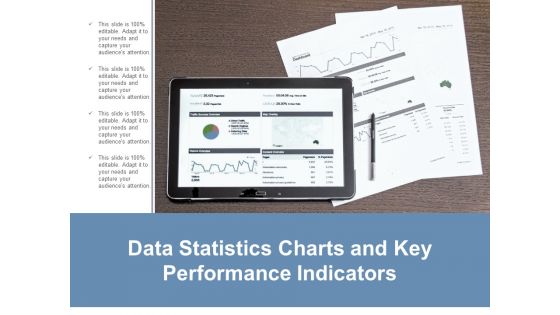
Data Statistics Charts And Key Performance Indicators Ppt Powerpoint Presentation Layouts Guide
This is a data statistics charts and key performance indicators ppt powerpoint presentation layouts guide. This is a four stage process. The stages in this process are business metrics, business kpi, business dashboard.
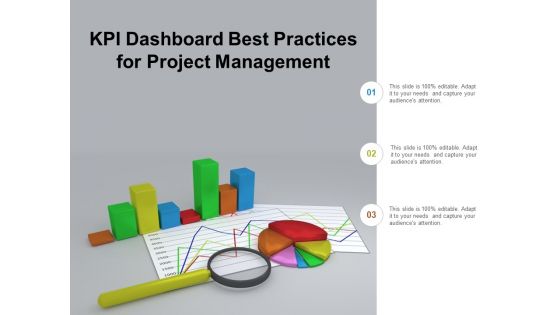
Kpi Dashboard Best Practices For Project Management Ppt Powerpoint Presentation Outline Samples
This is a kpi dashboard best practices for project management ppt powerpoint presentation outline samples. This is a three stage process. The stages in this process are business metrics, business kpi, business dashboard.
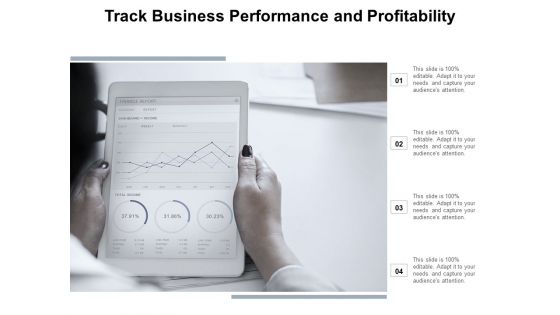
Track Business Performance And Profitability Ppt Powerpoint Presentation File Master Slide
This is a track business performance and profitability ppt powerpoint presentation file master slide. This is a four stage process. The stages in this process are business metrics, business kpi, business dashboard.

Organizational Kpis Process Indicators Ppt Presentation
This is a organizational kpis process indicators ppt presentation. This is a five stage process. The stages in this process are people indicators, process indicators, system indicators, customer indicators, financial indicators, organizational kpis.

Product Development Project Progress Scorecard With Rag Level Themes PDF
This slide covers status report of developing new product. It further includes information about issues founds, financial risk analysis, team assigned, infrastructure and solutions. Showcasing this set of slides titled Product Development Project Progress Scorecard With Rag Level Themes PDF. The topics addressed in these templates are Conduct Financial, Prepare Budget Report, Assign Resources. All the content presented in this PPT design is completely editable. Download it and make adjustments in color, background, font etc. as per your unique business setting.
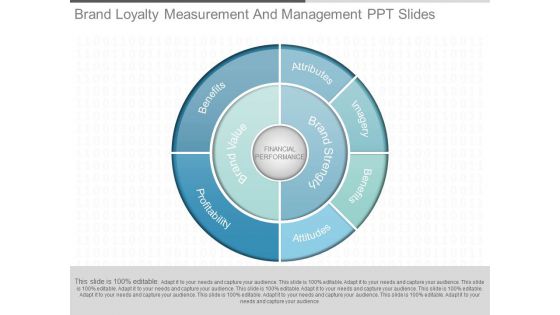
Brand Loyalty Measurement And Management Ppt Slides
This is a brand loyalty measurement and management ppt slides. This is a six stage process. The stages in this process are financial performance, brand value, brand strategy, benefits, profitability, imagery, attributes, attitudes.
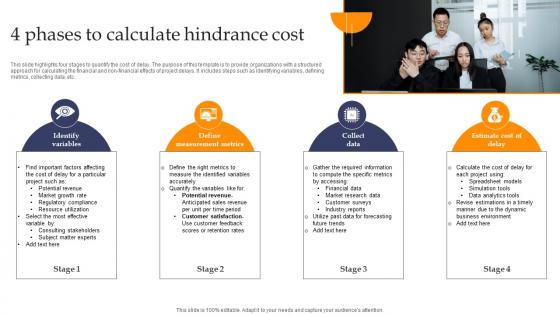
4 Phases To Calculate Hindrance Cost Structure pdf
This slide highlights four stages to quantify the cost of delay. The purpose of this template is to provide organizations with a structured approach for calculating the financial and non-financial effects of project delays. It includes steps such as identifying variables, defining metrics, collecting data, etc. Pitch your topic with ease and precision using this 4 Phases To Calculate Hindrance Cost Structure pdf. This layout presents information on Identify Variables, Define Measurement Metrics, Collect Data . It is also available for immediate download and adjustment. So, changes can be made in the color, design, graphics or any other component to create a unique layout.
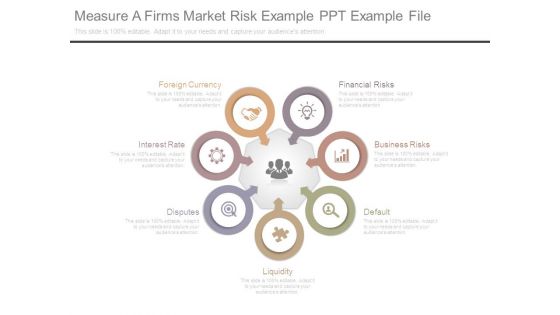
Measure A Firms Market Risk Example Ppt Example File
This is a measure a firms market risk example ppt example file. This is a seven stage process. The stages in this process are foreign currency, interest rate, disputes, liquidity, default, business risks, financial risks.

Defining The Most Commonly Used Performance Strategic Plan For Enhancing Elements Pdf
Purpose of this slide is to illustrate key performance metrics used by supply chain enterprises to track overall business performance. KPIs covered are of operational, financial, strategic and relationship. If your project calls for a presentation, then Slidegeeks is your go-to partner because we have professionally designed, easy-to-edit templates that are perfect for any presentation. After downloading, you can easily edit Defining The Most Commonly Used Performance Strategic Plan For Enhancing Elements Pdf and make the changes accordingly. You can rearrange slides or fill them with different images. Check out all the handy templates
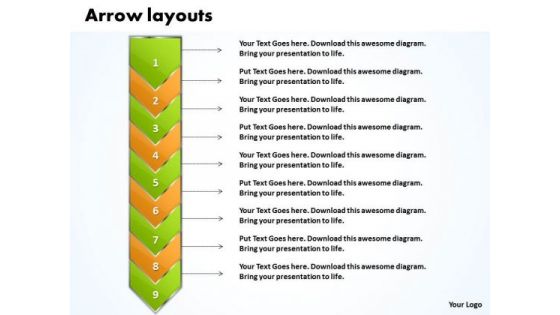
Ppt Go Green Layouts PowerPoint Free And Orange Arrow 9 Stages Templates
PPT go green layouts powerpoint free and orange arrow 9 stages Templates-Use this Curved Arrows diagram to show activities that are related to the business plan metrics and monitor the results to determine if the business plan is proceeding as planned. Our PPT images are so perfectly designed that it reveals the very basis of our PPT diagrams and are an effective tool to make your clients understand.-PPT go green layouts powerpoint free and orange arrow 9 stages Templates-Arrow, Background, Process, Business, Chart, Diagram, Financial, Graphic, Gray, Icon, Illustration, Management, Orange, Perspective, Process, Reflection, 9 Stages, Steps, Text, Transparency

Ppt Team Effort Person Standing Yellow Piece Of Chart PowerPoint Ks2 Templates
PPT team effort person standing yellow piece of chart PowerPoint ks2 Templates-Use this Circular Arrow diagram to show activities that are related to the business plan metrics and monitor the results to determine if the business plan is proceeding as planned. You can apply other 3D Styles and shapes to the slide to enhance your presentations.-PPT team effort person standing yellow piece of chart PowerPoint ks2 Templates-arrow, bar, business, businessman, candidate, cartoon, character, chart, circle, circular, client, communication, company, concept, diagram, finance, financial, flow, growth, human, illustration, increase, information, iteration, man, market, marketing, process, processing, profit, sales, statistics, stats, success, target

Business Performance Ppt PowerPoint Presentation File Graphics
This is a business performance ppt powerpoint presentation file graphics. This is a four stage process. The stages in this process are business highlights, financial summary, revenue split by geography, revenue split by products.
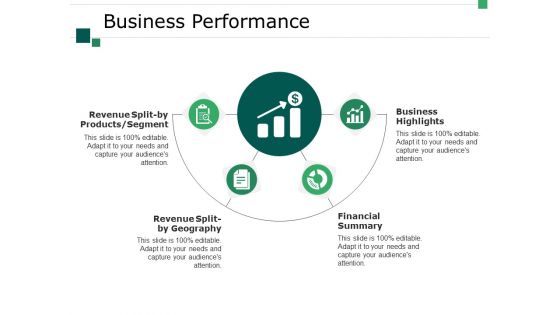
Business Performance Ppt PowerPoint Presentation Inspiration Examples
This is a business performance ppt powerpoint presentation inspiration examples. This is a four stage process. The stages in this process are business, revenue split by geography, financial summary, business highlights, revenue split by products segment.

Improve Business Performance Template Ppt Examples Slides
This is a improve business performance template ppt examples slides. This is a seven stage process. The stages in this process are customer product analysis, customer research, activity analysis, executive report, financial performance, competitor, client consultation.

Business Performance Ppt PowerPoint Presentation Professional Visual Aids
This is a business performance ppt powerpoint presentation professional visual aids. This is a four stage process. The stages in this process are business, business highlights, financial summary, revenue split by geography, revenue split by products segment.

Pillars To Measure Brand Image Management Effectiveness Brochure PDF
This slide showcases the measurement criteria for brand reputation management. It includes pillars such as emotional appeal, financial performance, vision and leadership, social responsibility and product and services. Showcasing this set of slides titled Pillars To Measure Brand Image Management Effectiveness Brochure PDF. The topics addressed in these templates are Financial Performance, Social Responsibility, Emotional Appeal. All the content presented in this PPT design is completely editable. Download it and make adjustments in color, background, font etc. as per your unique business setting.
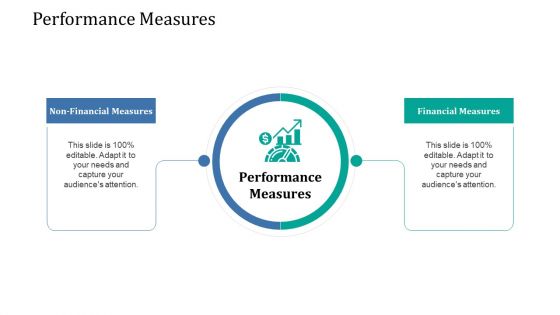
Supply Network Management Growth Performance Measures Rules PDF
This is a supply network management growth performance measures rules pdf template with various stages. Focus and dispense information on two stages using this creative set, that comes with editable features. It contains large content boxes to add your information on topics like non financial measures, financial measures. You can also showcase facts, figures, and other relevant content using this PPT layout. Grab it now.
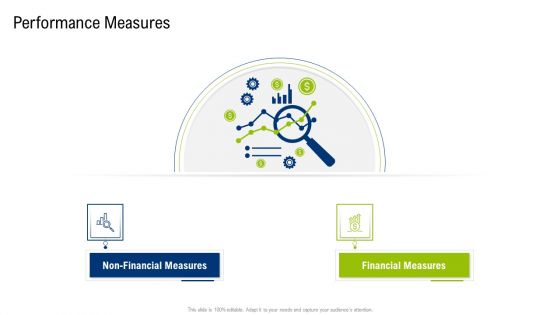
Multiple Phases For Supply Chain Management Performance Measures Themes PDF
This is a multiple phases for supply chain management performance measures themes pdf template with various stages. Focus and dispense information on two stages using this creative set, that comes with editable features. It contains large content boxes to add your information on topics like non financial measures, financial measures. You can also showcase facts, figures, and other relevant content using this PPT layout. Grab it now.
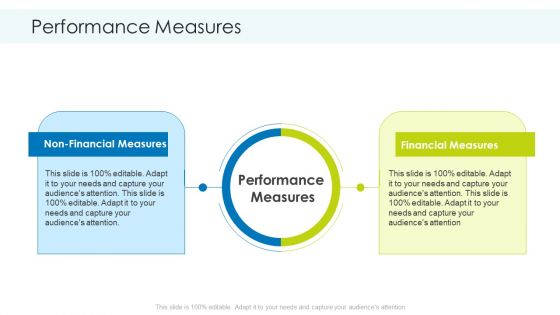
Planning And Predicting Of Logistics Management Performance Measures Professional PDF
This is a planning and predicting of logistics management performance measures professional pdf. template with various stages. Focus and dispense information on two stages using this creative set, that comes with editable features. It contains large content boxes to add your information on topics like non financial measures, financial measures. You can also showcase facts, figures, and other relevant content using this PPT layout. Grab it now.

Goals And Measures For Effective Business Growth Template PDF
This slide signifies the measures and goals to enhance business growth. It includes types like financial, customer, internal business process and employee learning. Presenting Goals And Measures For Effective Business Growth Template PDF to dispense important information. This template comprises five stages. It also presents valuable insights into the topics including Financial Goals, Customer Goals, Internal Business Process. This is a completely customizable PowerPoint theme that can be put to use immediately. So, download it and address the topic impactfully.
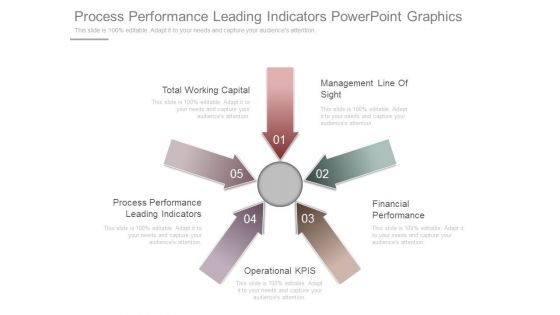
Process Performance Leading Indicators Powerpoint Graphics
This is a process performance leading indicators powerpoint graphics. This is a five stage process. The stages in this process are total working capital, management line of sight, process performance leading indicators, financial performance, operational kpis.
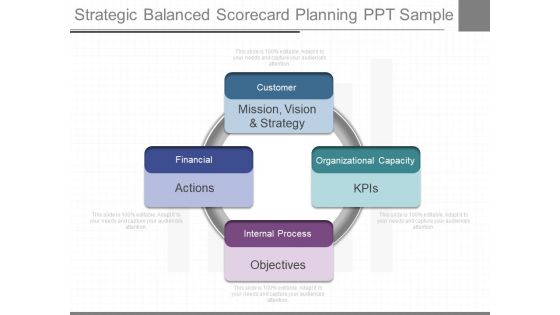
Strategic Balanced Scorecard Planning Ppt Sample
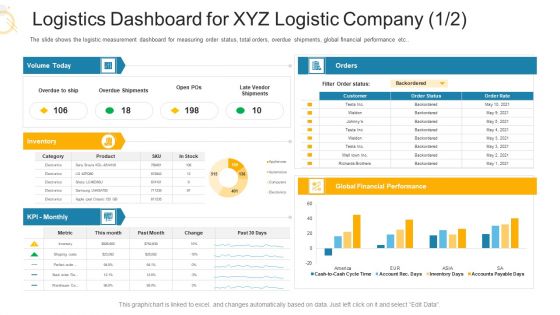
Logistics Dashboard For XYZ Logistic Company Performance Ppt Portfolio Slides PDF
The slide shows the logistic measurement dashboard for measuring order status, total orders, overdue shipments, global financial performance etc. Deliver an awe inspiring pitch with this creative logistics dashboard for XYZ logistic company performance ppt portfolio slides pdf bundle. Topics like financial performance, product, logistics dashboard for XYZ logistic company can be discussed with this completely editable template. It is available for immediate download depending on the needs and requirements of the user.

Content Ppt PowerPoint Presentation Infographics Diagrams
This is a content ppt powerpoint presentation infographics diagrams. This is a thirteen stage process. The stages in this process are business highlights, financial highlights, products offering, sales performance dashboard, sales revenue by region.
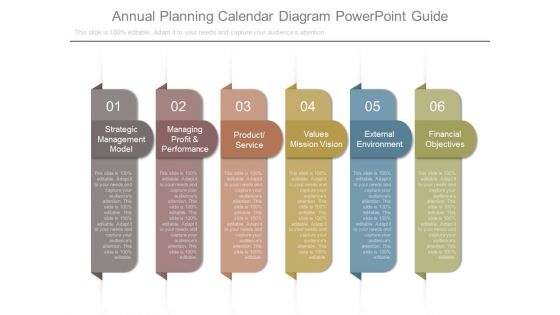
Annual Planning Calendar Diagram Powerpoint Guide
This is a annual planning calendar diagram powerpoint guide. This is a six stage process. The stages in this process are strategic management model, managing profit and performance, product service, values mission vision, external environment, financial objectives.
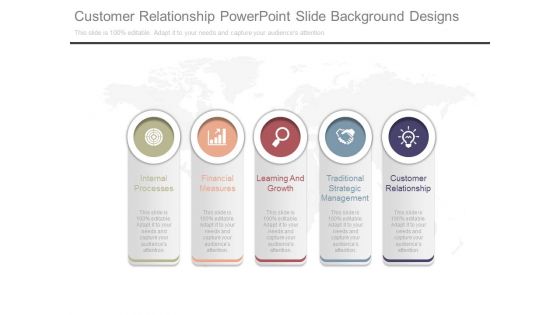
Customer Relationship Powerpoint Slide Background Designs
This is a customer relationship powerpoint slide background designs. This is a five stage process. The stages in this process are internal processes, financial measures, learning and growth, traditional strategic management, customer relationship.

Balanced Scorecard Approach Diagram Presentation Design
This is a balanced scorecard approach diagram presentation design. This is a five stage process. The stages in this process are measuring standards, discussing results, customer perspective, internal processes, financial perspective, balanced scorecard.
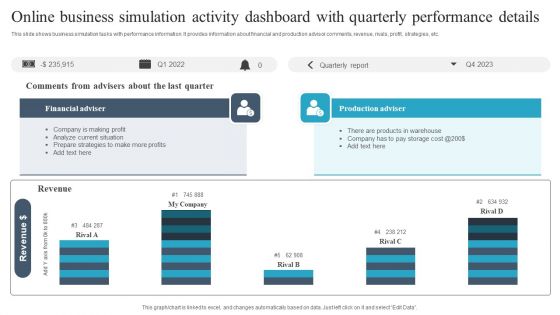
Online Business Simulation Activity Dashboard With Quarterly Performance Details Guidelines PDF
This slide shows business simulation tasks with performance information. It provides information about financial and production advisor comments, revenue, rivals, profit, strategies, etc. Pitch your topic with ease and precision using this Online Business Simulation Activity Dashboard With Quarterly Performance Details Guidelines PDF. This layout presents information on Financial Adviser, Production Adviser, Revenue. It is also available for immediate download and adjustment. So, changes can be made in the color, design, graphics or any other component to create a unique layout.
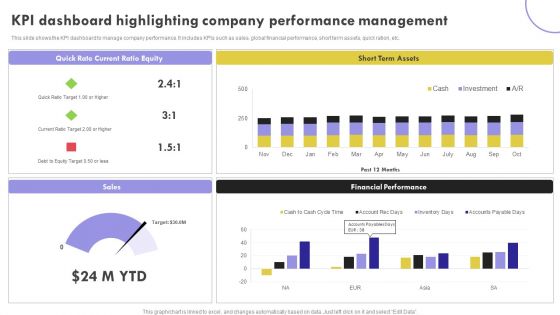
KPI Dashboard Highlighting Company Performance Management Inspiration PDF
This slide shows the KPI dashboard to manage company performance. It includes KPIs such as sales, global financial performance, short term assets, quick ration, etc.Showcasing this set of slides titled KPI Dashboard Highlighting Company Performance Management Inspiration PDF. The topics addressed in these templates are Current Ratio, Term Assets, Financial Performance. All the content presented in this PPT design is completely editable. Download it and make adjustments in color, background, font etc. as per your unique business setting.
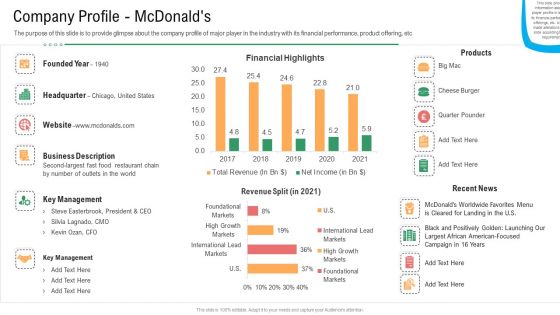
Company Profile Mcdonaldsmerchandise Industry Operational Plan For Business Startup Microsoft PDF
The purpose of this slide is to provide glimpse about the company profile of major player in the industry with its financial performance, product offering, etc. Deliver an awe inspiring pitch with this creative company profile mcdonaldsmerchandise industry operational plan for business startup microsoft pdf bundle. Topics like financial, performance, product, industry, growth can be discussed with this completely editable template. It is available for immediate download depending on the needs and requirements of the user.
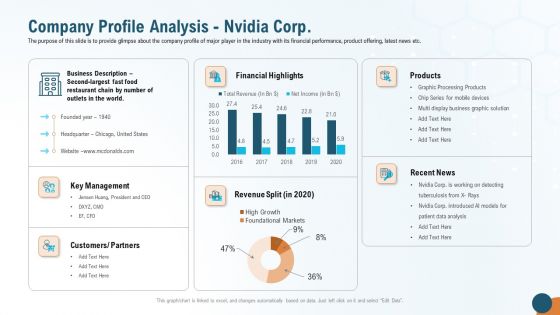
Company Profile Analysis Nvidia Corp Brochure PDF
The purpose of this slide is to provide glimpse about the company profile of major player in the industry with its financial performance, product offering, latest news etc. Deliver an awe-inspiring pitch with this creative company profile analysis nvidia corp brochure pdf bundle. Topics like key management, revenue, products, financial highlights, customers can be discussed with this completely editable template. It is available for immediate download depending on the needs and requirements of the user.
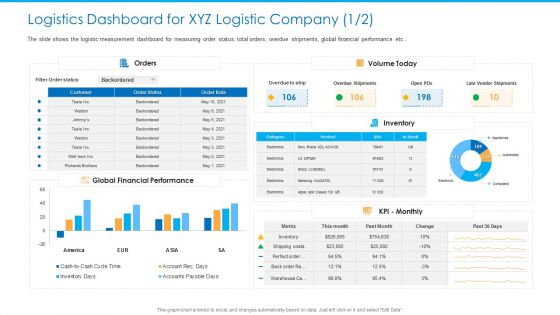
Logistics Dashboard For XYZ Logistic Company Orders Slides PDF
The slide shows the logistic measurement dashboard for measuring order status, total orders, overdue shipments, global financial performance etc.Deliver and pitch your topic in the best possible manner with this logistics dashboard for xyz logistic company orders slides pdf. Use them to share invaluable insights on global financial performance, overdue shipments, late vendor shipments and impress your audience. This template can be altered and modified as per your expectations. So, grab it now.

Logistics Dashboard For XYZ Logistic Company Orders Ppt Infographic Template Diagrams PDF
The slide shows the logistic measurement dashboard for measuring order status, total orders, overdue shipments, global financial performance etc. Deliver and pitch your topic in the best possible manner with this logistics dashboard for xyz logistic company orders ppt infographic template diagrams pdf. Use them to share invaluable insights on global financial performance, orders, inventory and impress your audience. This template can be altered and modified as per your expectations. So, grab it now.

Logistics Dashboard For XYZ Logistic Company Inventory Ppt Infographic Template Background PDF
The slide shows the logistic measurement dashboard for measuring order status, total orders, overdue shipments, global financial performance etc.Deliver and pitch your topic in the best possible manner with this logistics dashboard for XYZ logistic company inventory ppt infographic template background pdf. Use them to share invaluable insights on global financial performance, orders, volume today and impress your audience. This template can be altered and modified as per your expectations. So, grab it now.
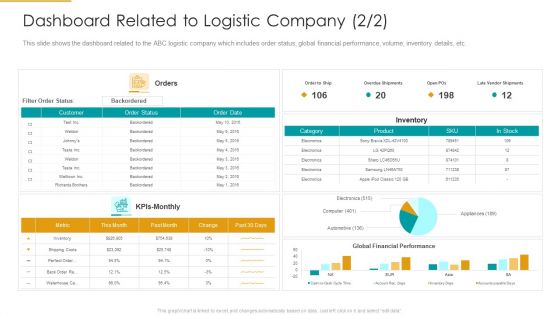
Dashboard Related To Logistic Company Electronics Ideas PDF
This slide shows the dashboard related to the ABC logistic company which includes order status, global financial performance, volume, inventory details, etc. Deliver an awe inspiring pitch with this creative dashboard related to logistic company electronics ideas pdf bundle. Topics like inventory, global financial performance, product can be discussed with this completely editable template. It is available for immediate download depending on the needs and requirements of the user.

Business Plan For Fast Food Restaurant Company Profile Mcdonalds Pictures PDF
The purpose of this slide is to provide glimpse about the company profile of major player in the industry with its financial performance, product offering, etc. Deliver an awe inspiring pitch with this creative business plan for fast food restaurant company profile mcdonalds pictures pdf bundle. Topics like business, management, financial, revenue can be discussed with this completely editable template. It is available for immediate download depending on the needs and requirements of the user.

Comparative Review Of Three Annual Report Inspiration PDF
The following slide highlights the comparative review of three financial statements illustrating income statement, balance sheet and cash flow statement compared against time, purpose, measures, starting and ending.Pitch your topic with ease and precision using this Comparative Review Of Three Annual Report Inspiration PDF This layout presents information on Income Statement, Cash Flow, Financial Position It is also available for immediate download and adjustment. So, changes can be made in the color, design, graphics or any other component to create a unique layout.
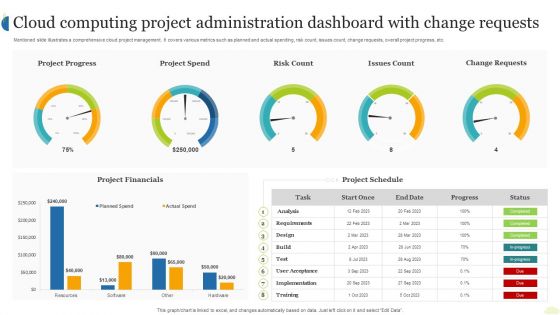
Cloud Computing Project Administration Dashboard With Change Requests Ppt Layouts Background Images PDF
Mentioned slide illustrates a comprehensive cloud project management. It covers various metrics such as planned and actual spending, risk count, issues count, change requests, overall project progress, etc. Showcasing this set of slides titled Cloud Computing Project Administration Dashboard With Change Requests Ppt Layouts Background Images PDF. The topics addressed in these templates are Project Financials, Project Spend, Project Progress. All the content presented in this PPT design is completely editable. Download it and make adjustments in color, background, font etc. as per your unique business setting.

Revenue From Sales Forecasting Dashboard For Startup Businesses Graphics Pdf
This slide presents revenue forecasting dashboard from startup business sales, helpful in highlighting traffic in various pipelines and final revenue generated from closed deals. It includes metrics such as revenue goal attained by representatives, revenue for current month, etc. Showcasing this set of slides titled Revenue From Sales Forecasting Dashboard For Startup Businesses Graphics Pdf. The topics addressed in these templates are Owner, Current Month, Businesses. All the content presented in this PPT design is completely editable. Download it and make adjustments in color, background, font etc. as per your unique business setting.

Money Valuation Analysis Pre And Post Funding Formats PDF
This slide shows the companys balance sheet before and after Series A fund raising. Key metrics covered in this are enterprise value, cash, debt, equity value, share price etc. Showcasing this set of slides titled Money Valuation Analysis Pre And Post Funding Formats PDF. The topics addressed in these templates are Share Price, Equity Value, Enterprise Value. All the content presented in this PPT design is completely editable. Download it and make adjustments in color, background, font etc. as per your unique business setting.
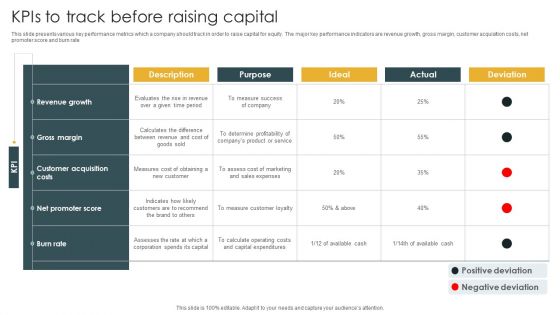
Kpis To Track Before Raising Capital Portrait PDF
This slide presents various key performance metrics which a company should track in order to raise capital for equity. The major key performance indicators are revenue growth, gross margin, customer acquisition costs, net promoter score and burn rate. Pitch your topic with ease and precision using this Kpis To Track Before Raising Capital Portrait PDF. This layout presents information on Net Promoter Score, Customer Acquisition Costs, Gross Margin. It is also available for immediate download and adjustment. So, changes can be made in the color, design, graphics or any other component to create a unique layout.
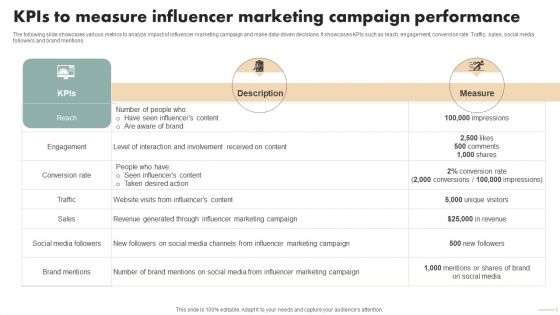
Spa Marketing Strategy Boost Reservations Enhance Revenue Kpis To Measure Influencer Marketing Professional PDF
The following slide showcases various metrics to analyze impact of influencer marketing campaign and make data-driven decisions. It showcases KPIs such as reach, engagement, conversion rate. Traffic, sales, social media followers and brand mentions. Make sure to capture your audiences attention in your business displays with our gratis customizable Spa Marketing Strategy Boost Reservations Enhance Revenue Kpis To Measure Influencer Marketing Professional PDF. These are great for business strategies, office conferences, capital raising or task suggestions. If you desire to acquire more customers for your tech business and ensure they stay satisfied, create your own sales presentation with these plain slides.
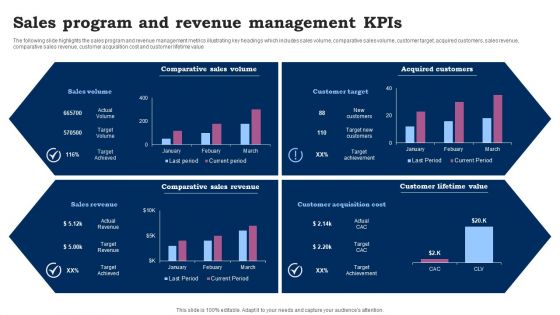
Sales Program And Revenue Management Kpis Ppt Outline Slide Download PDF
The following slide highlights the sales program and revenue management metrics illustrating key headings which includes sales volume, comparative sales volume, customer target, acquired customers, sales revenue, comparative sales revenue, customer acquisition cost and customer lifetime value. Showcasing this set of slides titled Sales Program And Revenue Management Kpis Ppt Outline Slide Download PDF. The topics addressed in these templates are Comparative Sales Volume, Acquired Customers, Comparative Sales Revenue. All the content presented in this PPT design is completely editable. Download it and make adjustments in color, background, font etc. as per your unique business setting.

Dashboard Showcasing Business Revenue Target Vs Accomplishment Assessment Information PDF
This slide represents dashboard showcasing company revenue target vs achievement analysis which helps track business growth. It provides information regarding metrics such as monthly production targets, business revenue targets and generated, monthly budgeted cost and expenses per lead. Showcasing this set of slides titled Dashboard Showcasing Business Revenue Target Vs Accomplishment Assessment Information PDF. The topics addressed in these templates are Total Revenue, Target, Achievement. All the content presented in this PPT design is completely editable. Download it and make adjustments in color, background, font etc. as per your unique business setting.

Video Promotion Techniques To Enhance Business Revenue Ppt Inspiration PDF
This slide signifies the video marketing approach to increase organisation revenue. It covers information regarding to the metrics like engagement rate, view count, play rate, social sharing and feedback. Showcasing this set of slides titled Video Promotion Techniques To Enhance Business Revenue Ppt Inspiration PDF. The topics addressed in these templates are Engagement Rate, View Count, Play Rate. All the content presented in this PPT design is completely editable. Download it and make adjustments in color, background, font etc. as per your unique business setting.

Business Kpis To Plan Subscription Strategic Pictures Pdf
The following slide highlights business key performance indicators to plan subscription strategy. It includes various metrics such as monthly recurring revenue, customer lifetime value, churn rate and average revenue per user. Showcasing this set of slides titled Business Kpis To Plan Subscription Strategic Pictures Pdf. The topics addressed in these templates are Monthly Recurring Revenue, Customer Lifetime Value, Churn Rate. All the content presented in this PPT design is completely editable. Download it and make adjustments in color, background, font etc. as per your unique business setting.

Private Video Streaming Platform Capital Fundraising Pitch Deck Key Statistics Associated To Video Mockup PDF
This slide caters details about key statistics associated to video hosting platform in terms of number of employees, estimated annual revenue, amount of equity raised, offices situated across globe. This is a private video streaming platform capital fundraising pitch deck key statistics associated to video mockup pdf template with various stages. Focus and dispense information on six stages using this creative set, that comes with editable features. It contains large content boxes to add your information on topics like private video streaming platform capital fundraising pitch deck various metrics determining download pdf. You can also showcase facts, figures, and other relevant content using this PPT layout. Grab it now.

How Make Impactful Product Marketing Message Build Product Differentiation Product Performance Dashboard With Total Revenues Information PDF
The following slide displays a brand awareness dashboard as it highlights the key metrics for measuring brand awareness such as brand search, social media searches, links, brand and mentions. Deliver and pitch your topic in the best possible manner with this how make impactful product marketing message build product differentiation product performance dashboard with total revenues information pdf. Use them to share invaluable insights on social, organic, performance, traffic and impress your audience. This template can be altered and modified as per your expectations. So, grab it now.

Project Management Software Capital Raising Deck Market Potential Template PDF
Following slide showcases total market opportunity available for software expansion. It covers metrics such as global market, SAM, ARR and total paying companies. This Project Management Software Capital Raising Deck Market Potential Template PDF is perfect for any presentation, be it in front of clients or colleagues. It is a versatile and stylish solution for organizing your meetings. The product features a modern design for your presentation meetings. The adjustable and customizable slides provide unlimited possibilities for acing up your presentation. Slidegeeks has done all the homework before launching the product for you. So, do not wait, grab the presentation templates today
Effective Company Event Communication Tactics Dashboard For Tracking Event Revenue And Registrations Graphics PDF
This slide covers metrics for analyzing the event revenue and registrations. It includes KPIs such as gross revenue, gross revenue from promos, total refund, total registration, visits to purchase conversion, check-in- status, etc. Deliver and pitch your topic in the best possible manner with this Effective Company Event Communication Tactics Dashboard For Tracking Event Revenue And Registrations Graphics PDF. Use them to share invaluable insights on Gross Revenue, Registration Analysis, Purchase Conversion and impress your audience. This template can be altered and modified as per your expectations. So, grab it now.
Company Event Communication Dashboard For Tracking Event Revenue And Registrations Ideas PDF
This slide covers metrics for analyzing the event revenue and registrations. It includes KPIs such as gross revenue, gross revenue from promos, total refund, total registration, visits to purchase conversion, check-in- status, etc. There are so many reasons you need a Company Event Communication Dashboard For Tracking Event Revenue And Registrations Ideas PDF. The first reason is you can not spend time making everything from scratch, Thus, Slidegeeks has made presentation templates for you too. You can easily download these templates from our website easily.
Tracking Performance Through Sales Cycle Optimization KPIS Best Practices Ppt Example SA SS V
Following slide represents metrics to measure and track performance of optimization implemented by company for high revenue growth. From laying roadmaps to briefing everything in detail, our templates are perfect for you. You can set the stage with your presentation slides. All you have to do is download these easy-to-edit and customizable templates. Tracking Performance Through Sales Cycle Optimization KPIS Best Practices Ppt Example SA SS V will help you deliver an outstanding performance that everyone would remember and praise you for. Do download this presentation today.

Major KPIs To Track Inside Sales Effective Strategies To Succeed At Virtual Ppt Template SA SS V
Following slide represents metrics to measure and track performance of inside sales strategies implemented by company for high revenue growth. Slidegeeks has constructed Major KPIs To Track Inside Sales Effective Strategies To Succeed At Virtual Ppt Template SA SS V after conducting extensive research and examination. These presentation templates are constantly being generated and modified based on user preferences and critiques from editors. Here, you will find the most attractive templates for a range of purposes while taking into account ratings and remarks from users regarding the content. This is an excellent jumping-off point to explore our content and will give new users an insight into our top-notch PowerPoint Templates.

Competitive Sales Strategy Development Plan For Revenue Growth Comparative Assessment Of Sales Professional PDF
This slide shows the comparative assessment of sales performance metrics such as total revenue, average revenue per customer, market share, win rate, year-over-year growth, customer lifetime value, etc. Deliver and pitch your topic in the best possible manner with this Competitive Sales Strategy Development Plan For Revenue Growth Comparative Assessment Of Sales Professional PDF. Use them to share invaluable insights on Total Revenue, Market Share, Customer Lifetime Value and impress your audience. This template can be altered and modified as per your expectations. So, grab it now.
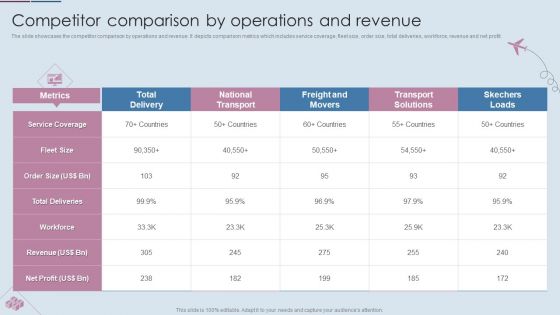
Logistics Shipment Company Profile Competitor Comparison By Operations And Revenue Brochure PDF
The slide showcases the competitor comparison by operations and revenue. It depicts comparison metrics which includes service coverage, fleet size, order size, total deliveries, workforce, revenue and net profit. Deliver and pitch your topic in the best possible manner with this Logistics Shipment Company Profile Competitor Comparison By Operations And Revenue Brochure PDF. Use them to share invaluable insights on Service Coverage, Order Size, Total Deliveries and impress your audience. This template can be altered and modified as per your expectations. So, grab it now.
Company Event Communication Dashboard For Tracking Event Gross Revenue Themes PDF
This slide covers metrics for analyzing gross revenue generated throughout the event. It includes a graphical and tabular representation of revenue generated via promo codes and tracking links. Want to ace your presentation in front of a live audience Our Company Event Communication Dashboard For Tracking Event Gross Revenue Themes PDF can help you do that by engaging all the users towards you.. Slidegeeks experts have put their efforts and expertise into creating these impeccable powerpoint presentations so that you can communicate your ideas clearly. Moreover, all the templates are customizable, and easy-to-edit and downloadable. Use these for both personal and commercial use.
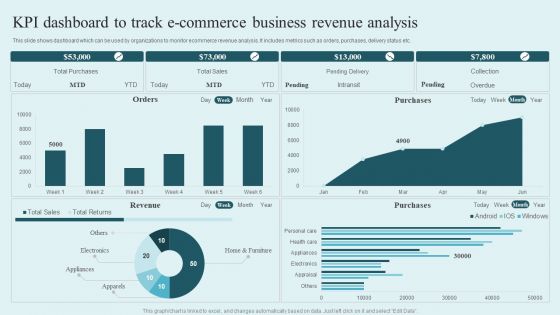
KPI Dashboard To Track E Commerce Business Revenue Analysis Rules PDF
This slide shows dashboard which can be used by organizations to monitor ecommerce revenue analysis. It includes metrics such as orders, purchases, delivery status etc. Pitch your topic with ease and precision using this KPI Dashboard To Track E Commerce Business Revenue Analysis Rules PDF. This layout presents information on Total Purchases, Total Sales, Pending Delivery, Collection. It is also available for immediate download and adjustment. So, changes can be made in the color, design, graphics or any other component to create a unique layout.

 Home
Home