Financial Kpi

Addressing Financial Metrics Of Yelp Platform Sample PDF
Deliver an awe inspiring pitch with this creative addressing financial metrics of yelp platform sample pdf bundle. Topics like addressing financial metrics of yelp platform can be discussed with this completely editable template. It is available for immediate download depending on the needs and requirements of the user.

Startup Business Financial Dashboard With Key Metrics Sample PDF
This slide represents the financial dashboard for startup company with key performance indicators. It includes details related to current working capital, cash conversion cycle in days and vendor payment error rate. Pitch your topic with ease and precision using this Startup Business Financial Dashboard With Key Metrics Sample PDF. This layout presents information on Cash Conversion Cycle, Current Working Capital, Current Liabilities Debt. It is also available for immediate download and adjustment. So, changes can be made in the color, design, graphics or any other component to create a unique layout.

Annual Financial Key Performance Indicators Before RPA Download PDF
This slide covers current annual financial indicators of organization before the implementation of automation. It includes gross margin, return on sales, equity ratio, dynamic gearing, changes in unit sales, operating profit, cash flow, inventory turnover, return on equity before tax, etc. Slidegeeks is one of the best resources for PowerPoint templates. You can download easily and regulate Annual Financial Key Performance Indicators Before RPA Download PDF for your personal presentations from our wonderful collection. A few clicks is all it takes to discover and get the most relevant and appropriate templates. Use our Templates to add a unique zing and appeal to your presentation and meetings. All the slides are easy to edit and you can use them even for advertisement purposes.

Financial Objectives And Metrics With Key Approaches Portrait PDF
The purpose of this slide is to showcase major objectives and KPIs of the financial department. Net revenue, gross margin, OPEX and EBITDA are some of the key KPIs which will assist corporation to track and improve the financial performance. Showcasing this set of slides titled Financial Objectives And Metrics With Key Approaches Portrait PDF. The topics addressed in these templates are Net Revenue, Gross Margin, Streamline Business. All the content presented in this PPT design is completely editable. Download it and make adjustments in color, background, font etc. as per your unique business setting.

Dashboard Depicting E-Commerce Business Financial Operations Metrics Topics PDF
This slide represents dashboard showcasing e-commerce financial process metrics illustrating eccentric purchase conversation rate, shipping revenue, average quantity etc.Showcasing this set of slides titled dashboard depicting e-commerce business financial operations metrics topics pdf The topics addressed in these templates are eccentric purchase, average product revenue, impression rate All the content presented in this PPT design is completely editable. Download it and make adjustments in color, background, font etc. as per your unique business setting.
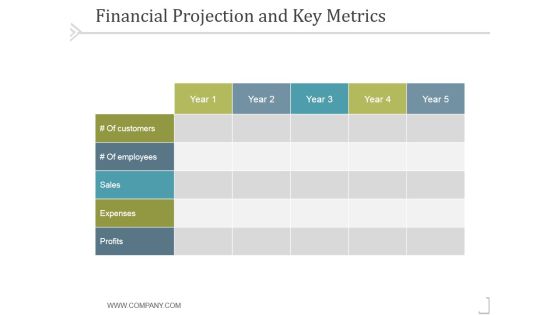
Financial Projection And Key Metrics Ppt PowerPoint Presentation Images
This is a financial projection and key metrics ppt powerpoint presentation images. This is a five stage process. The stages in this process are business, strategy, marketing, success, analysis, table.

Financial Projections And Key Metrics Ppt PowerPoint Presentation Styles Skills
This is a financial projections and key metrics ppt powerpoint presentation styles skills. This is a five stage process. The stages in this process are expenses, profits, sales, employees, years.
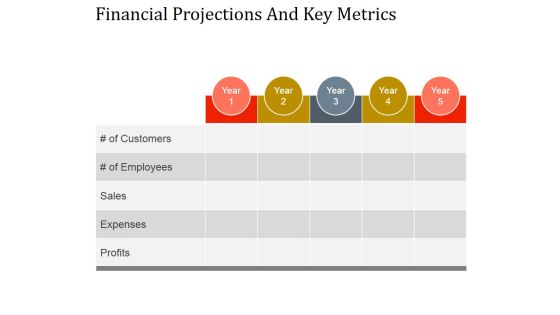
Financial Projections And Key Metrics Ppt PowerPoint Presentation Designs
This is a financial projections and key metrics ppt powerpoint presentation designs. This is a five stage process. The stages in this process are profits, expenses, sales, of employees, of customers.
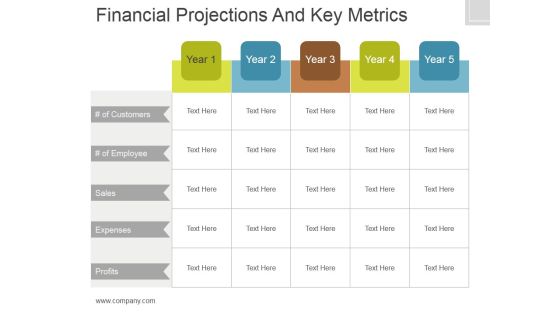
Financial Projections And Key Metrics Ppt PowerPoint Presentation Show
This is a financial projections and key metrics ppt powerpoint presentation show. This is a five stage process. The stages in this process are of customers, sales, expenses, profits.

Financial Projections And Key Metrics Ppt PowerPoint Presentation Professional
This is a financial projections and key metrics ppt powerpoint presentation professional. This is a five stage process. The stages in this process are customers, employees, sales, expenses, profits.

Enterprise Sustainability Performance Metrics Financial Performance Indicator Dashboard Themes PDF
This slide shows financial performance indicator dashboard covering net profit and net sales, profitability indicator ratios, cogs and net profit by region or channel.Deliver an awe inspiring pitch with this creative Enterprise Sustainability Performance Metrics Financial Performance Indicator Dashboard Themes PDF bundle. Topics like Profitability Indicator, Sold Breakdown, Target Actual can be discussed with this completely editable template. It is available for immediate download depending on the needs and requirements of the user.

Key Financial Metrics Ppt PowerPoint Presentation Portfolio Design Inspiration Cpb
Presenting this set of slides with name key financial metrics ppt powerpoint presentation portfolio design inspiration cpb. This is an editable Powerpoint four stages graphic that deals with topics like key financial metrics to help convey your message better graphically. This product is a premium product available for immediate download and is 100 percent editable in Powerpoint. Download this now and use it in your presentations to impress your audience.

Examples Financial Performance Metrics Ppt PowerPoint Presentation Ideas Gridlines Cpb
Presenting this set of slides with name examples financial performance metrics ppt powerpoint presentation ideas gridlines cpb. This is an editable Powerpoint four stages graphic that deals with topics like examples financial performance metrics to help convey your message better graphically. This product is a premium product available for immediate download and is 100 percent editable in Powerpoint. Download this now and use it in your presentations to impress your audience.

IT Financial Management Metrics Ppt PowerPoint Presentation Outline Vector Cpb
Presenting this set of slides with name it financial management metrics ppt powerpoint presentation outline vector cpb. This is an editable Powerpoint six stages graphic that deals with topics like it financial management metrics to help convey your message better graphically. This product is a premium product available for immediate download and is 100 percent editable in Powerpoint. Download this now and use it in your presentations to impress your audience.
Financial Metrics Healthcare Ppt PowerPoint Presentation Icon Slides Cpb Pdf
Presenting this set of slides with name financial metrics healthcare ppt powerpoint presentation icon slides cpb pdf. This is an editable Powerpoint five stages graphic that deals with topics like financial metrics healthcare to help convey your message better graphically. This product is a premium product available for immediate download and is 100 percent editable in Powerpoint. Download this now and use it in your presentations to impress your audience.

Financial Forecast And Essential Metrics Icon Ppt Outline Display PDF
Persuade your audience using this Financial Forecast And Essential Metrics Icon Ppt Outline Display PDF. This PPT design covers three stages, thus making it a great tool to use. It also caters to a variety of topics including Financial Forecast, Essential Metrics, Icon. Download this PPT design now to present a convincing pitch that not only emphasizes the topic but also showcases your presentation skills.
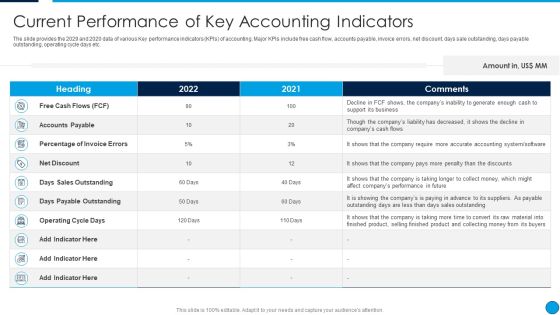
Summary Financial Current Performance Of Key Accounting Indicators Template PDF
The slide provides the 2029 and 2020 data of various Key performance indicators KPIs of accounting. Major KPIs include free cash flow, accounts payable, invoice errors, net discount, days sale outstanding, days payable outstanding, operating cycle days etc. Deliver an awe inspiring pitch with this creative Summary Financial Current Performance Of Key Accounting Indicators Template PDF bundle. Topics like Free Cash Flows, Accounts Payable, Percentage Of Invoice Errors, Net Discount can be discussed with this completely editable template. It is available for immediate download depending on the needs and requirements of the user.

Analyzing Brands Key Financial Indicators Ppt Infographic Template Slides PDF
This slide showcases assessing key indicators for measuring financial performance of brand. It provides details about turnover, marketing costs, sales, administrative expenses, profit, percentage turnover, trade debtor days, headcount, etc. Are you in need of a template that can accommodate all of your creative concepts This one is crafted professionally and can be altered to fit any style. Use it with Google Slides or PowerPoint. Include striking photographs, symbols, depictions, and other visuals. Fill, move around, or remove text boxes as desired. Test out color palettes and font mixtures. Edit and save your work, or work with colleagues. Download Analyzing Brands Key Financial Indicators Ppt Infographic Template Slides PDF and observe how to make your presentation outstanding. Give an impeccable presentation to your group and make your presentation unforgettable.
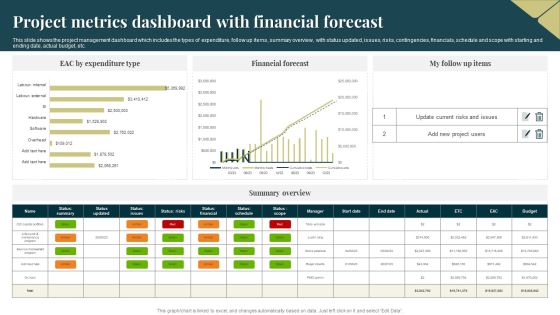
Project Metrics Dashboard With Financial Forecast Professional PDF
This slide shows the project management dashboard which includes the types of expenditure, follow up items, summary overview, with status updated, issues, risks, contingencies, financials, schedule and scope with starting and ending date, actual budget, etc. Showcasing this set of slides titled Project Metrics Dashboard With Financial Forecast Professional PDF. The topics addressed in these templates are Expenditure, Financial Forecast, Risks. All the content presented in this PPT design is completely editable. Download it and make adjustments in color, background, font etc. as per your unique business setting.

Annual Corporate Financial Statement For Business Enterprises Designs PDF
This template consists of sample financial report to be used by business managers to report financial performance of their enterprises towards the end of accounting year. Key metrics are sales, operating expenses, operating profit, depreciation, interest, net profit etc. Showcasing this set of slides titled Annual Corporate Financial Statement For Business Enterprises Designs PDF. The topics addressed in these templates are Operating Expense, Operating Profit, Depreciation. All the content presented in this PPT design is completely editable. Download it and make adjustments in color, background, font etc. as per your unique business setting.

Impact Of Financial Risks On Online Store Metrics Summary PDF
This slide depicts impact of financial risks on online store metrics. It provides information about online fraud, frequent chargebacks, high volume of transactions, lengthy delivery time, merchant risk, cyber hacking, customer satisfaction, etc. Formulating a presentation can take up a lot of effort and time, so the content and message should always be the primary focus. The visuals of the PowerPoint can enhance the presenters message, so our Impact Of Financial Risks On Online Store Metrics Summary PDF was created to help save time. Instead of worrying about the design, the presenter can concentrate on the message while our designers work on creating the ideal templates for whatever situation is needed. Slidegeeks has experts for everything from amazing designs to valuable content, we have put everything into Impact Of Financial Risks On Online Store Metrics Summary PDF.

Monthly Financial Metrics Dashboard With Income Statement Infographics PDF
This following slide displays kpis to communicate key financial information to both internal and external stakeholders. It further includes details such as OPEX ratio, revenue and COGS, income, expenses, etc. Showcasing this set of slides titled Monthly Financial Metrics Dashboard With Income Statement Infographics PDF. The topics addressed in these templates are Gross Profit Margin, Taxes, Revenue. All the content presented in this PPT design is completely editable. Download it and make adjustments in color, background, font etc. as per your unique business setting.

Financial Forecast And Essential Metrics Dashboard Ppt File Show PDF
This slide elaborates about the multiple sources through which one can project about the growth and current status of the company. It includes lead conversion rate, monthly revenue , short term assets , net and gross profit margins, etc. Pitch your topic with ease and precision using this Financial Forecast And Essential Metrics Dashboard Ppt File Show PDF. This layout presents information on Monthly Revenue Growth, Short Term Assets, Overall Financial Performance, Net Profit Margin. It is also available for immediate download and adjustment. So, changes can be made in the color, design, graphics or any other component to create a unique layout.

Comparative Matrix Of Actual And Projected Financial Performance Brochure PDF
This slide shows matrix which can be used to compare actual and expected financial performance of an organization. It covers metrics such as gross profit margin, net profit margin, working capital, etc. Pitch your topic with ease and precision using this Comparative Matrix Of Actual And Projected Financial Performance Brochure PDF. This layout presents information on Comparative Matrix Actual, Projected Financial Performance. It is also available for immediate download and adjustment. So, changes can be made in the color, design, graphics or any other component to create a unique layout.
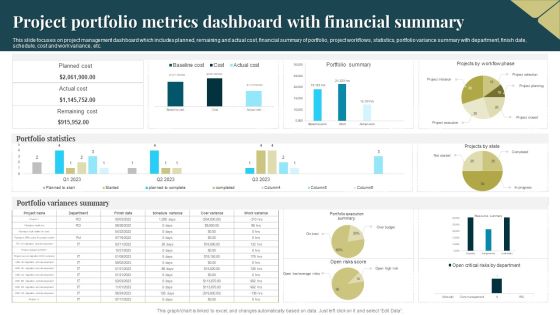
Project Portfolio Metrics Dashboard With Financial Summary Demonstration PDF
This slide focuses on project management dashboard which includes planned, remaining and actual cost, financial summary of portfolio, project workflows, statistics, portfolio variance summary with department, finish date, schedule, cost and work variance, etc. Showcasing this set of slides titled Project Portfolio Metrics Dashboard With Financial Summary Demonstration PDF. The topics addressed in these templates are Planned Cost, Portfolio Statistics, Portfolio Variances Summary. All the content presented in this PPT design is completely editable. Download it and make adjustments in color, background, font etc. as per your unique business setting.

Financial Highlights Of SW Care Company Professional PDF
This slide shows the Financial Highlights of SW Care Company such as net trade sales, gross profit, net income, sales and marketing investment, share metrics, value creation metrics, market growth etc. along with decision point summary details. Deliver an awe inspiring pitch with this creative financial highlights of sw care company professional pdf bundle. Topics like shares metrics, value creation metrics, decision point summary, market assumptions, financials can be discussed with this completely editable template. It is available for immediate download depending on the needs and requirements of the user.

Traditional Financial Budgeting And Assessment Kpis For Businesses Infographics PDF
This slide represents the key performance indicators set by the financial planning and analysis team for their business. The indicators includes working capital, operating cash flow, return on equity, current ratio, accounts receivable and payable turnover. Presenting Traditional Financial Budgeting And Assessment Kpis For Businesses Infographics PDF to dispense important information. This template comprises six stages. It also presents valuable insights into the topics including Working Capital, Operating Cash Flow, Current Ratio. This is a completely customizable PowerPoint theme that can be put to use immediately. So, download it and address the topic impactfully.

Dashboard For Monitoring And Corporate Financial Statement Budgets Template PDF
This slide brings forth dashboard for monitoring and reporting the financial budgets of various branches of an enterprise emphasis on income and expenditure by each branch. The key performing indicators are actual vs budgeted revenue, revenue distribution by branches etc. Showcasing this set of slides titled Dashboard For Monitoring And Corporate Financial Statement Budgets Template PDF. The topics addressed in these templates are Revenue Distribution, Revenue Source, Revenue Expenses. All the content presented in this PPT design is completely editable. Download it and make adjustments in color, background, font etc. as per your unique business setting.
Executive Dashboards For Tracking Financial Health Of Enterprise Diagrams PDF
This slide represents the CEO dashboard to track the financial health of an organization. It includes key performance indicators such as revenue, expenses, activity ratio, gross profit margin, EBIT etc. Pitch your topic with ease and precision using this Executive Dashboards For Tracking Financial Health Of Enterprise Diagrams PDF. This layout presents information on Revenue, Expense, Activity Ratio. It is also available for immediate download and adjustment. So, changes can be made in the color, design, graphics or any other component to create a unique layout.

Financial Dashboard For Organization Scenario Analysis Ppt Show Ideas PDF
This slide represents the key financial performance indicators of a business to analyze and plan its scenario. It includes KPIs such as cash conversion cycle, working capital and current ratio. Showcasing this set of slides titled Financial Dashboard For Organization Scenario Analysis Ppt Show Ideas PDF. The topics addressed in these templates are Current Working Capital, Current Liabilities, Current Assets. All the content presented in this PPT design is completely editable. Download it and make adjustments in color, background, font etc. as per your unique business setting.

Supply Chain Management Operational Metrics Financial Measures Ppt Backgrounds PDF
This is a supply chain management operational metrics financial measures ppt backgrounds pdf. template with various stages. Focus and dispense information on seven stages using this creative set, that comes with editable features. It contains large content boxes to add your information on topics like inventory holding cost, cost of goods return to supplier, inventory holding cost. You can also showcase facts, figures, and other relevant content using this PPT layout. Grab it now.

Supply Chain Management Operational Metrics Non Financial Measures Structure PDF
Presenting supply chain management operational metrics non financial measures structure pdf. to provide visual cues and insights. Share and navigate important information on five stages that need your due attention. This template can be used to pitch topics like backorder level, order to delivery lead time, supply chain lead time. In addtion, this PPT design contains high resolution images, graphics, etc, that are easily editable and available for immediate download.

Financial Highlights Of SW Care Company Ppt File Template PDF
This slide shows the Financial Highlights of SW Care Company such as net trade sales, gross profit, net income, sales and marketing investment, share metrics, value creation metrics, market growth etc. along with decision point summary details. Deliver an awe inspiring pitch with this creative financial highlights of sw care company ppt file template pdf bundle. Topics like gross profit, investment, sales, price can be discussed with this completely editable template. It is available for immediate download depending on the needs and requirements of the user.
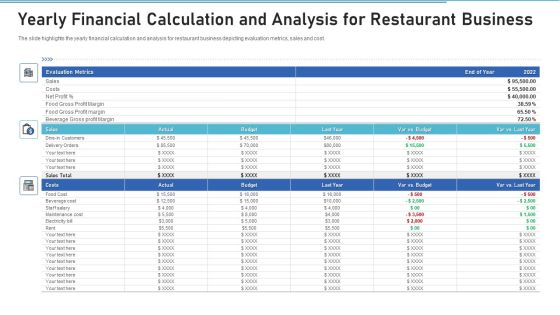
Yearly Financial Calculation And Analysis For Restaurant Business Background PDF
Pitch your topic with ease and precision using this yearly financial calculation and analysis for restaurant business background pdf. This layout presents information on evaluation metrics, sales, costs. It is also available for immediate download and adjustment. So, changes can be made in the color, design, graphics or any other component to create a unique layout.

Key Financial Success Factors For Company Designs PDF
This slides displays a table to review business performance on the basis of major metrics such as year over year revenue, net promoter score and EBITDA for long-term growth and profitability. Pitch your topic with ease and precision using this Key Financial Success Factors For Company Designs PDF. This layout presents information on Key Financial Success, Factors For Company. It is also available for immediate download and adjustment. So, changes can be made in the color, design, graphics or any other component to create a unique layout.

Financial Initiatives Plan For Healthcare Organisations Summary PDF
This slide presents financial action plan for healthcare organisations, helpful in determining business requirements and sources of funds. It includes adopting modern budget process, defining goals, identifying requirements and selecting metrics. Presenting Financial Initiatives Plan For Healthcare Organisations Summary PDF to dispense important information. This template comprises five stages. It also presents valuable insights into the topics including Adopt Modern Budgeting Process, Define Organisational Goals, Identify Requirements. This is a completely customizable PowerPoint theme that can be put to use immediately. So, download it and address the topic impactfully.
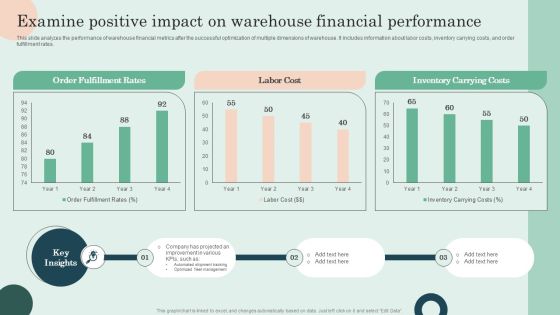
Examine Positive Impact On Warehouse Financial Performance Pictures PDF
This slide analyzes the performance of warehouse financial metrics after the successful optimization of multiple dimensions of warehouse. It includes information about labor costs, inventory carrying costs, and order fulfillment rates. Slidegeeks is one of the best resources for PowerPoint templates. You can download easily and regulate Examine Positive Impact On Warehouse Financial Performance Pictures PDF for your personal presentations from our wonderful collection. A few clicks is all it takes to discover and get the most relevant and appropriate templates. Use our Templates to add a unique zing and appeal to your presentation and meetings. All the slides are easy to edit and you can use them even for advertisement purposes.
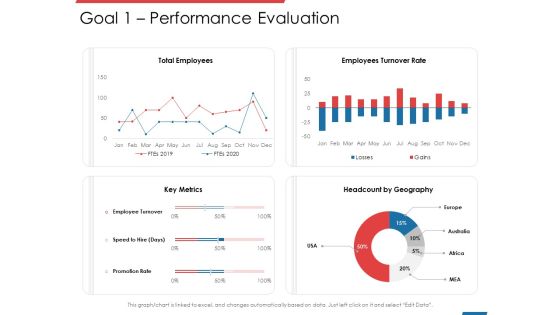
Financial PAR Goal 1 Performance Evaluation Ppt Professional Portfolio PDF
Deliver an awe inspiring pitch with this creative financial par goal 1 performance evaluation ppt professional portfolio pdf bundle. Topics like key metrics, headcount by geography, total employees, employees turnover rate can be discussed with this completely editable template. It is available for immediate download depending on the needs and requirements of the user.

Income Statement Showing Financial Forecast And Essential Metrics Structure PDF
This slide displays the income statement of an organization with the projections of next year revenue and net income. It shows that there will more revenue as compared to the previous years and hence it will generate more income. Presenting Income Statement Showing Financial Forecast And Essential Metrics Structure PDF to dispense important information. This template comprises two stages. It also presents valuable insights into the topics including Revenue, Operating Expenses, Operating Income. This is a completely customizable PowerPoint theme that can be put to use immediately. So, download it and address the topic impactfully.
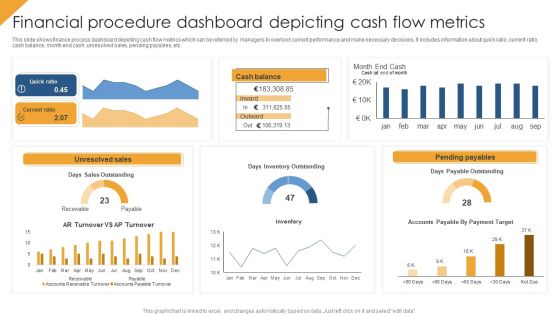
Financial Procedure Dashboard Depicting Cash Flow Metrics Structure PDF
This slide shows finance process dashboard depicting cash flow metrics which can be referred by managers to overlook current performance and make necessary decisions. It includes information about quick ratio, current ratio, cash balance, month end cash, unresolved sales, pending payables, etc. Pitch your topic with ease and precision using this Financial Procedure Dashboard Depicting Cash Flow Metrics Structure PDF. This layout presents information on Quick Ratio, Unresolved Sales, Pending Payables. It is also available for immediate download and adjustment. So, changes can be made in the color, design, graphics or any other component to create a unique layout.

Cash Flow Metrics For Chief Financial Officers Ppt Sample PDF
This slide showcases key metrics to be tracked by companys CFO. The KPIs covered are average days delinquent, collection effectiveness index, current accounts receivable and operating cashflow. Presenting Cash Flow Metrics For Chief Financial Officers Ppt Sample PDF to dispense important information. This template comprises four stages. It also presents valuable insights into the topics including Average Days Delinquent, Current Accounts Receivable, Collection Effectiveness Index. This is a completely customizable PowerPoint theme that can be put to use immediately. So, download it and address the topic impactfully.

Post Implementation Other Operation And Financial Kpis Summary PDF
The slide provides five years graphs 2022F to 2026F forecasted number of major KPIs key performance indicators, that might help to track the performance of ABC Railway. Covered KPIs include Revenue, Total Passengers, operating income, customer satisfaction rate etc.Deliver and pitch your topic in the best possible manner with this post implementation other operation and financial KPIs summary pdf. Use them to share invaluable insights on total passengers, operating income, revenue, 2022 to 2026 and impress your audience. This template can be altered and modified as per your expectations. So, grab it now.

Post Implementation Other Operation And Financial Kpis Inspiration PDF
The slide provides five years graphs 2022F-2026F forecasted number of major KPIs key performance indicators, that might help to track the performance of ABC Railway. Covered KPIs include Revenue, Total Passengers, operating income, customer satisfaction rate etc. Deliver and pitch your topic in the best possible manner with this post implementation other operation and financial kpis inspiration pdf. Use them to share invaluable insights on revenue, operating income, customer satisfaction and impress your audience. This template can be altered and modified as per your expectations. So, grab it now.

10 Week Roadmap For Strategic Financial Planning Background PDF
This slide signifies the eight week strategic timeline for email advertisement campaign. It covers steps like determine campaign target, choose platform, build list, segmentation, create campaign, automation, tracking and upgrading trends Presenting 10 Week Roadmap For Strategic Financial Planning Background PDF to dispense important information. This template comprises eight stages. It also presents valuable insights into the topics including Campaign Target, Email Campaigns, Analyze Metrics. This is a completely customizable PowerPoint theme that can be put to use immediately. So, download it and address the topic impactfully.

Underground Aquifer Supervision Water Management Kpi Metrics Showing Water Quality Introduction PDF
Presenting this set of slides with name underground aquifer supervision water management kpi metrics showing water quality introduction pdf. The topics discussed in these slides are supply, quality, financial years. This is a completely editable PowerPoint presentation and is available for immediate download. Download now and impress your audience.
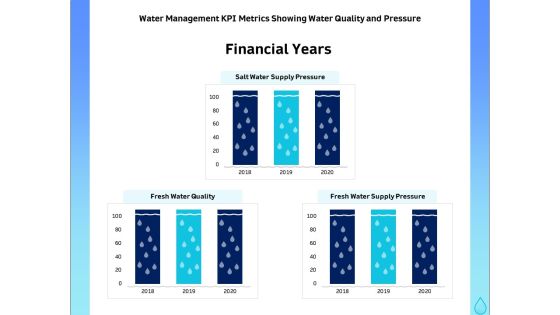
Integrated Water Resource Management Water Management KPI Metrics Showing Water Quality And Pressure Portrait PDF
Presenting this set of slides with name integrated water resource management water management kpi metrics showing water quality and pressure portrait pdf. The topics discussed in these slides are financial years, fresh water quality, fresh water supply pressure, salt water supply pressure, 2018 to 2020. This is a completely editable PowerPoint presentation and is available for immediate download. Download now and impress your audience.

All About HRM Human Resources KPI Dashboard Sales Ppt Icon Deck PDF
Presenting this set of slides with name all about hrm human resources kpi dashboard sales ppt icon deck pdf. The topics discussed in these slides are manufacturing department, sales department, engineering department, financial department. This is a completely editable PowerPoint presentation and is available for immediate download. Download now and impress your audience.

Construction Management Services And Action Plan Infrastructure KPI Dashboard Showing Resource Allocation Ideas PDF
Deliver an awe inspiring pitch with this creative construction management services and action plan infrastructure kpi dashboard showing resource allocation ideas pdf bundle. Topics like days per project, resource allocation, project financial can be discussed with this completely editable template. It is available for immediate download depending on the needs and requirements of the user.

Construction Engineering And Industrial Facility Management Infrastructure KPI Dashboard Showing Resource Allocation Sample PDF
Deliver an awe-inspiring pitch with this creative construction engineering and industrial facility management infrastructure kpi dashboard showing resource allocation sample pdf bundle. Topics like delivery timeline and resources, resource allocation, project financial can be discussed with this completely editable template. It is available for immediate download depending on the needs and requirements of the user.

Quality Control Kpi Dashboard Manufacturing Control Ppt Infographics Master Slide PDF
Deliver an awe inspiring pitch with this creative quality control kpi dashboard manufacturing control ppt infographics master slide pdf bundle. Topics like execution, severity, financial can be discussed with this completely editable template. It is available for immediate download depending on the needs and requirements of the user.

Kpi Dashboard Best Practices For Project Management Ppt Powerpoint Presentation Outline Samples
This is a kpi dashboard best practices for project management ppt powerpoint presentation outline samples. This is a three stage process. The stages in this process are business metrics, business kpi, business dashboard.
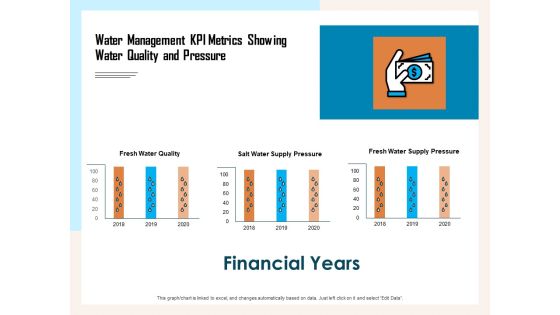
Managing Agriculture Land And Water Water Management KPI Metrics Showing Water Quality And Pressure Themes PDF
Presenting this set of slides with name managing agriculture land and water water management kpi metrics showing water quality and pressure themes pdf. The topics discussed in these slides are financial years, fresh water quality, fresh water supply pressure, salt water supply pressure, 2018 to 2020. This is a completely editable PowerPoint presentation and is available for immediate download. Download now and impress your audience.

Retail KPI Dashboard Showing Revenue Vs Units Sold Ppt PowerPoint Presentation Professional Smartart
This is a retail kpi dashboard showing revenue vs units sold ppt powerpoint presentation professional smartart. This is a four stage process. The stages in this process are finance, analysis, business, investment, marketing.

Retail KPI Dashboard Showing Sales Revenue Customers Ppt PowerPoint Presentation Show Background Designs
This is a retail kpi dashboard showing sales revenue customers ppt powerpoint presentation show background designs. This is a six stage process. The stages in this process are finance, analysis, business, investment, marketing.

Retail Kpi Dashboard Showing Revenue Vs Units Sold Ppt PowerPoint Presentation File Formats
This is a retail kpi dashboard showing revenue vs units sold ppt powerpoint presentation file formats. This is a three stage process. The stages in this process are finance, marketing, management, investment, analysis.
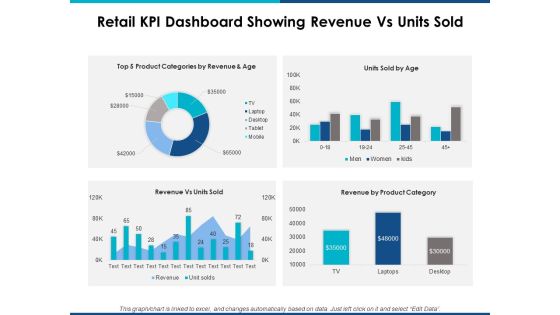
Retail Kpi Dashboard Showing Revenue Vs Units Sold Ppt Powerpoint Presentation Layouts Show
This is a retail kpi dashboard showing revenue vs units sold ppt powerpoint presentation layouts show. This is a four stage process. The stages in this process are finance, marketing, management, investment, analysis.

Building Innovation Capabilities And USP Detection Marketing KPI And Dashboard Ppt Infographic Template Pictures PDF
Show your sale and financial highlights of through our dashboard. Deliver an awe-inspiring pitch with this creative building innovation capabilities and usp detection marketing kpi and dashboard ppt infographic template pictures pdf bundle. Topics like revenue per acquisition, per acquisition, marketing spend, total revenu, leads, acquisitions, profit, return on investment can be discussed with this completely editable template. It is available for immediate download depending on the needs and requirements of the user.

Digitalization Corporate Initiative Ecommerce Management KPI Metrics Average Ppt Styles Slide Portrait Pdf
digitalization corporate initiative ecommerce management kpi metrics average ppt styles slide portrait pdf template with various stages. Focus and dispense information on five stages using this creative set, that comes with editable features. It contains large content boxes to add your information on topics like ecommerce management kpi metrics. You can also showcase facts, figures, and other relevant content using this PPT layout. Grab it now.

Talent Management Systems KPI Metrics And Dashboard Ppt File Vector PDF
This is a talent management systems kpi metrics and dashboard ppt file vector pdf template with various stages. Focus and dispense information on one stage using this creative set, that comes with editable features. It contains large content boxes to add your information on topics like kpi metrics and dashboard. You can also showcase facts, figures, and other relevant content using this PPT layout. Grab it now.

Construction Management Services And Action Plan Infrastructure KPI Metrics Showing Cost Saving Pictures PDF
Presenting construction management services and action plan infrastructure kpi metrics showing cost saving pictures pdf to provide visual cues and insights. Share and navigate important information on three stages that need your due attention. This template can be used to pitch topics like infrastructure kpi metrics showing cost saving. In addtion, this PPT design contains high resolution images, graphics, etc, that are easily editable and available for immediate download.

Agenda For Sustainability Calculation With KPI Ppt PowerPoint Presentation Gallery Designs PDF
This is a agenda for sustainability calculation with kpi ppt powerpoint presentation gallery designs pdf template with various stages. Focus and dispense information on three stages using this creative set, that comes with editable features. It contains large content boxes to add your information on topics like financial profitability, employee performance, customer satisfaction. You can also showcase facts, figures, and other relevant content using this PPT layout. Grab it now.

G9 Table Of Contents Company Performance Evaluation Using KPI Elements PDF
This is a G9 Table Of Contents Company Performance Evaluation Using KPI Elements PDF template with various stages. Focus and dispense information on one stage using this creative set, that comes with editable features. It contains large content boxes to add your information on topics like Business Performance, Financial Profitability, Company Performance. You can also showcase facts, figures, and other relevant content using this PPT layout. Grab it now.
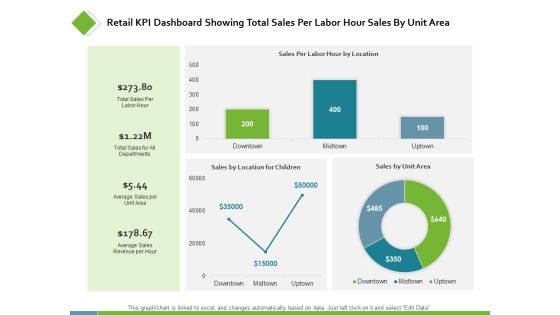
Retail KPI Dashboard Showing Total Sales Per Labor Ppt PowerPoint Presentation Styles Examples
This is a retail kpi dashboard showing total sales per labor ppt powerpoint presentation styles examples. This is a three stage process. The stages in this process are finance, analysis, business, investment, marketing.

Supply Chain Management Kpi Dashboard Marketing Ppt PowerPoint Presentation File Tips
This is a supply chain management kpi dashboard marketing ppt powerpoint presentation file tips. This is a three stage process. The stages in this process are finance, marketing, management, investment, analysis.
Service Level Agreement KPI Dashboard With Graph And Analytics Icon Inspiration PDF
Persuade your audience using this Service Level Agreement KPI Dashboard With Graph And Analytics Icon Inspiration PDF. This PPT design covers three stages, thus making it a great tool to use. It also caters to a variety of topics including Service Level, Agreement KPI Dashboard, Graph And Analytics, Icon. Download this PPT design now to present a convincing pitch that not only emphasizes the topic but also showcases your presentation skills.
Vendor Performance KPI Analytical Dashboard Icon For Data Management Background PDF
Persuade your audience using this Vendor Performance KPI Analytical Dashboard Icon For Data Management Background PDF. This PPT design covers three stages, thus making it a great tool to use. It also caters to a variety of topics including Vendor Performance, KPI Analytical Dashboard, Icon Data Management. Download this PPT design now to present a convincing pitch that not only emphasizes the topic but also showcases your presentation skills.

Firm Productivity Administration Business Intelligence KPI Metrics SEO Ppt PowerPoint Presentation File Visual Aids PDF
Presenting this set of slides with name firm productivity administration business intelligence kpi metrics seo ppt powerpoint presentation file visual aids pdf. This is a four stage process. The stages in this process are seo traffic weekly, trip distance, usa clients, ytd revenue millions. This is a completely editable PowerPoint presentation and is available for immediate download. Download now and impress your audience.

Construction Production Facilities Infrastructure KPI Metrics Showing Cost Saving Background PDF
Presenting this set of slides with name construction production facilities infrastructure kpi metrics showing cost saving background pdf. This is a three stage process. The stages in this process are net project revenue per employee, cost savings, defects. This is a completely editable PowerPoint presentation and is available for immediate download. Download now and impress your audience.

Firm Productivity Administration Business Intelligence KPI Metrics Average Ppt PowerPoint Presentation Infographics Guidelines PDF
Presenting this set of slides with name firm productivity administration business intelligence kpi metrics average ppt powerpoint presentation infographics guidelines pdf. This is a four stage process. The stages in this process are average purchase value, average lifetime value, average unit price, category id max. This is a completely editable PowerPoint presentation and is available for immediate download. Download now and impress your audience.
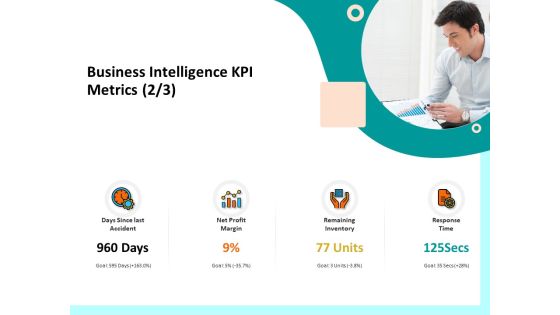
Firm Productivity Administration Business Intelligence KPI Metrics Inventory Ppt PowerPoint Presentation Inspiration Guide PDF
Presenting this set of slides with name firm productivity administration business intelligence kpi metrics inventory ppt powerpoint presentation inspiration guide pdf. This is a four stage process. The stages in this process are days since last accident, net profit margin, remaining inventory, response time. This is a completely editable PowerPoint presentation and is available for immediate download. Download now and impress your audience.

Healthcare Management KPI Metrics Showing Treatment Cost And Waiting Time Ppt PowerPoint Presentation Ideas Files
Presenting this set of slides with name healthcare management kpi metrics showing treatment cost and waiting time ppt powerpoint presentation ideas files. This is a three stage process. The stages in this process are business, management, planning, strategy, marketing. This is a completely editable PowerPoint presentation and is available for immediate download. Download now and impress your audience.
Healthcare Management KPI Metrics Showing Incidents Length Of Stay Ppt PowerPoint Presentation Icon Background
Presenting this set of slides with name healthcare management kpi metrics showing incidents length of stay ppt powerpoint presentation icon background. This is a four stage process. The stages in this process are incidents, average waiting time, overall patient satisfaction, management, marketing. This is a completely editable PowerPoint presentation and is available for immediate download. Download now and impress your audience.
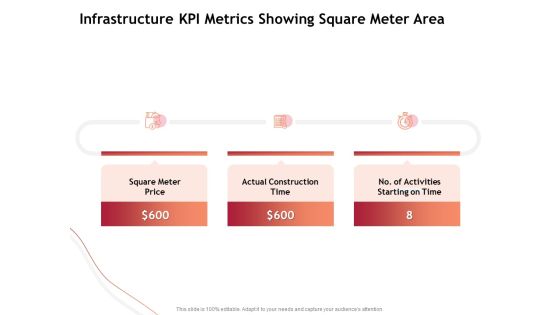
Performance Measuement Of Infrastructure Project Infrastructure KPI Metrics Showing Square Meter Area Download PDF
Presenting this set of slides with name performance measuement of infrastructure project infrastructure kpi metrics showing square meter area download pdf. This is a three stage process. The stages in this process are square meter price, actual construction time, number of activities starting on time. This is a completely editable PowerPoint presentation and is available for immediate download. Download now and impress your audience.

Introducing CRM Framework Within Organization Customer Relationship Management KPI Metrics Orders Background PDF
Presenting this set of slides with name introducing crm framework within organization customer relationship management kpi metrics orders background pdf. This is a four stage process. The stages in this process are customer, feedback form, total orders, mails 30 days. This is a completely editable PowerPoint presentation and is available for immediate download. Download now and impress your audience.
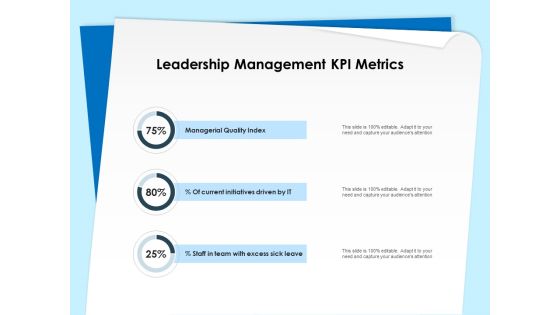
Executive Leadership Programs Leadership Management KPI Metrics Ppt PowerPoint Presentation Infographics Format Ideas PDF
Presenting this set of slides with name executive leadership programs leadership management kpi metrics ppt powerpoint presentation infographics format ideas pdf. This is a three stage process. The stages in this process are managerial quality index, current initiatives driven it, staff team excess sick leave. This is a completely editable PowerPoint presentation and is available for immediate download. Download now and impress your audience.
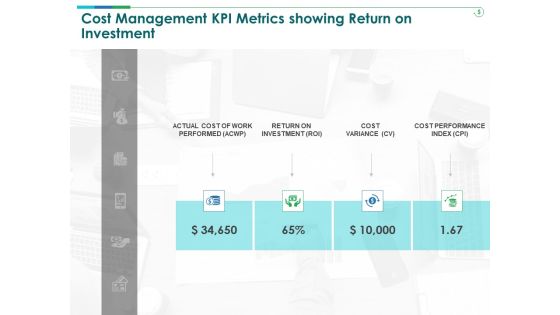
TCM Cost Management KPI Metrics Showing Return On Investment Ppt Professional Graphics PDF
Presenting this set of slides with name tcm cost management kpi metrics showing return on investment ppt professional graphics pdf. This is a four stage process. The stages in this process are performed, cost, investment, variance, return. This is a completely editable PowerPoint presentation and is available for immediate download. Download now and impress your audience.

Facts Assessment Business Intelligence KPI Dashboard Processing Ppt PowerPoint Presentation Summary Graphics Template PDF
Presenting this set of slides with name facts assessment business intelligence kpi dashboard processing ppt powerpoint presentation summary graphics template pdf. This is a one stage process. The stages in this process are brand awareness, web traffic, social media, grp, mind, processing. This is a completely editable PowerPoint presentation and is available for immediate download. Download now and impress your audience.

Firm Productivity Administration Business Intelligence KPI Dashboard Mind Ppt PowerPoint Presentation Outline Graphics PDF
Presenting this set of slides with name firm productivity administration business intelligence kpi dashboard mind ppt powerpoint presentation outline graphics pdf. This is a four stage process. The stages in this process are social media, web traffic, grp, brand awareness, mind, processing. This is a completely editable PowerPoint presentation and is available for immediate download. Download now and impress your audience.

Business Activities Assessment Examples Infrastructure KPI Metrics Showing Cost Saving Infographics PDF
Presenting business activities assessment examples infrastructure kpi metrics showing cost saving infographics pdf to provide visual cues and insights. Share and navigate important information on three stages that need your due attention. This template can be used to pitch topics like net project revenue per employee, cost savings . In addtion, this PPT design contains high resolution images, graphics, etc, that are easily editable and available for immediate download.
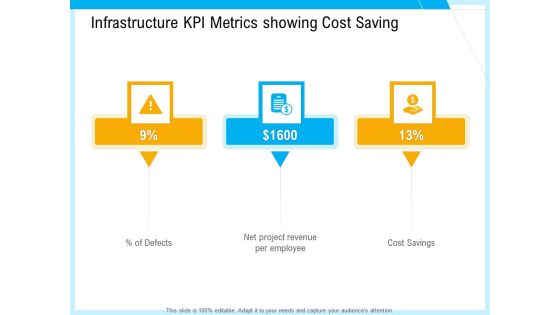
IT And Cloud Facilities Management Infrastructure KPI Metrics Showing Cost Saving Information PDF
This is a it and cloud facilities management infrastructure kpi metrics showing cost saving information pdf template with various stages. Focus and dispense information on three stages using this creative set, that comes with editable features. It contains large content boxes to add your information on topics like defects, net project revenue per employee, cost savings. You can also showcase facts, figures, and other relevant content using this PPT layout. Grab it now.
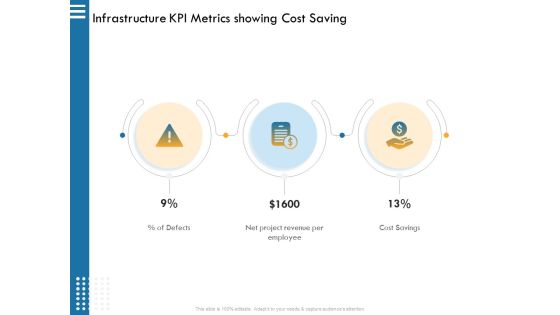
IT Infrastructure Governance Infrastructure KPI Metrics Showing Cost Saving Ppt Infographic Template Graphic Images PDF
This is a it infrastructure governance infrastructure kpi metrics showing cost saving ppt infographic template graphic images pdf. template with various stages. Focus and dispense information on three stages using this creative set, that comes with editable features. It contains large content boxes to add your information on topics like defects, net project revenue per employee, cost savings. You can also showcase facts, figures, and other relevant content using this PPT layout. Grab it now

Substructure Segment Analysis Infrastructure KPI Metrics Showing Cost Saving Ppt Ideas Background Designs PDF
Presenting substructure segment analysis infrastructure kpi metrics showing cost saving ppt ideas background designs pdf to provide visual cues and insights. Share and navigate important information on three stages that need your due attention. This template can be used to pitch topics like cost savings, net project revenue per employee, defects. In addition, this PPT design contains high-resolution images, graphics, etc, that are easily editable and available for immediate download.

Online Distribution Services Ecommerce Management KPI Metrics Visitor Ppt Gallery Skills PDF
Presenting online distribution services ecommerce management kpi metrics visitor ppt gallery skills pdf to provide visual cues and insights. Share and navigate important information on five stages that need your due attention. This template can be used to pitch topics like conversion rate, revenue, value, target. In addtion, this PPT design contains high resolution images, graphics, etc, that are easily editable and available for immediate download.
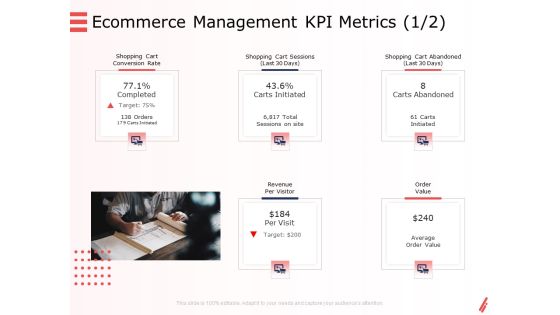
Digital Products And Services Ecommerce Management KPI Metrics Management Ppt Slides Gridlines PDF
Presenting digital products and services ecommerce management kpi metrics management ppt slides gridlines pdf to provide visual cues and insights. Share and navigate important information on five stages that need your due attention. This template can be used to pitch topics like conversion rate, revenue, value, target. In addtion, this PPT design contains high resolution images, graphics, etc, that are easily editable and available for immediate download.
Facility Management Infrastructure KPI Metrics Showing Cost Saving Ppt Icon Skills PDF
This is a facility management infrastructure kpi metrics showing cost saving ppt icon skills pdf template with various stages. Focus and dispense information on three stages using this creative set, that comes with editable features. It contains large content boxes to add your information on topics like percent of defects, net project revenue per employee, cost savings. You can also showcase facts, figures, and other relevant content using this PPT layout. Grab it now.
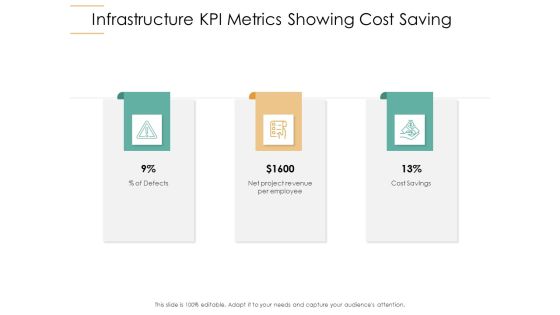
Infrastructure Strategies Infrastructure KPI Metrics Showing Cost Saving Ppt Ideas Maker PDF
This is a infrastructure strategies infrastructure kpi metrics showing cost saving ppt ideas maker pdf template with various stages. Focus and dispense information on three stages using this creative set, that comes with editable features. It contains large content boxes to add your information on topics like percent of defects, net project revenue per employee, cost savings. You can also showcase facts, figures, and other relevant content using this PPT layout. Grab it now.

IT Infrastructure Administration Infrastructure KPI Metrics Showing Cost Saving Graphics PDF
This is a it infrastructure administration infrastructure kpi metrics showing cost saving graphics pdf template with various stages. Focus and dispense information on three stages using this creative set, that comes with editable features. It contains large content boxes to add your information on topics like percent of defects, net project revenue per employee, cost savings. You can also showcase facts, figures, and other relevant content using this PPT layout. Grab it now.
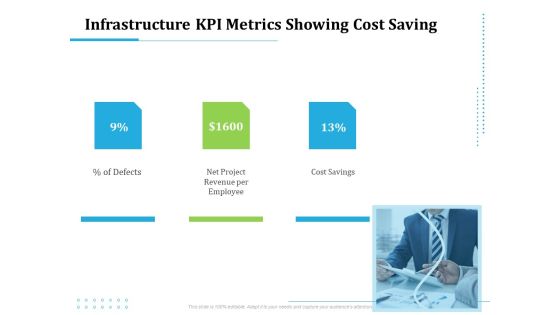
Information Technology Functions Management Infrastructure KPI Metrics Showing Cost Saving Ppt File Topics PDF
This is a information technology functions management infrastructure kpi metrics showing cost saving ppt file topics pdf template with various stages. Focus and dispense information on three stages using this creative set, that comes with editable features. It contains large content boxes to add your information on topics like percent defects, net project revenue per employee, cost savings. You can also showcase facts, figures, and other relevant content using this PPT layout. Grab it now.
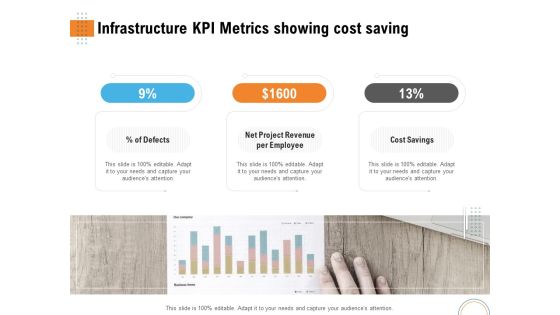
Utilizing Infrastructure Management Using Latest Methods Infrastructure KPI Metrics Showing Cost Saving Background PDF
This is a utilizing infrastructure management using latest methods infrastructure kpi metrics showing cost saving background pdf template with various stages. Focus and dispense information on three stages using this creative set, that comes with editable features. It contains large content boxes to add your information on topics like percent defects, net project revenue per employee, cost savings. You can also showcase facts, figures, and other relevant content using this PPT layout. Grab it now.

Digital Enterprise Management Ecommerce Management KPI Metrics Ppt PowerPoint Presentation Layout PDF
Presenting digital enterprise management ecommerce management kpi metrics ppt powerpoint presentation layout pdf to provide visual cues and insights. Share and navigate important information on five stages that need your due attention. This template can be used to pitch topics like shopping cart conversion rate, shopping cart sessions, shopping cart abandoned, revenue per visitor, order value. In addition, this PPT design contains high-resolution images, graphics, etc, that are easily editable and available for immediate download.

Infrastructure Designing And Administration Infrastructure KPI Metrics Showing Cost Saving Download PDF
This is a infrastructure designing and administration infrastructure kpi metrics showing cost saving download pdf template with various stages. Focus and dispense information on three stages using this creative set, that comes with editable features. It contains large content boxes to add your information on topics like percent of defects, net project revenue per employee, cost savings. You can also showcase facts, figures, and other relevant content using this PPT layout. Grab it now.
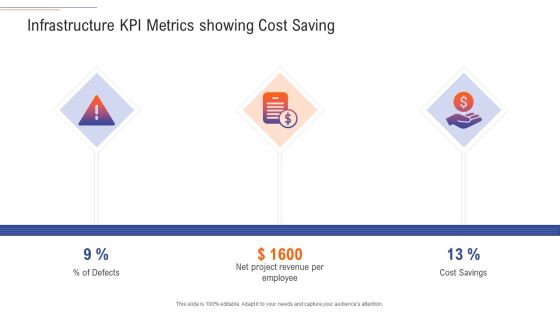
Support Services Management Infrastructure KPI Metrics Showing Cost Saving Diagrams PDF
This is a support services management infrastructure kpi metrics showing cost saving diagrams pdf template with various stages. Focus and dispense information on three stages using this creative set, that comes with editable features. It contains large content boxes to add your information on topics like percent of defects, net project revenue per employee, cost savings. You can also showcase facts, figures, and other relevant content using this PPT layout. Grab it now.
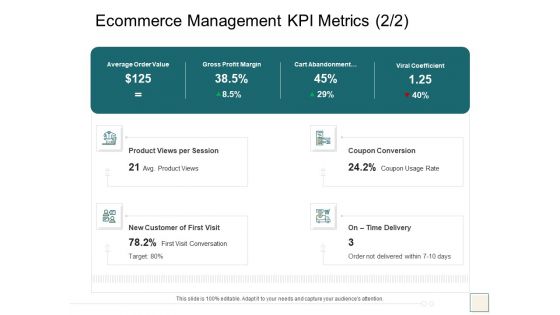
B2B Trade Management Ecommerce Management KPI Metrics Average Order Value Summary PDF
This is a b2b trade management ecommerce management kpi metrics average order value summary pdf template with various stages. Focus and dispense information on four stages using this creative set, that comes with editable features. It contains large content boxes to add your information on topics like product views per session, coupon conversion, new customer first visit, on time delivery. You can also showcase facts, figures, and other relevant content using this PPT layout. Grab it now.

IT And Cloud Facilities Management Infrastructure KPI Metrics Showing Square Meter Area Designs PDF
Presenting it and cloud facilities management infrastructure kpi metrics showing square meter area designs pdf to provide visual cues and insights. Share and navigate important information on three stages that need your due attention. This template can be used to pitch topics like square meter, price actual, construction time, activities starting time. In addition, this PPT design contains high-resolution images, graphics, etc, that are easily editable and available for immediate download.

Substructure Segment Analysis Infrastructure KPI Metrics Showing Square Meter Area Diagrams PDF
This is a substructure segment analysis infrastructure kpi metrics showing square meter area diagrams pdf template with various stages. Focus and dispense information on three stages using this creative set, that comes with editable features. It contains large content boxes to add your information on topics like square meter price, actual construction time, activities starting on time. You can also showcase facts, figures, and other relevant content using this PPT layout. Grab it now.

Online Distribution Services Ecommerce Management KPI Metrics Delivery Ppt Visual Aids Inspiration PDF
This is a online distribution services ecommerce management kpi metrics delivery ppt visual aids inspiration pdf template with various stages. Focus and dispense information on four stages using this creative set, that comes with editable features. It contains large content boxes to add your information on topics like average order value, gross profit margin, cart abandonment, viral coefficient. You can also showcase facts, figures, and other relevant content using this PPT layout. Grab it now.

Digital Products And Services Ecommerce Management KPI Metrics Delivery Ppt Summary Images PDF
This is a digital products and services ecommerce management kpi metrics delivery ppt summary images pdf template with various stages. Focus and dispense information on four stages using this creative set, that comes with editable features. It contains large content boxes to add your information on topics like average order value, gross profit margin, cart abandonment, viral coefficient. You can also showcase facts, figures, and other relevant content using this PPT layout. Grab it now.

Ecommerce Solution Providers Ecommerce Management KPI Metrics Value Ppt Ideas Background Designs PDF
This is a ecommerce solution providers ecommerce management kpi metrics value ppt ideas background designs pdf template with various stages. Focus and dispense information on four stages using this creative set, that comes with editable features. It contains large content boxes to add your information on topics like average order value, gross profit margin, cart abandonment, viral coefficient. You can also showcase facts, figures, and other relevant content using this PPT layout. Grab it now.

Pharmaceutical Management Healthcare Management KPI Metrics Showing Treatment Cost And Waiting Time Portrait PDF
This is a pharmaceutical management healthcare management kpi metrics showing treatment cost and waiting time portrait pdf template with various stages. Focus and dispense information on three stages using this creative set, that comes with editable features. It contains large content boxes to add your information on topics like average treatment cost ages, average nurse patient ratio, average time see doctor. You can also showcase facts, figures, and other relevant content using this PPT layout. Grab it now.

Information Technology Functions Management Infrastructure KPI Metrics Showing Square Meter Area Summary PDF
Presenting information technology functions management infrastructure kpi metrics showing square meter area summary pdf to provide visual cues and insights. Share and navigate important information on three stages that need your due attention. This template can be used to pitch topics like square meter price, actual construction time, no activities starting time. In addition, this PPT design contains high-resolution images, graphics, etc, that are easily editable and available for immediate download.
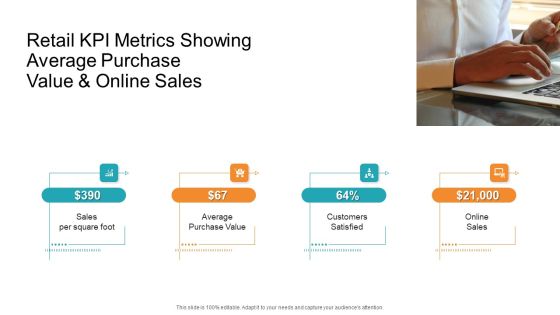
Retail KPI Metrics Showing Average Purchase Value And Online Sales Template PDF
This is a retail kpi metrics showing average purchase value and online sales template pdf. template with various stages. Focus and dispense information on four stages using this creative set, that comes with editable features. It contains large content boxes to add your information on topics like sales per square foot, average purchase, value customers satisfied, online sales. You can also showcase facts, figures, and other relevant content using this PPT layout. Grab it now.

Construction Engineering And Industrial Facility Management Infrastructure KPI Metrics Showing Square Meter Area Ideas PDF
Presenting construction engineering and industrial facility management infrastructure kpi metrics showing square meter area ideas pdf to provide visual cues and insights. Share and navigate important information on three stages that need your due attention. This template can be used to pitch topics like square meter price, actual construction time, no of activities starting on time . In addtion, this PPT design contains high resolution images, graphics, etc, that are easily editable and available for immediate download.

Analyzing And Deploying Effective CMS Customer Checkout Behavior KPI Dashboard Elements PDF
This slide represents the dashboard to help management in analyzing the point at which customers leave the checkout process. It includes details related to KPIs such as shipping drop off, payment drop off etc. If you are looking for a format to display your unique thoughts, then the professionally designed Analyzing And Deploying Effective CMS Customer Checkout Behavior KPI Dashboard Elements PDF is the one for you. You can use it as a Google Slides template or a PowerPoint template. Incorporate impressive visuals, symbols, images, and other charts. Modify or reorganize the text boxes as you desire. Experiment with shade schemes and font pairings. Alter, share or cooperate with other people on your work. Download Analyzing And Deploying Effective CMS Customer Checkout Behavior KPI Dashboard Elements PDF and find out how to give a successful presentation. Present a perfect display to your team and make your presentation unforgettable.
Digital Enterprise Management Ecommerce Management KPI Metrics Conversion Ppt PowerPoint Presentation Icon Master Slide PDF
This is a digital enterprise management ecommerce management kpi metrics conversion ppt powerpoint presentation icon master slide pdf template with various stages. Focus and dispense information on four stages using this creative set, that comes with editable features. It contains large content boxes to add your information on topics like product views per session, coupon conversion, new customer first visit, time delivery, average order value, gross profit margin, cart abandonment, viral coefficient. You can also showcase facts, figures, and other relevant content using this PPT layout. Grab it now.

Understanding Our Cash Flow Statements KPI Fy 21 To 22 Debt Collection Improvement Plan Slides PDF
Purpose of the following slide is to show the major key performing indicators of the organization , these KPIs can be the operation activities, cash flow from financing activities, investing activities and the net decrease in cash flow. Presenting understanding our cash flow statements kpi fy 21 to 22 debt collection improvement plan slides pdf to provide visual cues and insights. Share and navigate important information on four stages that need your due attention. This template can be used to pitch topics like cash flow from operations, cash flow from investing activities, cash flow from financing activities, change in cash and cash equivalents. In addtion, this PPT design contains high resolution images, graphics, etc, that are easily editable and available for immediate download.

KPI Dashboard To Track Security Risk Events Ppt Pictures Deck PDF
This slide displays KPI dashboard that company will use to track multiple risk events. Metrics covered in the dashboard are residual risks by period and risk category by total risk rating. Deliver and pitch your topic in the best possible manner with this kpi dashboard to track security risk events ppt pictures deck pdf. Use them to share invaluable insights on technology risk, system, financial risk and impress your audience. This template can be altered and modified as per your expectations. So, grab it now.

Risk Based Procedures To IT Security KPI Dashboard To Track Security Risk Events Designs PDF
This slide displays KPI dashboard that company will use to track multiple risk events. Metrics covered in the dashboard are residual risks by period and risk category by total risk rating. Deliver and pitch your topic in the best possible manner with this Risk Based Procedures To IT Security KPI Dashboard To Track Security Risk Events Designs PDF. Use them to share invaluable insights on Governance Risk, People Risk, Financial Risk and impress your audience. This template can be altered and modified as per your expectations. So, grab it now.

KPI Dashboard To Monitor E Commerce Revenue Analysis Performance Mockup PDF
This slide shows the key performance indicators dashboard which can be used to analyze current financial position of e-commerce business. It includes metrics such as revenue, expenses, profit, cash in hand, etc. Showcasing this set of slides titled KPI Dashboard To Monitor E Commerce Revenue Analysis Performance Mockup PDF. The topics addressed in these templates are Accounts Receivable, Accounts Payable, Revenue, Expenses. All the content presented in this PPT design is completely editable. Download it and make adjustments in color, background, font etc. as per your unique business setting.

KPI Dashboard To Monitor Beauty Care Products Sales Performance Ppt Outline Example Topics PDF
This slide shows the key performance indicators dashboard which can be used to analyze current financial position of cosmetic business. It includes metrics such as sales, expenses, profit, cash in hand, etc. Showcasing this set of slides titled KPI Dashboard To Monitor Beauty Care Products Sales Performance Ppt Outline Example Topics PDF. The topics addressed in these templates are Accounts Receivable, Profit Margin, Expense. All the content presented in this PPT design is completely editable. Download it and make adjustments in color, background, font etc. as per your unique business setting.

KPI Dashboard To Track Beauty Care Products Sales Performance Ppt Outline Pictures PDF
This slide shows the key performance indicators dashboard which can be used to analyze current financial position of cosmetic business. It includes metrics such as sales, expenses, profit, cash in hand, etc. Showcasing this set of slides titled KPI Dashboard To Track Beauty Care Products Sales Performance Ppt Outline Pictures PDF. The topics addressed in these templates are Sales Number, Total Sales, Total Profit, Cost. All the content presented in this PPT design is completely editable. Download it and make adjustments in color, background, font etc. as per your unique business setting.

Debt Retrieval Techniques Understanding Our Cash Flow Statements Kpi Fy 21 22 Ppt Inspiration Deck PDF
Purpose of the following slide is to show the major key performing indicators of the organization , these KPIs can be the operation activities, cash flow from financing activities, investing activities and the net decrease in cash flow Deliver an awe inspiring pitch with this creative debt retrieval techniques understanding our cash flow statements kpi fy 21 22 ppt inspiration deck pdf bundle. Topics like operations, investing activities, net decease in cash, financial activities can be discussed with this completely editable template. It is available for immediate download depending on the needs and requirements of the user.
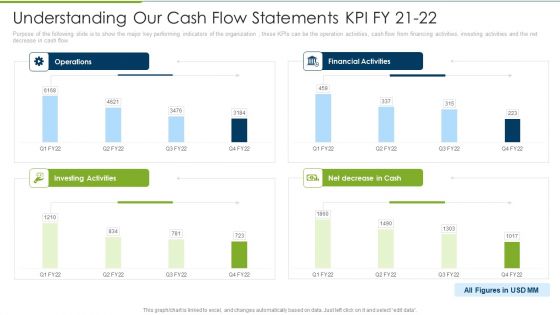
Debt Collection Improvement Plan Understanding Our Cash Flow Statements KPI Fy 21 To 22 Elements PDF
Purpose of the following slide is to show the major key performing indicators of the organization , these KPIs can be the operation activities, cash flow from financing activities, investing activities and the net decrease in cash flow. Deliver and pitch your topic in the best possible manner with this debt collection improvement plan understanding our cash flow statements kpi fy 21 to 22 elements pdf. Use them to share invaluable insights on operations, financial activities, investing activities, net decrease cash and impress your audience. This template can be altered and modified as per your expectations. So, grab it now.
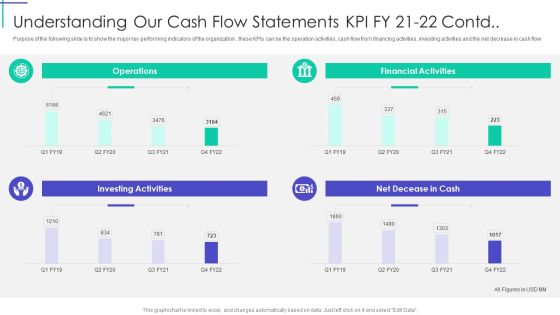
Understanding Our Cash Flow Statements KPI Fy 21 To 22 Contd Themes PDF
Purpose of the following slide is to show the major key performing indicators of the organization , these KPIs can be the operation activities, cash flow from financing activities, investing activities and the net decrease in cash flow Deliver and pitch your topic in the best possible manner with this Understanding Our Cash Flow Statements KPI Fy 21 To 22 Contd Themes PDF. Use them to share invaluable insights on Investing Activities, Financial Activities, Operations and impress your audience. This template can be altered and modified as per your expectations. So, grab it now.

KPI Dashboard To Track Borrowing System Management System Ppt Visual Aids Portfolio PDF
This slide depicts a dashboard which can be used by banks or financial institutions to track the status of loan activities and management systems. Key performing indicators include existing customers, ongoing loans, loan trends etc. Showcasing this set of slides titled KPI Dashboard To Track Borrowing System Management System Ppt Visual Aids Portfolio PDF. The topics addressed in these templates are Existing Customers, Ongoing Loans, Todays Payment Received. All the content presented in this PPT design is completely editable. Download it and make adjustments in color, background, font etc. as per your unique business setting.
Sustainability Calculation With KPI Milestones Achieved In Fy20 Ppt PowerPoint Presentation Icon Slides PDF
This slide demonstrates monthly milestones achieved by the company in 2020 financial year. It also includes that company listed its name in fortune 1000 list of companies. This is a sustainability calculation with kpi milestones achieved in fy20 ppt powerpoint presentation icon slides pdf template with various stages. Focus and dispense information on twelve stages using this creative set, that comes with editable features. It contains large content boxes to add your information on topics like milestones achieved in fy20. You can also showcase facts, figures, and other relevant content using this PPT layout. Grab it now.

Milestones Achieved In FY22 Company Performance Evaluation Using KPI Icons PDF
This slide demonstrates monthly milestones achieved by the company in 2022 financial year. It also includes that company listed its name in fortune 1000 list of companies. Presenting Milestones Achieved In FY22 Company Performance Evaluation Using KPI Icons PDF to provide visual cues and insights. Share and navigate important information on twelve stages that need your due attention. This template can be used to pitch topics like Company, Milestones Achieved, New Product. In addtion, this PPT design contains high resolution images, graphics, etc, that are easily editable and available for immediate download.

Organizational Program To Improve Team Productivity And Efficiency Company Financial Pictures PDF
This slide highlights KPI dashboard exhibiting overall improvement in the financial performance of company as the consequences of program implementation. Deliver an awe inspiring pitch with this creative organizational program to improve team productivity and efficiency company financial pictures pdf bundle. Topics like company financial performance dashboard can be discussed with this completely editable template. It is available for immediate download depending on the needs and requirements of the user.
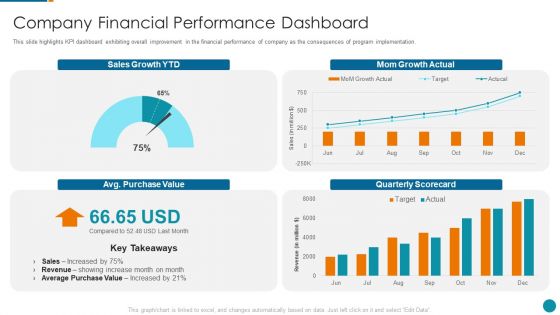
Strategic Procedure To Improve Employee Efficiency Company Financial Performance Dashboard Infographics PDF
This slide highlights KPI dashboard exhibiting overall improvement in the financial performance of company as the consequences of program implementation. Deliver and pitch your topic in the best possible manner with this strategic procedure to improve employee efficiency company financial performance dashboard infographics pdf Use them to share invaluable insights on company financial performance dashboard and impress your audience. This template can be altered and modified as per your expectations. So, grab it now.
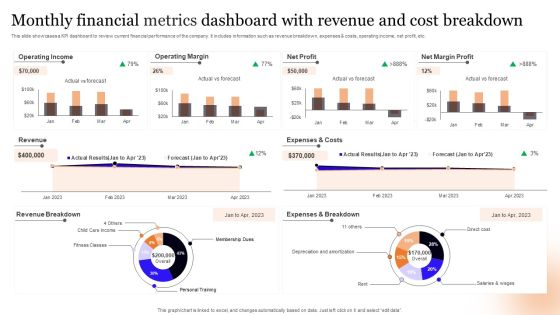
Monthly Financial Metrics Dashboard With Revenue And Cost Breakdown Information PDF
This slide showcases a KPI dashboard to review current financial performance of the company. It includes information such as revenue breakdown, expenses and costs, operating income, net profit, etc. Pitch your topic with ease and precision using this Monthly Financial Metrics Dashboard With Revenue And Cost Breakdown Information PDF. This layout presents information on Operating Income, Operating Margin, Net Profit. It is also available for immediate download and adjustment. So, changes can be made in the color, design, graphics or any other component to create a unique layout.

Fiscal And Operational Assessment Infrastructure KPI Dashboard Showing Resource Allocation Mockup PDF
Deliver an awe inspiring pitch with this creative fiscal and operational assessment infrastructure kpi dashboard showing resource allocation mockup pdf bundle. Topics like resource allocation, project financial, days per project can be discussed with this completely editable template. It is available for immediate download depending on the needs and requirements of the user.

IT And Cloud Facilities Management Infrastructure KPI Dashboard Showing Project Revenue Clipart PDF
Deliver an awe-inspiring pitch with this creative it and cloud facilities management infrastructure kpi dashboard showing project revenue clipart pdf bundle. Topics like days per project, project financial, resource allocation, delivery timeline and resources, project can be discussed with this completely editable template. It is available for immediate download depending on the needs and requirements of the user.

KPI Framework For Healthcare Industry Ppt PowerPoint Presentation Gallery Example PDF
Showcasing this set of slides titled kpi framework for healthcare industry ppt powerpoint presentation gallery example pdf The topics addressed in these templates are financial, profit ratio, metrics All the content presented in this PPT design is completely editable. Download it and make adjustments in color, background, font etc. as per your unique business setting.
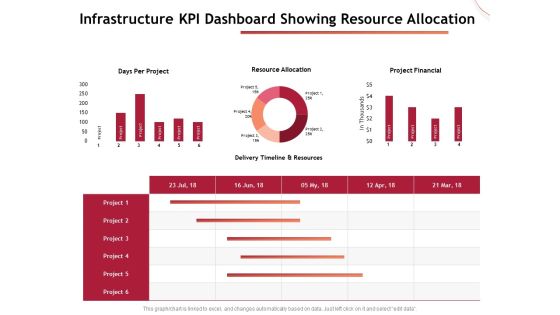
Performance Measuement Of Infrastructure Project Infrastructure KPI Dashboard Showing Resource Allocation Mockup PDF
Presenting this set of slides with name performance measuement of infrastructure project infrastructure kpi dashboard showing resource allocation mockup pdf. The topics discussed in these slides are days per project, resource allocation, project financial. This is a completely editable PowerPoint presentation and is available for immediate download. Download now and impress your audience.
Functional Analysis Of Business Operations Infrastructure KPI Dashboard Showing Resource Allocation Icons PDF
Presenting this set of slides with name functional analysis of business operations infrastructure kpi dashboard showing resource allocation icons pdf. The topics discussed in these slides are project financial, resource allocation, timeline. This is a completely editable PowerPoint presentation and is available for immediate download. Download now and impress your audience.
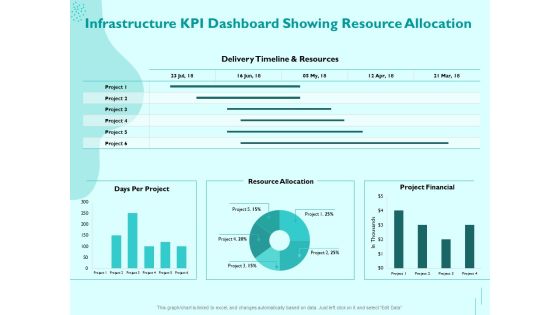
Managing IT Operating System Infrastructure KPI Dashboard Showing Resource Allocation Portrait PDF
Presenting this set of slides with name managing it operating system infrastructure kpi dashboard showing resource allocation portrait pdf. The topics discussed in these slides are delivery timeline and resources, resource allocation, project financial, days per project. This is a completely editable PowerPoint presentation and is available for immediate download. Download now and impress your audience.
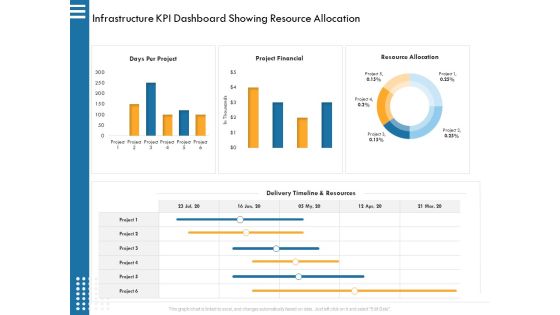
IT Infrastructure Governance Infrastructure KPI Dashboard Showing Resource Allocation Ppt Infographic Template Background Designs PDF
Deliver an awe inspiring pitch with this creative it infrastructure governance infrastructure kpi dashboard showing resource allocation ppt infographic template background designs pdf. bundle. Topics like days, financial, resource, allocation can be discussed with this completely editable template. It is available for immediate download depending on the needs and requirements of the user.
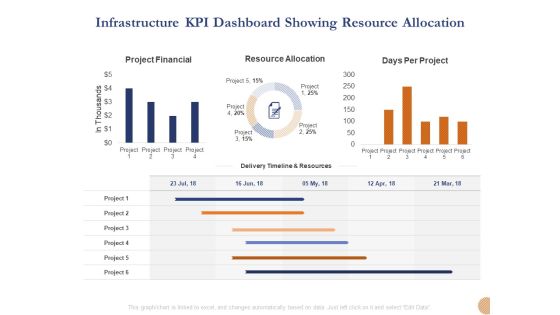
Substructure Segment Analysis Infrastructure KPI Dashboard Showing Resource Allocation Demonstration PDF
Deliver an awe-inspiring pitch with this creative substructure segment analysis infrastructure kpi dashboard showing resource allocation demonstration pdf bundle. Topics like project financial, resource allocation, days per project can be discussed with this completely editable template. It is available for immediate download depending on the needs and requirements of the user.
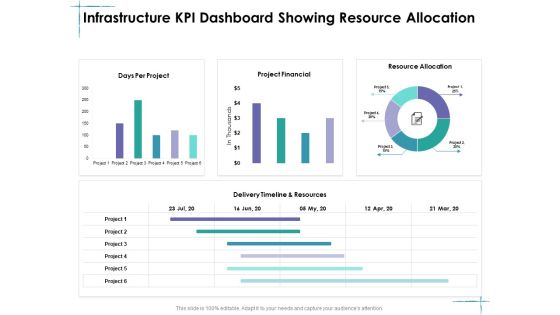
Facility Management Infrastructure KPI Dashboard Showing Resource Allocation Ppt Inspiration Outfit PDF
Deliver an awe inspiring pitch with this creative facility management infrastructure kpi dashboard showing resource allocation ppt inspiration outfit pdf bundle. Topics like days per project, project financial, resource allocation, delivery timeline and resources can be discussed with this completely editable template. It is available for immediate download depending on the needs and requirements of the user.
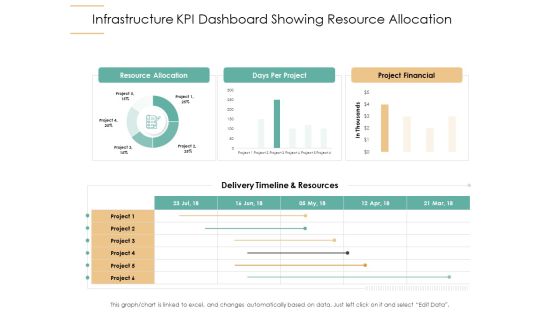
Infrastructure Strategies Infrastructure KPI Dashboard Showing Resource Allocation Ppt File Design Templates PDF
Deliver an awe inspiring pitch with this creative infrastructure strategies infrastructure kpi dashboard showing resource allocation ppt file design templates pdf bundle. Topics like days per project, project financial, resource allocation, delivery timeline and resources can be discussed with this completely editable template. It is available for immediate download depending on the needs and requirements of the user.
IT Infrastructure Administration Infrastructure KPI Dashboard Showing Resource Allocation Ppt Icon Clipart Images PDF
Deliver an awe inspiring pitch with this creative it infrastructure administration infrastructure kpi dashboard showing resource allocation ppt icon clipart images pdf bundle. Topics like days per project, project financial, resource allocation, delivery timeline and resources can be discussed with this completely editable template. It is available for immediate download depending on the needs and requirements of the user.
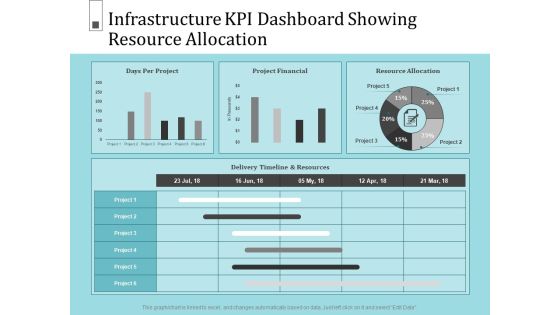
Infrastructure Project Management In Construction Infrastructure KPI Dashboard Showing Resource Allocation Pictures PDF
Deliver and pitch your topic in the best possible manner with this infrastructure project management in construction infrastructure kpi dashboard showing resource allocation pictures pdf. Use them to share invaluable insights on project, resource allocation, project financial, days per project and impress your audience. This template can be altered and modified as per your expectations. So, grab it now.
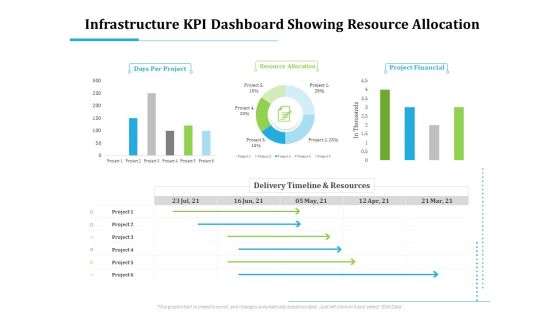
Information Technology Functions Management Infrastructure KPI Dashboard Showing Resource Allocation Background PDF
Deliver and pitch your topic in the best possible manner with this information technology functions management infrastructure kpi dashboard showing resource allocation background pdf. Use them to share invaluable insights on days per project, resource allocation, project financial, delivery timeline and resources and impress your audience. This template can be altered and modified as per your expectations. So, grab it now.

Utilizing Infrastructure Management Using Latest Methods Infrastructure KPI Dashboard Showing Resource Allocation Demonstration PDF
Deliver an awe-inspiring pitch with this creative utilizing infrastructure management using latest methods infrastructure kpi dashboard showing resource allocation demonstration pdf bundle. Topics like days per project, resource allocation, project financial, delivery timeline and resources can be discussed with this completely editable template. It is available for immediate download depending on the needs and requirements of the user.

Civil Infrastructure Designing Services Management Infrastructure Kpi Dashboard Showing Resource Allocation Diagrams PDF
Deliver and pitch your topic in the best possible manner with this civil infrastructure designing services management infrastructure kpi dashboard showing resource allocation diagrams pdf. Use them to share invaluable insights on project financial, resource allocation, resources and impress your audience. This template can be altered and modified as per your expectations. So, grab it now.

Business Activities Assessment Examples Infrastructure KPI Dashboard Showing Resource Allocation Summary PDF
Deliver an awe inspiring pitch with this creative business activities assessment examples infrastructure kpi dashboard showing resource allocation summary pdf bundle. Topics like days per project, resource allocation, project financial, delivery timeline and resources can be discussed with this completely editable template. It is available for immediate download depending on the needs and requirements of the user.

Improving Operational Activities Enterprise Infrastructure Kpi Dashboard Showing Resource Allocation Ideas PDF
Deliver and pitch your topic in the best possible manner with this improving operational activities enterprise infrastructure kpi dashboard showing resource allocation ideas pdf. Use them to share invaluable insights on days per project, project financial, resource allocation and impress your audience. This template can be altered and modified as per your expectations. So, grab it now.

Infrastructure Building Administration Infrastructure KPI Dashboard Showing Resource Allocation Background PDF
Deliver and pitch your topic in the best possible manner with this infrastructure building administration infrastructure kpi dashboard showing resource allocation background pdf. Use them to share invaluable insights on days per project, project financial, resource allocation and impress your audience. This template can be altered and modified as per your expectations. So, grab it now.

Infrastructure Designing And Administration Infrastructure KPI Dashboard Showing Resource Allocation Demonstration PDF
Deliver an awe inspiring pitch with this creative infrastructure designing and administration infrastructure kpi dashboard showing resource allocation demonstration pdf bundle. Topics like days per project, project financial, resource allocation, delivery timeline and resources can be discussed with this completely editable template. It is available for immediate download depending on the needs and requirements of the user.

Support Services Management Infrastructure KPI Dashboard Showing Resource Allocation Structure PDF
Deliver an awe inspiring pitch with this creative support services management infrastructure kpi dashboard showing resource allocation structure pdf bundle. Topics like days per project, project financial, resource allocation, delivery timeline and resources can be discussed with this completely editable template. It is available for immediate download depending on the needs and requirements of the user.
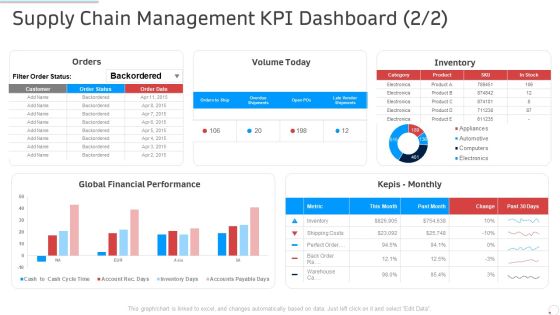
Supply Chain Management Kpi Dashboard Manufacturing Control Ppt Outline Picture PDF
Deliver an awe inspiring pitch with this creative supply chain management kpi dashboard manufacturing control ppt outline picture pdf bundle. Topics like global, financial, performance, inventory can be discussed with this completely editable template. It is available for immediate download depending on the needs and requirements of the user.

Scorecard For Sustainable SCM With KPI Ppt PowerPoint Presentation File Graphics Design PDF
Showcasing this set of slides titled scorecard for sustainable scm with kpi ppt powerpoint presentation file graphics design pdf. The topics addressed in these templates are financial, process, customer. All the content presented in this PPT design is completely editable. Download it and make adjustments in color, background, font etc. as per your unique business setting.
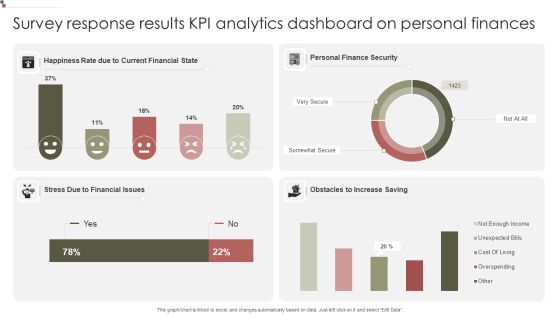
Survey Response Results KPI Analytics Dashboard On Personal Finances Guidelines PDF
Showcasing this set of slides titled Survey Response Results KPI Analytics Dashboard On Personal Finances Guidelines PDF. The topics addressed in these templates are Current Financial, Personal Finance, Obstacles Increase. All the content presented in this PPT design is completely editable. Download it and make adjustments in color, background, font etc. as per your unique business setting.

Performance Measuement Of Infrastructure Project Infrastructure KPI Dashboard Showing Project Revenue Brochure PDF
Presenting this set of slides with name performance measuement of infrastructure project infrastructure kpi dashboard showing project revenue brochure pdf. The topics discussed in these slide is infrastructure kpi dashboard showing project revenue. This is a completely editable PowerPoint presentation and is available for immediate download. Download now and impress your audience.

Cross Sell In Banking Industry Revenue Generation KPI Dashboard Ppt Infographic Template Portfolio PDF
Deliver and pitch your topic in the best possible manner with this cross sell in banking industry revenue generation kpi dashboard ppt infographic template portfolio pdf. Use them to share invaluable insights on revenue generation kpi dashboard and impress your audience. This template can be altered and modified as per your expectations. So, grab it now.

Cross Selling Of Retail Banking Products Revenue Generation KPI Dashboard Ppt Inspiration Rules PDF
Deliver and pitch your topic in the best possible manner with this cross selling of retail banking products revenue generation kpi dashboard ppt inspiration rules pdf. Use them to share invaluable insights on revenue generation kpi dashboard and impress your audience. This template can be altered and modified as per your expectations. So, grab it now.

Market Analysis Of Retail Sector Retail KPI Dashboard Showing Revenue Vs Units Sold Clipart PDF
Deliver an awe inspiring pitch with this creative market analysis of retail sector retail kpi dashboard showing revenue vs units sold clipart pdf bundle. Topics like retail kpi dashboard showing revenue vs units sold can be discussed with this completely editable template. It is available for immediate download depending on the needs and requirements of the user.

Construction Management Services Infrastructure KPI Dashboard Showing Project Revenue Ideas PDF
Deliver and pitch your topic in the best possible manner with this construction management services infrastructure kpi dashboard showing project revenue ideas pdf. Use them to share invaluable insights on infrastructure kpi dashboard showing project revenue and impress your audience. This template can be altered and modified as per your expectations. So, grab it now.
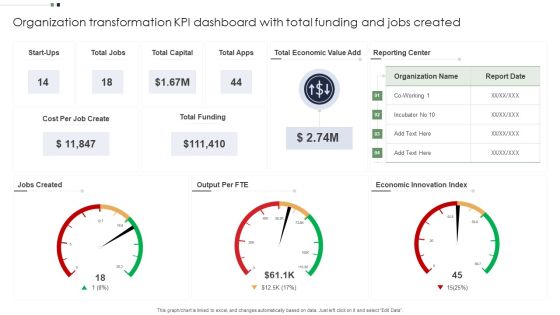
Organization Transformation KPI Dashboard With Total Funding And Jobs Created Information PDF
Pitch your topic with ease and precision using this Organization Transformation KPI Dashboard With Total Funding And Jobs Created Information PDF. This layout presents information on Organization Transformation KPI Dashboard, Economic, Capital. It is also available for immediate download and adjustment. So, changes can be made in the color, design, graphics or any other component to create a unique layout.

Facility Operations Contol Infrastructure Kpi Dashboard Showing Resource Allocation Slides PDF
Presenting this set of slides with name facility operations contol infrastructure kpi dashboard showing resource allocation slides pdf. The topics discussed in these slides are delivery timeline and resources, project financially, resource allocation, days per project. This is a completely editable PowerPoint presentation and is available for immediate download. Download now and impress your audience.

Construction Production Facilities Infrastructure KPI Dashboard Showing Resource Allocation Designs PDF
Presenting this set of slides with name construction production facilities infrastructure kpi dashboard showing resource allocation designs pdf. The topics discussed in these slides are delivery timeline and resources, project financially, resource allocation, days per project. This is a completely editable PowerPoint presentation and is available for immediate download. Download now and impress your audience.
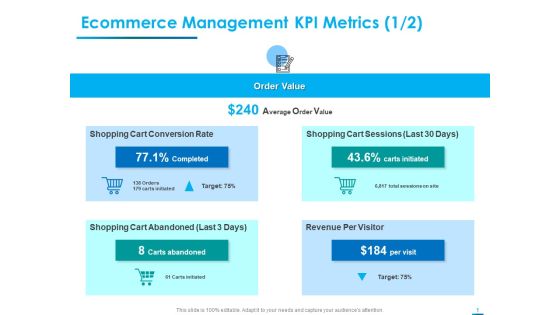
Internet Economy Ecommerce Management KPI Metrics Visitor Ppt Gallery Example Topics PDF
Deliver an awe inspiring pitch with this creative internet economy ecommerce management kpi metrics visitor ppt gallery example topics pdf bundle. Topics like ecommerce management kpi metrics, revenue per visitor can be discussed with this completely editable template. It is available for immediate download depending on the needs and requirements of the user.
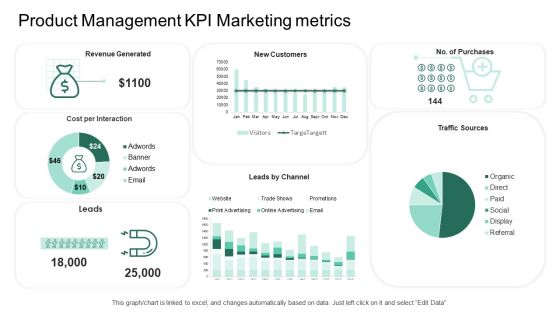
Market Potential Analysis Product Management KPI Marketing Metrics Ppt Infographic Template Ideas PDF
Deliver and pitch your topic in the best possible manner with this market potential analysis product management KPI marketing metrics ppt infographic template ideas pdf. Use them to share invaluable insights on revenue generated, cost per interaction, product management KPI marketing metrics and impress your audience. This template can be altered and modified as per your expectations. So, grab it now.

Product Commercialization Action Plan Product Management KPI Marketing Metrics Ppt Gallery Deck PDF
Deliver an awe inspiring pitch with this creative product commercialization action plan product management KPI marketing metrics ppt gallery deck pdf bundle. Topics like revenue generated, cost per interaction, product management kpi marketing metrics can be discussed with this completely editable template. It is available for immediate download depending on the needs and requirements of the user.
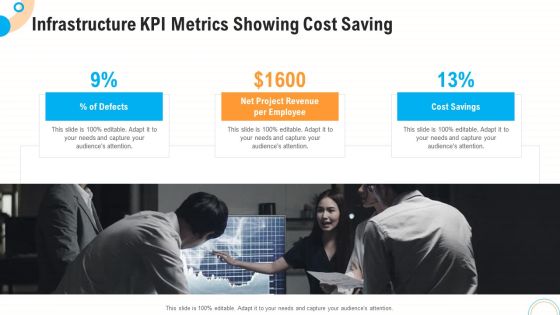
Fiscal And Operational Assessment Infrastructure KPI Metrics Showing Cost Saving Microsoft PDF
Presenting fiscal and operational assessment infrastructure kpi metrics showing cost saving microsoft pdf to provide visual cues and insights. Share and navigate important information on three stages that need your due attention. This template can be used to pitch topics like infrastructure kpi metrics showing cost saving. In addtion, this PPT design contains high resolution images, graphics, etc, that are easily editable and available for immediate download.

Strong Business Partnership To Ensure Company Success KPI Dashboard To Measure Partner Performance Sample PDF
Mentioned slide showcase KPI dashboard that can be used by a company to measure its partner performance. KPIS covered in the dashboard are revenue, number of pipelines closed and amount of pipeline closed versus business plan target.Deliver an awe inspiring pitch with this creative strong business partnership to ensure company success kpi dashboard to measure partner performance sample pdf bundle. Topics like kpi dashboard to measure partner performance can be discussed with this completely editable template. It is available for immediate download depending on the needs and requirements of the user.

Catering Business Advertisement Plan KPI Dashboard With Revenue Comparison Icons PDF
This slide shows the KPI dashboard of the catering industry to evaluate the actual and potential targets. It includes KPIs such as expenditure, sales revenue, beverage, etc. Showcasing this set of slides titled Catering Business Advertisement Plan KPI Dashboard With Revenue Comparison Icons PDF. The topics addressed in these templates are Expenditure, Revenue Comparison, Department. All the content presented in this PPT design is completely editable. Download it and make adjustments in color, background, font etc. as per your unique business setting.

Sales Optimization Best Practices To Close More Deals Sales KPI Dashboard Revenue Diagrams PDF
The sales dashboard is an effective tool that helps in monitoring various sales KPIs in order to aid sales teams in reaching sales goals by analyzing the sales performance. Deliver an awe inspiring pitch with this creative sales optimization best practices to close more deals sales kpi dashboard revenue diagrams pdf bundle. Topics like sales kpi dashboard can be discussed with this completely editable template. It is available for immediate download depending on the needs and requirements of the user.

Capital Investment Options KPI Dashboard To Monitor Project Status Summary PDF
Following slide illustrates KPI dashboard for monitoring the project performance. KPIs covered in the dashboard are project progress and task status, project health and project timeline. Deliver an awe inspiring pitch with this creative Capital Investment Options KPI Dashboard To Monitor Project Status Summary PDF bundle. Topics like Analysis, Development, Testing, Implement can be discussed with this completely editable template. It is available for immediate download depending on the needs and requirements of the user.

Introducing A New Product To The Market Business Performance KPI Dashboard Brochure PDF
Following slide covers business performance dashboard of the firm. It include KPIs such as average weekly sales revenue, above sales target, sales revenue and profit generated.Deliver and pitch your topic in the best possible manner with this Introducing A New Product To The Market Business Performance KPI Dashboard Brochure PDF Use them to share invaluable insights on Business Performance KPI Dashboard and impress your audience. This template can be altered and modified as per your expectations. So, grab it now.
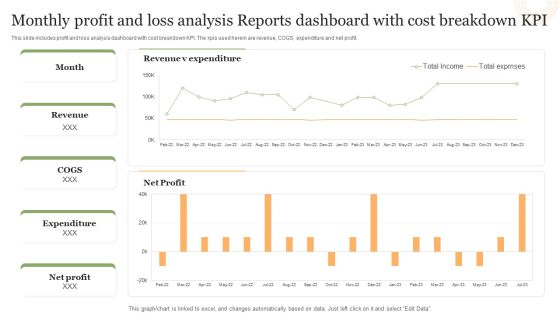
Monthly Profit And Loss Analysis Reports Dashboard With Cost Breakdown Kpi Structure PDF
This slide includes profit and loss analysis dashboard with cost breakdown KPI. The kpis used herein are revenue, COGS, expenditure and net profit.Pitch your topic with ease and precision using this Monthly Profit And Loss Analysis Reports Dashboard With Cost Breakdown Kpi Structure PDF. This layout presents information on Revenue Expenditure, Net Profit, Total Exprnses. It is also available for immediate download and adjustment. So, changes can be made in the color, design, graphics or any other component to create a unique layout.
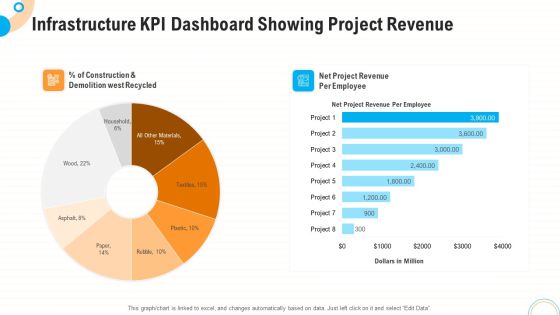
Fiscal And Operational Assessment Infrastructure KPI Dashboard Showing Project Revenue Designs PDF
Deliver an awe inspiring pitch with this creative fiscal and operational assessment infrastructure kpi dashboard showing project revenue designs pdf bundle. Topics like demolition west recycled, net project revenue per employee can be discussed with this completely editable template. It is available for immediate download depending on the needs and requirements of the user.
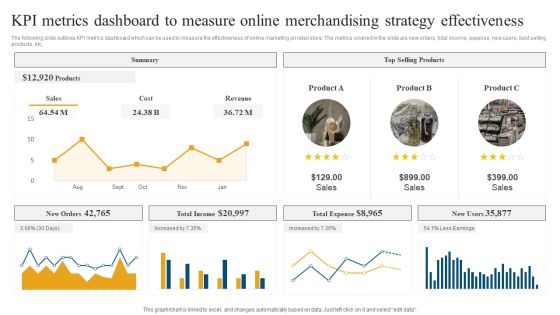
Retail Ecommerce Merchandising Tactics For Boosting Revenue KPI Metrics Dashboard To Measure Online Background PDF
The following slide outlines KPI metrics dashboard which can be used to measure the effectiveness of online marketing on retail store. The metrics covered in the slide are new orders, total income, expense, new users, best selling products, etc. Make sure to capture your audiences attention in your business displays with our gratis customizable Retail Ecommerce Merchandising Tactics For Boosting Revenue KPI Metrics Dashboard To Measure Online Background PDF. These are great for business strategies, office conferences, capital raising or task suggestions. If you desire to acquire more customers for your tech business and ensure they stay satisfied, create your own sales presentation with these plain slides.

Retail Ecommerce Merchandising Tactics For Boosting Revenue KPI Dashboard To Analyze In Store Merchandising Rules PDF
The following slide outlines a performance key performance indicator KPI dashboard used to evaluate the effectiveness of in-store merchandising strategy. The KPIs covered in the slide are total sales, average inventory, active stores, distinct products sold, etc. Crafting an eye catching presentation has never been more straightforward. Let your presentation shine with this tasteful yet straightforward Retail Ecommerce Merchandising Tactics For Boosting Revenue KPI Dashboard To Analyze In Store Merchandising Rules PDF template. It offers a minimalistic and classy look that is great for making a statement. The colors have been employed intelligently to add a bit of playfulness while still remaining professional. Construct the ideal Retail Ecommerce Merchandising Tactics For Boosting Revenue KPI Dashboard To Analyze In Store Merchandising Rules PDF that effortlessly grabs the attention of your audience. Begin now and be certain to wow your customers.
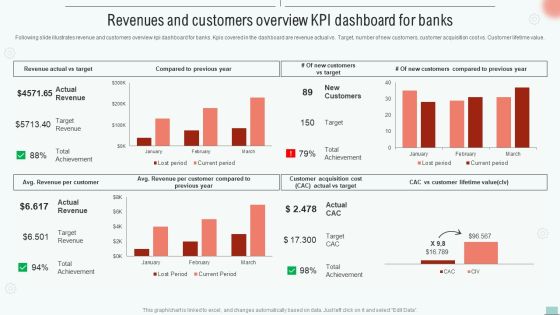
Implementing BPM Tool To Enhance Operational Efficiency Revenues And Customers Overview Kpi Dashboard Rules PDF
Following slide illustrates revenue and customers overview kpi dashboard for banks. Kpis covered in the dashboard are revenue actual vs. Target, number of new customers, customer acquisition cost vs. Customer lifetime value.This Implementing BPM Tool To Enhance Operational Efficiency Revenues And Customers Overview Kpi Dashboard Rules PDF is perfect for any presentation, be it in front of clients or colleagues. It is a versatile and stylish solution for organizing your meetings. The Implementing BPM Tool To Enhance Operational Efficiency Revenues And Customers Overview Kpi Dashboard Rules PDF features a modern design for your presentation meetings. The adjustable and customizable slides provide unlimited possibilities for acing up your presentation. Slidegeeks has done all the homework before launching the product for you. So, do not wait, grab the presentation templates today.

Developing Retail Marketing Strategies To Increase Revenue KPI Metrics Dashboard To Measure Online Portrait PDF
The following slide outlines KPI metrics dashboard which can be used to measure the effectiveness of online marketing on retail store. The metrics covered in the slide are new orders, total income, expense, new users, best selling products, etc.Deliver and pitch your topic in the best possible manner with this Developing Retail Marketing Strategies To Increase Revenue KPI Metrics Dashboard To Measure Online Portrait PDF Use them to share invaluable insights on Total Income, Total Expense, Summary and impress your audience. This template can be altered and modified as per your expectations. So, grab it now.
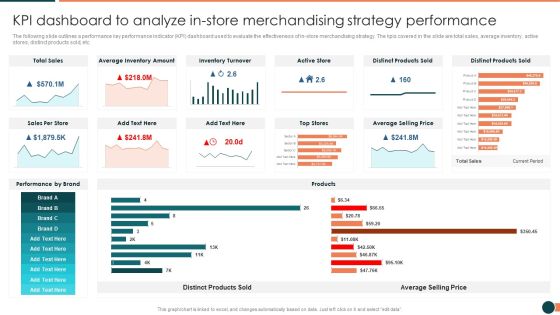
Developing Retail Marketing Strategies To Increase Revenue KPI Dashboard To Analyze Instore Information PDF
The following slide outlines a performance key performance indicator KPI dashboard used to evaluate the effectiveness of in store merchandising strategy. The kpis covered in the slide are total sales, average inventory, active stores, distinct products sold, etc.Deliver an awe inspiring pitch with this creative Developing Retail Marketing Strategies To Increase Revenue KPI Dashboard To Analyze Instore Information PDF bundle. Topics like Inventory Turnover, Distinct Products, Average Inventory can be discussed with this completely editable template. It is available for immediate download depending on the needs and requirements of the user.

KPI Metrics Dashboard To Measure Success Of Customer Churn Prevention Strategies Diagrams PDF
Mentioned slide outlines a key performance indicator KPI dashboard which will assist managers to showcase the result of customer attrition prevention strategies. The KPIs are risky customers, retention rate, monthly recurring revenue MRR, churn risk by location and income, etc. This KPI Metrics Dashboard To Measure Success Of Customer Churn Prevention Strategies Diagrams PDF is perfect for any presentation, be it in front of clients or colleagues. It is a versatile and stylish solution for organizing your meetings. The KPI Metrics Dashboard To Measure Success Of Customer Churn Prevention Strategies Diagrams PDF features a modern design for your presentation meetings. The adjustable and customizable slides provide unlimited possibilities for acing up your presentation. Slidegeeks has done all the homework before launching the product for you. So, do not wait, grab the presentation templates today

KPI Metrics Dashboard To Analyze The Effectiveness Of New Introducing New Food Pictures PDF
The following slide outlines key performance indicator KPI dashboard which can be used to measure the success of product launch. The KPIs are total units, revenue, average selling price ASP, number of penetrated planned customers etc. Make sure to capture your audiences attention in your business displays with our gratis customizable KPI Metrics Dashboard To Analyze The Effectiveness Of New Introducing New Food Pictures PDF. These are great for business strategies, office conferences, capital raising or task suggestions. If you desire to acquire more customers for your tech business and ensure they stay satisfied, create your own sales presentation with these plain slides.
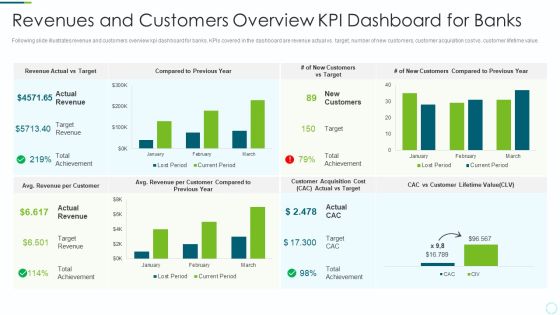
Implementing BPM Techniques Revenues And Customers Overview KPI Dashboard For Banks Microsoft PDF
Following slide illustrates revenue and customers overview kpi dashboard for banks. KPIs covered in the dashboard are revenue actual vs. target, number of new customers, customer acquisition cost vs. customer lifetime value. Deliver an awe inspiring pitch with this creative Implementing BPM Techniques Revenues And Customers Overview KPI Dashboard For Banks Microsoft PDF bundle. Topics like Target Revenue, Customers Compared, Customer Lifetime can be discussed with this completely editable template. It is available for immediate download depending on the needs and requirements of the user.

Successful Staff Retention Techniques KPI Metrics Dashboard Highlighting Employee Retention Rate Pictures PDF
The purpose of this slide is to exhibit a key performance indicator KPI dashboard through which managers can analyze the monthly employee retention rate. The metrics covered in the slide are active employees, new candidates hired, internal, exit, employee turnover rate, etc. Make sure to capture your audiences attention in your business displays with our gratis customizable Successful Staff Retention Techniques KPI Metrics Dashboard Highlighting Employee Retention Rate Pictures PDF. These are great for business strategies, office conferences, capital raising or task suggestions. If you desire to acquire more customers for your tech business and ensure they stay satisfied, create your own sales presentation with these plain slides.
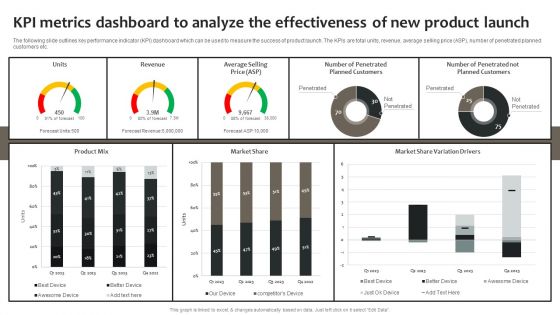
Effective Online And Offline Promotional Kpi Metrics Dashboard To Analyze The Effectiveness Of New Portrait PDF
The following slide outlines key performance indicator KPI dashboard which can be used to measure the success of product launch. The KPIs are total units, revenue, average selling price ASP, number of penetrated planned customers etc. From laying roadmaps to briefing everything in detail, our templates are perfect for you. You can set the stage with your presentation slides. All you have to do is download these easy-to-edit and customizable templates. Effective Online And Offline Promotional Kpi Metrics Dashboard To Analyze The Effectiveness Of New Portrait PDF will help you deliver an outstanding performance that everyone would remember and praise you for. Do download this presentation today.

Assessing Impact Of Sales Risk Management With KPI Dashboard Ideas PDF
The following slide highlights some key performance indicators KPIs to measure the influence of executing sales risk management strategies on revenue performance. It includes elements such as target attainment rate, gross profit, annual growth rate etc. Presenting this PowerPoint presentation, titled Assessing Impact Of Sales Risk Management With KPI Dashboard Ideas PDF, with topics curated by our researchers after extensive research. This editable presentation is available for immediate download and provides attractive features when used. Download now and captivate your audience. Presenting this Assessing Impact Of Sales Risk Management With KPI Dashboard Ideas PDF. Our researchers have carefully researched and created these slides with all aspects taken into consideration. This is a completely customizable Assessing Impact Of Sales Risk Management With KPI Dashboard Ideas PDF that is available for immediate downloading. Download now and make an impact on your audience. Highlight the attractive features available with our PPTs.

Assessing Impact Of Sales Risk Management With Kpi Dashboard Formats PDF
The following slide highlights some key performance indicators KPIs to measure the influence of executing sales risk management strategies on revenue performance. It includes elements such as target attainment rate, gross profit, annual growth rate etc. Presenting this PowerPoint presentation, titled Assessing Impact Of Sales Risk Management With Kpi Dashboard Formats PDF, with topics curated by our researchers after extensive research. This editable presentation is available for immediate download and provides attractive features when used. Download now and captivate your audience. Presenting this Assessing Impact Of Sales Risk Management With Kpi Dashboard Formats PDF. Our researchers have carefully researched and created these slides with all aspects taken into consideration. This is a completely customizable Assessing Impact Of Sales Risk Management With Kpi Dashboard Formats PDF that is available for immediate downloading. Download now and make an impact on your audience. Highlight the attractive features available with our PPTs.

Assessing Impact Of Sales Risk Management With KPI Dashboard Guidelines PDF
The following slide highlights some key performance indicators KPIs to measure the influence of executing sales risk management strategies on revenue performance. It includes elements such as target attainment rate, gross profit, annual growth rate etc. Presenting this PowerPoint presentation, titled Assessing Impact Of Sales Risk Management With KPI Dashboard Guidelines PDF, with topics curated by our researchers after extensive research. This editable presentation is available for immediate download and provides attractive features when used. Download now and captivate your audience. Presenting this Assessing Impact Of Sales Risk Management With KPI Dashboard Guidelines PDF. Our researchers have carefully researched and created these slides with all aspects taken into consideration. This is a completely customizable Assessing Impact Of Sales Risk Management With KPI Dashboard Guidelines PDF that is available for immediate downloading. Download now and make an impact on your audience. Highlight the attractive features available with our PPTs.
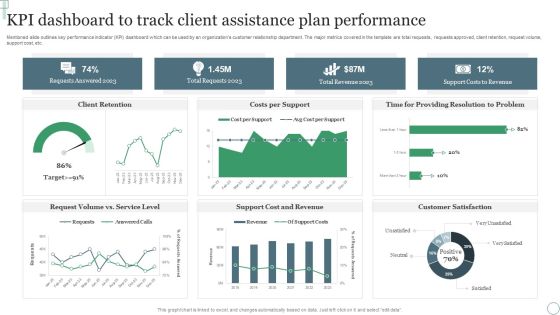
KPI Dashboard To Track Client Assistance Plan Performance Ppt Professional Outfit PDF
Mentioned slide outlines key performance indicator KPI dashboard which can be used by an organizations customer relationship department. The major metrics covered in the template are total requests, requests approved, client retention, request volume, support cost, etc. Pitch your topic with ease and precision using this KPI Dashboard To Track Client Assistance Plan Performance Ppt Professional Outfit PDF. This layout presents information on Requests Answered 2023, Total Requests 2023, Total Revenue 2023. It is also available for immediate download and adjustment. So, changes can be made in the color, design, graphics or any other component to create a unique layout.
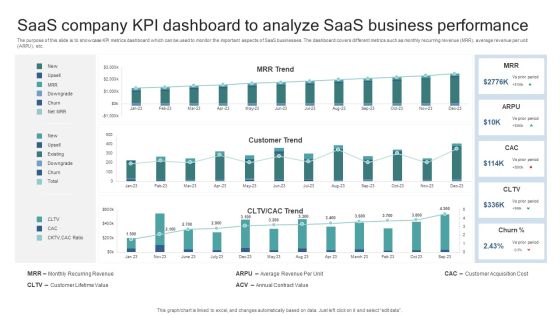
Saas Company KPI Dashboard To Analyze Saas Business Performance Elements PDF
The purpose of this slide is to showcase KPI metrics dashboard which can be used to monitor the important aspects of SaaS businesses. The dashboard covers different metrics such as monthly recurring revenue MRR, average revenue per unit ARPU, etc. Pitch your topic with ease and precision using this Saas Company KPI Dashboard To Analyze Saas Business Performance Elements PDF. This layout presents information on Monthly Recurring Revenue, Customer Lifetime Value, Average Revenue Per Unit, Annual Contract Value, Customer Acquisition Cost. It is also available for immediate download and adjustment. So, changes can be made in the color, design, graphics or any other component to create a unique layout.

Comprehensive Sports Event Marketing Plan Sports Event Marketing KPI Dashboard Introduction PDF
This slide represents KPI dashboard to measure and monitor the performance of sports event marketing. It includes details related to KPIs such as revenue, attendance etc. in last 5 games. Do you have to make sure that everyone on your team knows about any specific topic I yes, then you should give Comprehensive Sports Event Marketing Plan Sports Event Marketing KPI Dashboard Introduction PDF a try. Our experts have put a lot of knowledge and effort into creating this impeccable Comprehensive Sports Event Marketing Plan Sports Event Marketing KPI Dashboard Introduction PDF. You can use this template for your upcoming presentations, as the slides are perfect to represent even the tiniest detail. You can download these templates from the Slidegeeks website and these are easy to edit. So grab these today

KPI Metrics Dashboard To Measure Automation Performance In Customer Support Professional PDF
The following slide outlines a comprehensive KPI dashboard which can be used by the organization to measure the automation performance in customer support department. It covers kpis such as customer retention, costs per support, customer satisfaction, etc. Deliver and pitch your topic in the best possible manner with this KPI Metrics Dashboard To Measure Automation Performance In Customer Support Professional PDF. Use them to share invaluable insights on Customer Retention, Cost Per Support, Support Costs To Revenue and impress your audience. This template can be altered and modified as per your expectations. So, grab it now.
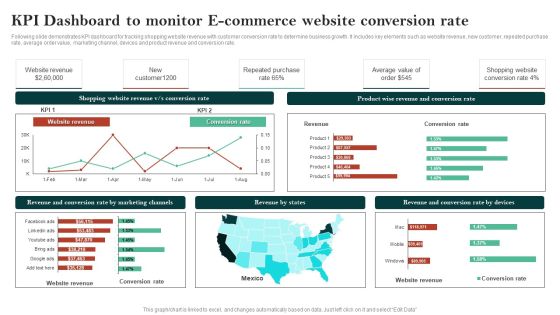
Kpi Dashboard To Monitor E Commerce Website Conversion Rate Clipart PDF
Following slide demonstrates KPI dashboard for tracking shopping website revenue with customer conversion rate to determine business growth. It includes key elements such as website revenue, new customer, repeated purchase rate, average order value, marketing channel, devices and product revenue and conversion rate. Showcasing this set of slides titled Kpi Dashboard To Monitor E Commerce Website Conversion Rate Clipart PDF. The topics addressed in these templates are Shopping Website Revenue, Conversion Rate, Website Revenue. All the content presented in this PPT design is completely editable. Download it and make adjustments in color, background, font etc. as per your unique business setting.

Kpi Dashboard To Track Progress Of Tactics To Launch New Product Infographics PDF
Mentioned slide showcases KPI dashboard to monitor impact of product launch strategy on increasing business market share. It includes elements such as revenue, new customers, lead generation rate, customer satisfaction rate, revenue by customers, revenue and lead generation by marketing platform. Showcasing this set of slides titled Kpi Dashboard To Track Progress Of Tactics To Launch New Product Infographics PDF. The topics addressed in these templates are Quarterly Sales Comparison, Revenue Marketing, Revenue Customers. All the content presented in this PPT design is completely editable. Download it and make adjustments in color, background, font etc. as per your unique business setting.
 Home
Home