Financial Kpi

Successful Mobile Strategies For Business App Metrics Dashboard Microsoft PDF
Presenting successful mobile strategies for business app metrics dashboard microsoft pdf to provide visual cues and insights. Share and navigate important information on six stages that need your due attention. This template can be used to pitch topics like app metrics dashboard. In addtion, this PPT design contains high resolution images, graphics, etc, that are easily editable and available for immediate download.
Key Business Metrics Dashboard Ppt Powerpoint Presentation Icon Graphics Design
This is a key business metrics dashboard ppt powerpoint presentation icon graphics design. This is a five stage process. The stages in this process are finance, marketing, management, investment, analysis.

Search Engine Optimization Metrics Diagram Ppt Presentation
This is a search engine optimization metrics diagram ppt presentation. This is a two stage process. The stages in this process are understanding seo metrics, people visitor this site, visitor, unique visitors, page views, pages visit, avg visit duration, renewing visitor, new visitor.
Sales Target Metrics Achievement Icon Download PDF
Persuade your audience using this Sales Target Metrics Achievement Icon Download PDF. This PPT design covers four stages, thus making it a great tool to use. It also caters to a variety of topics including Sales Target Metrics, Achievement Icon. Download this PPT design now to present a convincing pitch that not only emphasizes the topic but also showcases your presentation skills.
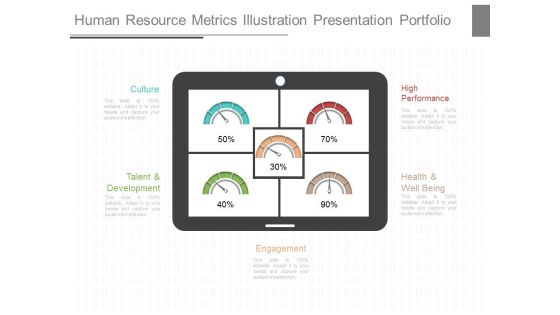
Human Resource Metrics Illustration Presentation Portfolio
This is a human resource metrics illustration presentation portfolio. This is a five stage process. The stages in this process are culture, high performance, talent and development, health and well being, engagement.

Kpis And Operations Metrics Presentation Powerpoint Example
This is a kpis and operations metrics presentation powerpoint example. This is a five stage process. The stages in this process are customer class, affiliate, sales by warehouse, warehouse, profit by affiliate.
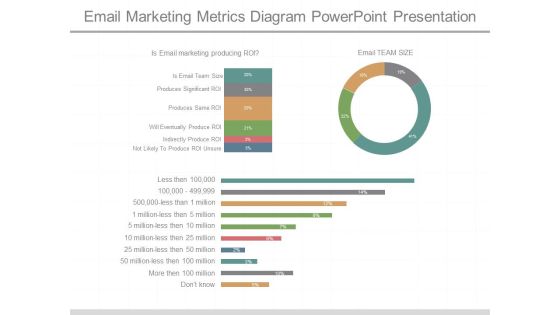
Email Marketing Metrics Diagram Powerpoint Presentation
This is a email marketing metrics diagram powerpoint presentation. This is a three stage process. The stages in this process are is email marketing producing roi, is email team size, produces significant roi, produces same roi, will eventually produce roi, indirectly produce roi, not likely to produce roi unsure, email team size.

In Depth Business Assessment Business Management KPIS Metrics Customers Ppt PowerPoint Presentation Gallery Infographics PDF
This is a in depth business assessment business management kpis metrics customers ppt powerpoint presentation gallery infographics pdf template with various stages. Focus and dispense information on five stages using this creative set, that comes with editable features. It contains large content boxes to add your information on topics like active customers, sold units, total revenues, net profit, profit margin. You can also showcase facts, figures, and other relevant content using this PPT layout. Grab it now.

Business Operations Assessment Business Management Kpis Metrics Ppt Infographic Template Deck PDF
This is a business operations assessment business management kpis metrics ppt infographic template deck pdf template with various stages. Focus and dispense information on six stages using this creative set, that comes with editable features. It contains large content boxes to add your information on topics like budgeted income, received income, accounts receivable, budgeted expenses, paid expenses, accounts payable. You can also showcase facts, figures, and other relevant content using this PPT layout. Grab it now.
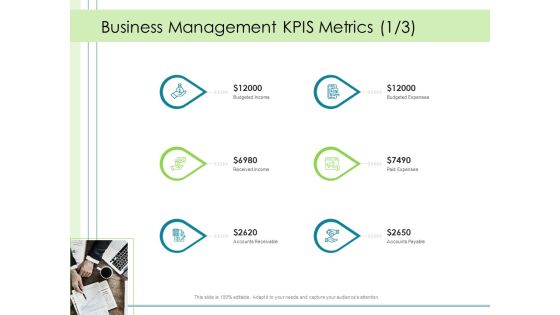
In Depth Business Assessment Business Management Kpis Metrics Ppt PowerPoint Presentation Show Demonstration PDF
This is a in depth business assessment business management kpis metrics ppt powerpoint presentation show demonstration pdf template with various stages. Focus and dispense information on six stages using this creative set, that comes with editable features. It contains large content boxes to add your information on topics like budgeted income, received income, accounts receivable, budgeted expenses, paid expenses, accounts payable. You can also showcase facts, figures, and other relevant content using this PPT layout. Grab it now.

Business Management Kpis Metrics Accounts Business Analysis Method Ppt Portfolio Information PDF
This is a business management kpis metrics accounts business analysis method ppt portfolio information pdf template with various stages. Focus and dispense information on six stages using this creative set, that comes with editable features. It contains large content boxes to add your information on topics like budgeted income, received income, accounts receivable, budgeted expenses, paid expenses. You can also showcase facts, figures, and other relevant content using this PPT layout. Grab it now.
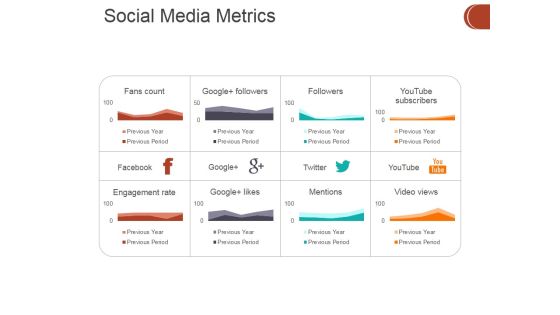
Social Media Metrics Ppt PowerPoint Presentation Portfolio Tips
This is a social media metrics ppt powerpoint presentation portfolio tips. This is a eight stage process. The stages in this process are business, finance, growth, strategy, analysis, investment.
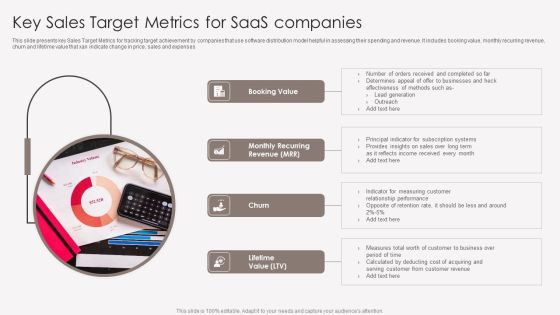
Key Sales Target Metrics For Saas Companies Portrait PDF
This slide presents key Sales Target Metrics for tracking target achievement by companies that use software distribution model helpful in assessing their spending and revenue. It includes booking value, monthly recurring revenue, churn and lifetime value that xan indicate change in price, sales and expenses. Persuade your audience using this Key Sales Target Metrics For Saas Companies Portrait PDF. This PPT design covers four stages, thus making it a great tool to use. It also caters to a variety of topics including Booking Value, Churn, Lifetime Value. Download this PPT design now to present a convincing pitch that not only emphasizes the topic but also showcases your presentation skills.
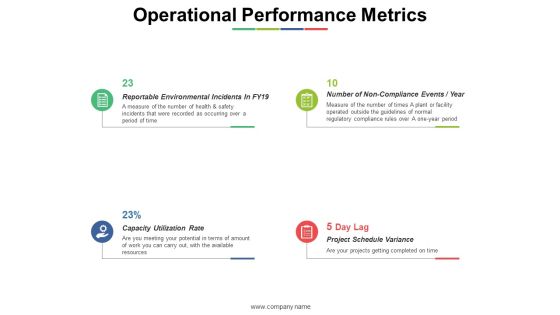
Operational Performance Metrics Ppt PowerPoint Presentation Styles Inspiration
This is a operational performance metrics ppt powerpoint presentation styles inspiration. This is a four stage process. The stages in this process are capacity utilization rate, project schedule variance, operational performance metrics.

Social Media Metrics Ppt PowerPoint Presentation Ideas Model
This is a social media metrics ppt powerpoint presentation ideas model. This is a four stage process. The stages in this process are facebook, twitter, youtube, instagram.
Digital Sales Enhancement Metrics With Strategies Elements PDF
The following slide highlights five metrics which are important to track to increase online sales. The metrics included in slide are sales conversion rate, customer acquisition cost, average order value, customer lifetime value, and email opt-in rate and also methods to improve these metrics. Presenting Digital Sales Enhancement Metrics With Strategies Elements PDF to dispense important information. This template comprises five stages. It also presents valuable insights into the topics including Sales Conversion Rate, Customer Acquisition Cost, Average Order Value. This is a completely customizable PowerPoint theme that can be put to use immediately. So, download it and address the topic impactfully.

Metrics Performance Benchmark Ppt PowerPoint Presentation Outline Graphics Template Cpb
Presenting this set of slides with name metrics performance benchmark ppt powerpoint presentation outline graphics template cpb. This is a three stage process. The stages in this process are metrics performance benchmark. This is a completely editable PowerPoint presentation and is available for immediate download. Download now and impress your audience.

Metrics Icon For Customer Service Improvement Portrait PDF
Persuade your audience using this Metrics Icon For Customer Service Improvement Portrait PDF. This PPT design covers four stages, thus making it a great tool to use. It also caters to a variety of topics including Metrics Icon, Customer Service Improvement. Download this PPT design now to present a convincing pitch that not only emphasizes the topic but also showcases your presentation skills.
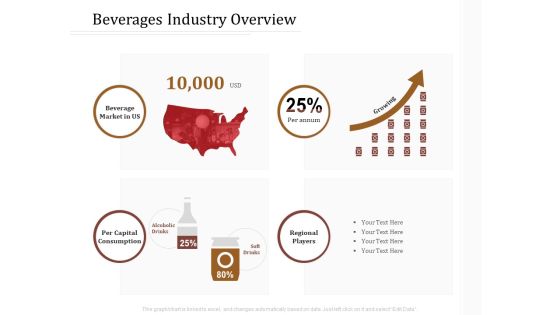
Key Metrics Hotel Administration Management Beverages Industry Overview Brochure PDF
Presenting this set of slides with name key metrics hotel administration management beverages industry overview brochure pdf. This is a four stage process. The stages in this process are beverage market, per capital consumption, regional players, per annum. This is a completely editable PowerPoint presentation and is available for immediate download. Download now and impress your audience.

Consumer Metrics To Track Monzos Performance Formats PDF
This slide provides information about the consumer metrics with respect to the usage of Monzo Platform such as rating on app store, monthly average spend per card per month, amount spend on cards issued etc. This is a consumer metrics to track monzos performance formats pdf template with various stages. Focus and dispense information on five stages using this creative set, that comes with editable features. It contains large content boxes to add your information on topics like consumer metrics to track monzos performance. You can also showcase facts, figures, and other relevant content using this PPT layout. Grab it now.
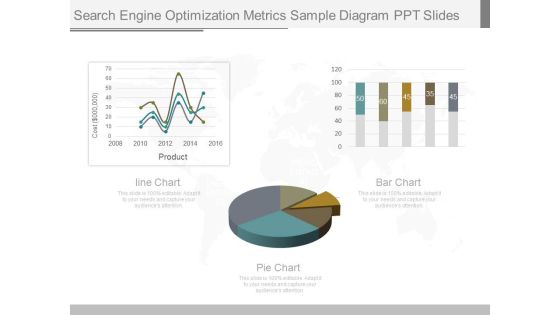
Search Engine Optimization Metrics Sample Diagram Ppt Slides
This is a search engine optimization metrics sample diagram ppt slides. This is a three stage process. The stages in this process are cost, product, line chart, bar chart, pie chart.
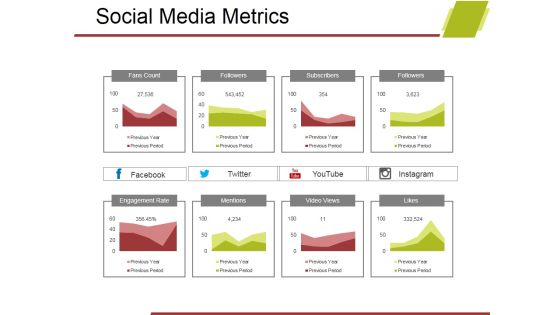
Social Media Metrics Ppt PowerPoint Presentation Styles Topics
This is a social media metrics ppt powerpoint presentation styles topics. This is a eight stage process. The stages in this process are fans count, followers, subscribers, engagement rate, mentions, video views, likes.
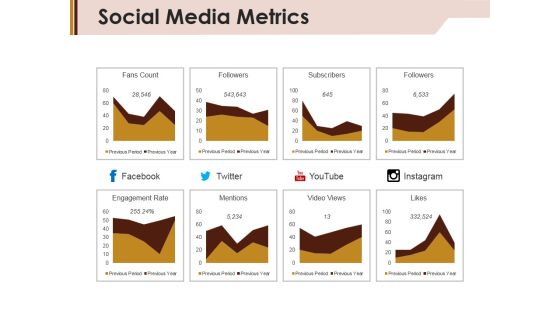
Social Media Metrics Ppt PowerPoint Presentation Ideas Graphics Example
This is a social media metrics ppt powerpoint presentation ideas graphics example. This is a eight stage process. The stages in this process are fans count, followers, subscribers, engagement rate.

Banking Performance Metrics Ppt PowerPoint Presentation Professional Good Cpb Pdf
Presenting this set of slides with name banking performance metrics ppt powerpoint presentation professional good cpb pdf. This is an editable Powerpoint six stages graphic that deals with topics like banking performance metrics to help convey your message better graphically. This product is a premium product available for immediate download and is 100 percent editable in Powerpoint. Download this now and use it in your presentations to impress your audience.

Major Metrics To Manage Cash Flow Ppt Infographics Portfolio PDF
This slide showcases main performance metric for cashflow management and improvement. The KPIs covered are account receivable turnover, sustainable growth rate, cash conversion cycle and quick ratio. Presenting Major Metrics To Manage Cash Flow Ppt Infographics Portfolio PDF to dispense important information. This template comprises four stages. It also presents valuable insights into the topics including Account Receivable Turnover, Sustainable Growth Rate, Cash Conversion Cycle. This is a completely customizable PowerPoint theme that can be put to use immediately. So, download it and address the topic impactfully.

Administrative Regulation Business Management KPIs Metrics Profit Ppt PowerPoint Presentation Portfolio Brochure PDF
This is a administrative regulation business management kpis metrics profit ppt powerpoint presentation portfolio brochure pdf template with various stages. Focus and dispense information on five stages using this creative set, that comes with editable features. It contains large content boxes to add your information on topics like active customers, sold units, total revenues, net profit, profit margin. You can also showcase facts, figures, and other relevant content using this PPT layout. Grab it now.

Administrative Regulation Business Management KPIs Metrics Ppt PowerPoint Presentation Slides Shapes PDF
This is a administrative regulation business management kpis metrics ppt powerpoint presentation slides shapes pdf template with various stages. Focus and dispense information on six stages using this creative set, that comes with editable features. It contains large content boxes to add your information on topics like budgeted income, received income, accounts receivable, budgeted expenses, paid expenses, accounts payable. You can also showcase facts, figures, and other relevant content using this PPT layout. Grab it now.

Sales And Business Development Action Plan Marketing Future Action Metrics Ppt Infographics Designs Download PDF
Presenting this set of slides with name sales and business development action plan marketing future action metrics ppt infographics designs download pdf. This is a one stage process. The stages in this process are metrics, current, goal, timeline, brand awareness, conversion rate optimization. This is a completely editable PowerPoint presentation and is available for immediate download. Download now and impress your audience.

CSR Activities Company Reputation Management CSR Framework With Initiatives Aligned With Sdgs Ppt Layouts Inspiration PDF
This slide covers details about CSR framework that comprises of CSR initiatives that firm is planning to perform in next financial period and it depicts the alignment of each initiative with sustainable development goals SDGs. Deliver and pitch your topic in the best possible manner with this csr activities company reputation management csr framework with initiatives aligned with sdgs ppt layouts inspiration pdf. Use them to share invaluable insights on initiative, kpi, scope, sdg alignment, risk management and impress your audience. This template can be altered and modified as per your expectations. So, grab it now.

Various Kpis Included In Performance Sales Report Graphics PDF
The slide covers the key performance indicators of a report to measure product sales. Various KPIs included are conversion rate, referrals and customer lifetime value. Persuade your audience using this Various Kpis Included In Performance Sales Report Graphics PDF. This PPT design covers three stages, thus making it a great tool to use. It also caters to a variety of topics including Conversion Rate, Referrals, Customer Lifetime Value. Download this PPT design now to present a convincing pitch that not only emphasizes the topic but also showcases your presentation skills.

Search Engine Marketing Estimated Campaign Performance Result Summary Designs PDF
The following slide depicts the forecasted campaign outcomes to assess potential earnings and spending. It includes key performance indicators such as monthly budget, cost per click, website traffic, conversion rate, average conversion value etc. Do you know about Slidesgeeks Search Engine Marketing Estimated Campaign Performance Result Summary Designs PDF These are perfect for delivering any kind od presentation. Using it, create PowerPoint presentations that communicate your ideas and engage audiences. Save time and effort by using our pre-designed presentation templates that are perfect for a wide range of topic. Our vast selection of designs covers a range of styles, from creative to business, and are all highly customizable and easy to edit. Download as a PowerPoint template or use them as Google Slides themes.

Capital Markets Dashboard Ppt Powerpoint Slide Background
This is a capital markets dashboard ppt powerpoint slide background. This is a three stage process. The stages in this process are weekly sales, product inventory, key performance indicators.

Identifying Key Metrics To Measure Success Of Our Marketing Efforts Download PDF
Purpose of the following slide is to identify the key metrics that the organization can use to track performance of their marketing efforts, these metrics are cost of acquisition, click through rate etc. Presenting Identifying Key Metrics To Measure Success Of Our Marketing Efforts Download PDF to provide visual cues and insights. Share and navigate important information on one stages that need your due attention. This template can be used to pitch topics like Social Media, Cost Per Acquisition, Key Marketing Metrics. In addtion, this PPT design contains high resolution images, graphics, etc, that are easily editable and available for immediate download.

Operational Performance Metrics Quality Index Ppt PowerPoint Presentation Summary Layout Ideas
This is a operational performance metrics quality index ppt powerpoint presentation summary layout ideas. This is a four stage process. The stages in this process are earned value metrics, order fulfilment cycle time, quality index, delivery in full on time rate.
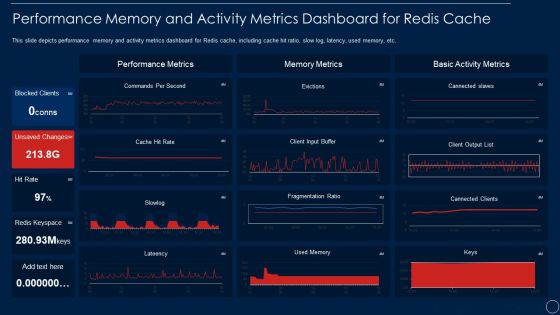
Redis Cache Data Structure IT Performance Memory And Activity Metrics Introduction PDF
This slide depicts performance memory and activity metrics dashboard for Redis cache, including cache hit ratio, slow log, latency, used memory, etc. This is a redis cache data structure it performance memory and activity metrics introduction pdf template with various stages. Focus and dispense information on one stages using this creative set, that comes with editable features. It contains large content boxes to add your information on topics like performance memory and activity metrics dashboard for redis cache. You can also showcase facts, figures, and other relevant content using this PPT layout. Grab it now.
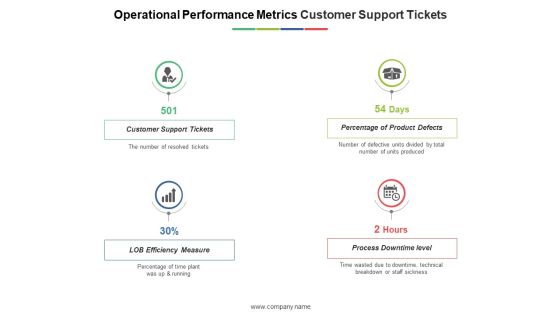
Operational Performance Metrics Customer Support Tickets Ppt PowerPoint Presentation Outline Graphics Design
This is a operational performance metrics customer support tickets ppt powerpoint presentation outline graphics design. This is a four stage process. The stages in this process are customer support tickets, percentage of product defects, lob efficiency measure, process downtime level.
Social Media And Word Of Mouth Metrics Ppt PowerPoint Presentation Model Icon
This is a social media and word of mouth metrics ppt powerpoint presentation model icon. This is a two stage process. The stages in this process are finance, management, strategy, analysis, marketing.

Social Media And Word Of Mouth Metrics Ppt Powerpoint Presentation Show Example Introduction
This is a social media and word of mouth metrics ppt powerpoint presentation show example introduction. This is a two stage process. The stages in this process are finance, marketing, management, investment, analysis.
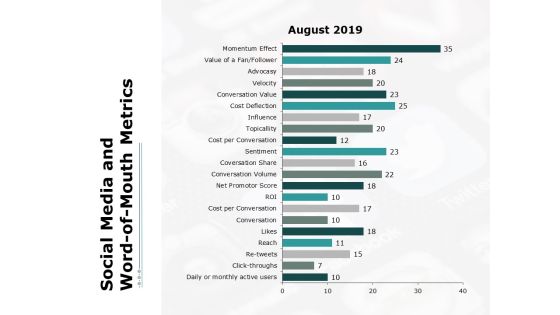
Social Media And Word Of Mouth Metrics Ppt PowerPoint Presentation Layouts Graphics
This is a social media and word of mouth metrics ppt powerpoint presentation layouts graphics. This is a three stage process. The stages in this process are finance, marketing, management, investment, analysis.

Metrics To Improve Cash Flow Tracking Icon Ppt Inspiration Outfit PDF
Persuade your audience using this Metrics To Improve Cash Flow Tracking Icon Ppt Inspiration Outfit PDF. This PPT design covers three stages, thus making it a great tool to use. It also caters to a variety of topics including Metrics To Improve, Cash Flow, Tracking Icon. Download this PPT design now to present a convincing pitch that not only emphasizes the topic but also showcases your presentation skills.

Cloud Content Delivery Network Key CDN Metrics To Watch Background PDF
This slide represents the key CDN metrics to watch while looking for a CDN provider, such as the time it takes DNS to reply. Explore a selection of the finest Cloud Content Delivery Network Key CDN Metrics To Watch Background PDF here. With a plethora of professionally designed and pre made slide templates, you can quickly and easily find the right one for your upcoming presentation. You can use our Cloud Content Delivery Network Key CDN Metrics To Watch Background PDF to effectively convey your message to a wider audience. Slidegeeks has done a lot of research before preparing these presentation templates. The content can be personalized and the slides are highly editable. Grab templates today from Slidegeeks.
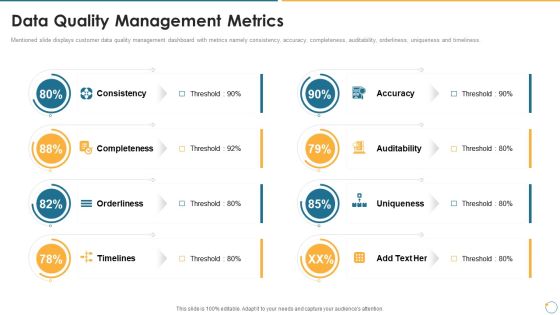
Collection Of Quality Assurance PPT Data Quality Management Metrics Information PDF
Mentioned slide displays customer data quality management dashboard with metrics namely consistency, accuracy, completeness, auditability, orderliness, uniqueness and timeliness. This is a collection of quality assurance ppt data quality management metrics information pdf template with various stages. Focus and dispense information on eight stages using this creative set, that comes with editable features. It contains large content boxes to add your information on topics like accuracy, auditability, consistency, completeness, uniqueness. You can also showcase facts, figures, and other relevant content using this PPT layout. Grab it now.
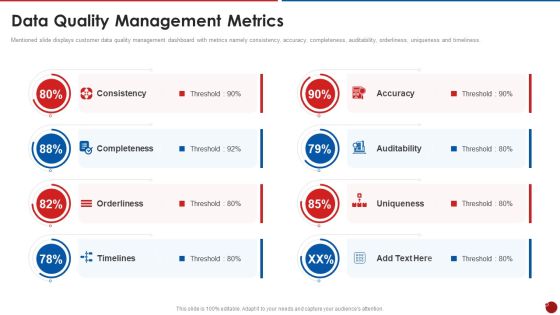
Quality Assurance Templates Set 2 Data Quality Management Metrics Pictures PDF
Mentioned slide displays customer data quality management dashboard with metrics namely consistency, accuracy, completeness, auditability, orderliness, uniqueness and timeliness. Presenting quality assurance templates set 2 data quality management metrics pictures pdf to provide visual cues and insights. Share and navigate important information on eight stages that need your due attention. This template can be used to pitch topics like consistency, completeness, orderliness, timelines, accuracy. In addtion, this PPT design contains high resolution images, graphics, etc, that are easily editable and available for immediate download.

QA Plan Set 2 Data Quality Management Metrics Ppt PowerPoint Presentation Gallery Background Image PDF
Mentioned slide displays customer data quality management dashboard with metrics namely consistency, accuracy, completeness, auditability, orderliness, uniqueness and timeliness. Presenting QA Plan Set 2 Data Quality Management Metrics Ppt PowerPoint Presentation Gallery Background Image PDF to provide visual cues and insights. Share and navigate important information on eight stages that need your due attention. This template can be used to pitch topics like Accuracy Completeness, Orderliness Timelines. In addtion, this PPT design contains high resolution images, graphics, etc, that are easily editable and available for immediate download.
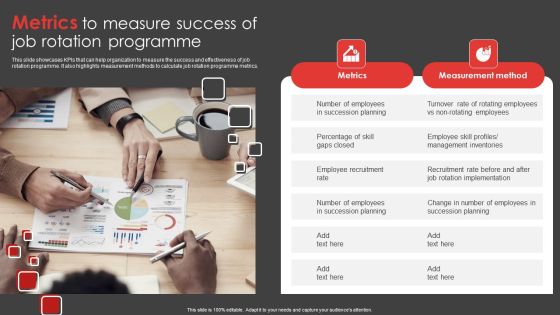
Job Rotation Plan For Staff Metrics To Measure Success Of Job Rotation Programme Diagrams PDF
This slide showcases KPIs that can help organization to measure the success and effectiveness of job rotation programme. It also highlights measurement methods to calculate job rotation programme metrics. Slidegeeks is one of the best resources for PowerPoint templates. You can download easily and regulate Job Rotation Plan For Staff Metrics To Measure Success Of Job Rotation Programme Diagrams PDF for your personal presentations from our wonderful collection. A few clicks is all it takes to discover and get the most relevant and appropriate templates. Use our Templates to add a unique zing and appeal to your presentation and meetings. All the slides are easy to edit and you can use them even for advertisement purposes.

Customer Satisfaction Template 1 Ppt PowerPoint Presentation Portfolio Graphics Example
This is a customer satisfaction template 1 ppt powerpoint presentation portfolio graphics example. This is a three stage process. The stages in this process are overall satisfaction with service, satisfaction with value for money, overall satisfaction with relationship, key performance indicators, business, percentage.
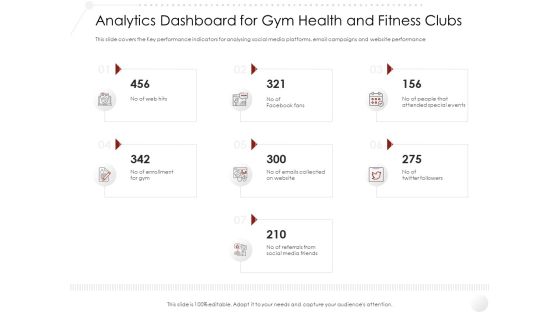
Market Entry Strategy Clubs Industry Analytics Dashboard For Gym Health And Fitness Clubs Summary PDF
This slide covers the Key performance indicators for analysing social media platforms, email campaigns and website performance. Presenting market entry strategy clubs industry analytics dashboard for gym health and fitness clubs summary pdf to provide visual cues and insights. Share and navigate important information on seven stages that need your due attention. This template can be used to pitch topics like Analytics Dashboard for Gym Health and Fitness Clubs. In addtion, this PPT design contains high-resolution images, graphics, etc, that are easily editable and available for immediate download.

Price Architecture Cost Sheet Ratio Cont Ppt PowerPoint Presentation Portfolio Guidelines PDF
These four key performance indicator calculates a gross profit margin. Presenting price architecture cost sheet ratio cont ppt powerpoint presentation portfolio guidelines pdf to provide visual cues and insights. Share and navigate important information on four stages that need your due attention. This template can be used to pitch topics like gross profit margin, direct material cost per unit, direct labor cost per unit, fixed overhead cost per unit, sales volume, sales revenue. In addition, this PPT design contains high-resolution images, graphics, etc, that are easily editable and available for immediate download.
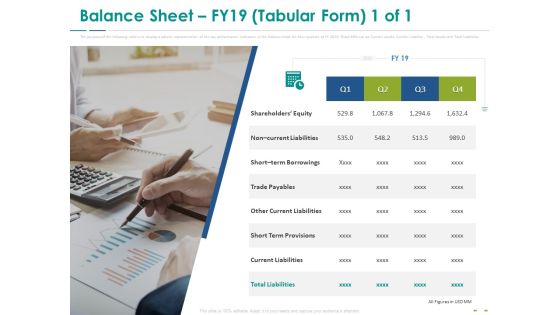
Stock Market Research Report Balance Sheet FY19 Tabular Form Equity Information PDF
The purpose of the following slide is to display the key performance indicators of the balance sheet for four quarters of FY 2019. These KPIs can be Current assets, Current Liability , Total Assets and Total Liabilities. Presenting stock market research report balance sheet fy19 tabular form equity information pdf to provide visual cues and insights. Share and navigate important information on one stages that need your due attention. This template can be used to pitch topics like non current liabilities, short term borrowings, trade payables, other current liabilities, short term provisions. In addition, this PPT design contains high-resolution images, graphics, etc, that are easily editable and available for immediate download.

Factory Costs Components Cost Sheet Ratio Cont Ppt Gallery Images PDF
These four key performance indicator calculates a gross profit margin .This is a factory costs components cost sheet ratio cont ppt gallery images pdf. template with various stages. Focus and dispense information on four stages using this creative set, that comes with editable features. It contains large content boxes to add your information on topics like direct material cost per unit, gross profit margin, direct labor cost per unit, sales volume. You can also showcase facts, figures, and other relevant content using this PPT layout. Grab it now.
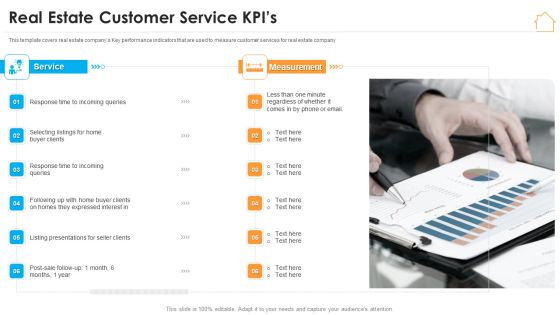
Real Estate Marketing Strategy Vendors Real Estate Customer Service Kpis Topics PDF
This template covers real estate companys Key performance indicators that are used to measure customer services for real estate company. Presenting real estate marketing strategy vendors real estate customer service kpis topics pdf to provide visual cues and insights. Share and navigate important information on six stages that need your due attention. This template can be used to pitch topics like measurement, buyer clients, service. In addtion, this PPT design contains high resolution images, graphics, etc, that are easily editable and available for immediate download.

Six Sigma Continuous Process Kpis To Measure The Growth Of Operational Strategy Rules PDF
Purpose of the following slide is to show the KPIs or key performance indicators for measuring the progress of operational strategy. These KPIs can be customer satisfaction rate, net promoter score, Downtime etc. This is a Six Sigma Continuous Process Kpis To Measure The Growth Of Operational Strategy Rules PDF template with various stages. Focus and dispense information on four stages using this creative set, that comes with editable features. It contains large content boxes to add your information on topics like Customer KPIs, Employee KPIs, Production KPIs. You can also showcase facts, figures, and other relevant content using this PPT layout. Grab it now.

Monthly Social Media Dashboard Ppt PowerPoint Presentation Model Slide
This is a monthly social media dashboard ppt powerpoint presentation model slide. This is a four stage process. The stages in this process are sales, social events, business, finance, key social metrics.

Hr Dashboard Ppt PowerPoint Presentation Shapes
This is a hr dashboard ppt powerpoint presentation shapes. This is a four stage process. The stages in this process are total employees, key metrics, employee churn, open positions by divisions.
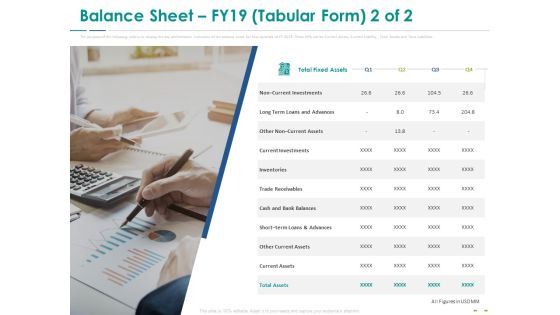
Stock Market Research Report Balance Sheet FY19 Tabular Form Investments Designs PDF
The purpose of the following slide is to display a tabular representation of the key performance indicators of the balance sheet for four quarters of FY 2019. These KPIs can be Current assets, Current Liability , Total Assets and Total Liabilities. This is a stock market research report balance sheet fy19 tabular form investments designs pdf template with various stages. Focus and dispense information on one stages using this creative set, that comes with editable features. It contains large content boxes to add your information on topics like non current investments, long term loans and advances, current investments, inventories, trade receivables. You can also showcase facts, figures, and other relevant content using this PPT layout. Grab it now.

Corporate Business Size Of The Market Ppt PowerPoint Presentation Gallery Icon PDF
This slide provides the glimpse about the size of the market which focuses on TAM, SAM and SOM that showcase the fundamental market size metrics. This is a Corporate Business Size Of The Market Ppt PowerPoint Presentation Gallery Icon PDF template with various stages. Focus and dispense information on three stages using this creative set, that comes with editable features. It contains large content boxes to add your information on topics like Total Available Market, Serviceable Available Market, Serviceable Obtainable Market. You can also showcase facts, figures, and other relevant content using this PPT layout. Grab it now.
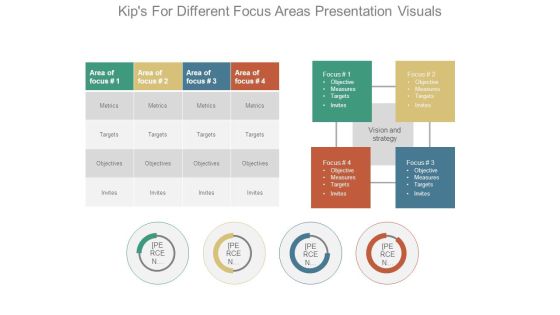
Kips For Different Focus Areas Presentation Visuals
This is a kips for different focus areas presentation visuals. This is a four stage process. The stages in this process are area of focus, metrics, targets, objectives, invites, vision and strategy, focus.
Monthly Social Media Dashboard Ppt PowerPoint Presentation Icon Gallery
This is a monthly social media dashboard ppt powerpoint presentation icon gallery. This is a two stage process. The stages in this process are facebook, social traffic and conversion, referral traffic, conversions, key social metrics, pinterest, you tube.
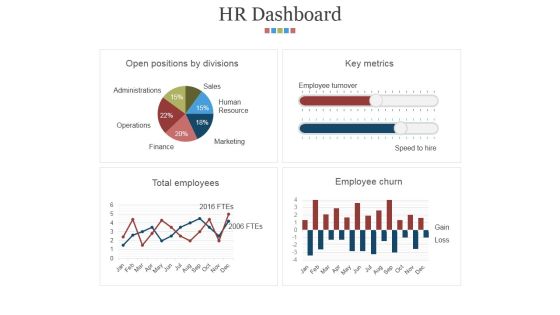
Hr Dashboard Template 2 Ppt PowerPoint Presentation Microsoft
This is a hr dashboard template 2 ppt powerpoint presentation microsoft. This is a four stage process. The stages in this process are open positions by divisions, key metrics, total employees, employee churn.
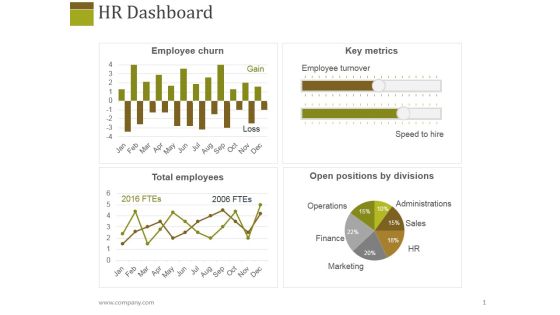
Hr Dashboard Template 1 Ppt PowerPoint Presentation Layouts Slideshow
This is a hr dashboard template 1 ppt powerpoint presentation layouts slideshow. This is a four stage process. The stages in this process are employee churn, key metrics, total employees, open positions by divisions.

Non Profit Marketing And Strategic Essential Fundraising Campaign Action Program Topics PDF
This slide covers strategic plan for promotion of fundraising campaign for non-profits. It includes campaign goals, key metrics, duration, campaign channel, audience, available spend and projected revenue. Presenting Non Profit Marketing And Strategic Essential Fundraising Campaign Action Program Topics PDF to dispense important information. This template comprises seven stages. It also presents valuable insights into the topics including Campaign, Goals, Key Metrics, Audience, Projected Revenue. This is a completely customizable PowerPoint theme that can be put to use immediately. So, download it and address the topic impactfully.
Strategic Primary Tenants Of Income Enablement Background PDF
The following slide highlights primary tenets of revenue enablement aimed at fostering cross functional alignment and increase engagement using effective targeting. It covers customer experience, process driven, collaboration, metrics oriented and adoption focused. Persuade your audience using this Strategic Primary Tenants Of Income Enablement Background PDF. This PPT design covers five stages, thus making it a great tool to use. It also caters to a variety of topics including Process Driven, Collaboration, Metrics Oriented. Download this PPT design now to present a convincing pitch that not only emphasizes the topic but also showcases your presentation skills.

Major Benefits Of Money Flow Liquidity Management Ideas PDF
Persuade your audience using this major benefits of money flow liquidity management ideas pdf. This PPT design covers three stages, thus making it a great tool to use. It also caters to a variety of topics including strategies, management, metrics. Download this PPT design now to present a convincing pitch that not only emphasizes the topic but also showcases your presentation skills.

6 Step Process For Creating Data Driven Organizational Culture Background PDF
Presenting 6 step process for creating data driven organizational culture background pdf to dispense important information. This template comprises six stages. It also presents valuable insights into the topics including metrics, analysis, information. This is a completely customizable PowerPoint theme that can be put to use immediately. So, download it and address the topic impactfully.

Corporate Organization Playbook Purpose Of Corporate Organization Playbook Ppt Ideas PDF
Presenting corporate organization playbook purpose of corporate organization playbook ppt ideas pdf to provide visual cues and insights. Share and navigate important information on five stages that need your due attention. This template can be used to pitch topics like basic structure, organization and define, roles and responsibilities, business metrics and measure. In addtion, this PPT design contains high resolution images, graphics, etc, that are easily editable and available for immediate download.

Debt Retrieval Techniques Utilizing Key Debt Collection Tools Ppt Model Graphics Template PDF
Purpose of the following slid is to show the key tools that the organization can use to manage their debts , these tools are evaluated on the basis of various metrics. These metrics can be price of the product, error rate and the response rate This is a debt retrieval techniques utilizing key debt collection tools ppt model graphics template pdf template with various stages. Focus and dispense information on six stages using this creative set, that comes with editable features. It contains large content boxes to add your information on topics like utilizing key debt collection tools. You can also showcase facts, figures, and other relevant content using this PPT layout. Grab it now.

Debt Collection Improvement Plan Utilizing Key Debt Collection Tools Introduction PDF
Purpose of the following slid is to show the key tools that the organization can use to manage their debts , these tools are evaluated on the basis of various metrics. These metrics can be price of the product, error rate and the response rate. This is a debt collection improvement plan utilizing key debt collection tools introduction pdf template with various stages. Focus and dispense information on six stages using this creative set, that comes with editable features. It contains large content boxes to add your information on topics like price usd, error rate, response rate. You can also showcase facts, figures, and other relevant content using this PPT layout. Grab it now.

Buyer Journey Improvement Initiatives For Customer Service Transformation Topics PDF
Persuade your audience using this buyer journey improvement initiatives for customer service transformation topics pdf. This PPT design covers four stages, thus making it a great tool to use. It also caters to a variety of topics including metrics, sales manager, product manager. Download this PPT design now to present a convincing pitch that not only emphasizes the topic but also showcases your presentation skills.

Steps To Create Five Years Sales Projection Ideas PDF
This slide defines the steps to create five years sales forecast. It includes information related to the factors considered while creating a sales forecast for an organization. Persuade your audience using this Steps To Create Five Years Sales Projection Ideas PDF. This PPT design covers five stages, thus making it a great tool to use. It also caters to a variety of topics including Setting Metrics, Tracking Business Data, Calculating Sales Forecast. Download this PPT design now to present a convincing pitch that not only emphasizes the topic but also showcases your presentation skills.
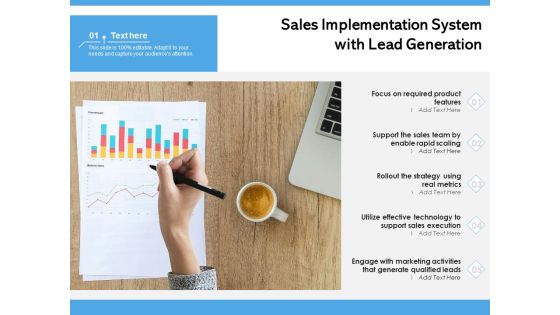
Sales Implementation System With Lead Generation Ppt PowerPoint Presentation Pictures Shapes PDF
Persuade your audience using this sales implementation system with lead generation ppt powerpoint presentation pictures shapes pdf. This PPT design covers five stages, thus making it a great tool to use. It also caters to a variety of topics including focus on required product features, support the sales team by enable rapid scaling, rollout the strategy using real metrics, utilize effective technology to support sales execution, age with marketing activities that generate qualified lead. Download this PPT design now to present a convincing pitch that not only emphasizes the topic but also showcases your presentation skills.

Effective Instagram Marketing Campaign Techniques Designs PDF
The slide represents strategies to create campaign that leads to increased customer engagement. The elements are setting SMART goals, planning campaign content, using reels and stories, tracking metrics etc. Persuade your audience using this Effective Instagram Marketing Campaign Techniques Designs PDF. This PPT design covers Four stages, thus making it a great tool to use. It also caters to a variety of topics including Planning Campaign Content, Using Reels And Stories. Download this PPT design now to present a convincing pitch that not only emphasizes the topic but also showcases your presentation skills.

ROI And Cost Of Tiered Marketing Channels Types Professional PDF
This slide illustrates competitive analysis of different marketing channels. It includes comparison metrics like average ROI, average effort, average cost etc. Persuade your audience using this ROI And Cost Of Tiered Marketing Channels Types Professional PDF. This PPT design covers four stages, thus making it a great tool to use. It also caters to a variety of topics including Marketing Channel, Average ROI, Average Effort. Download this PPT design now to present a convincing pitch that not only emphasizes the topic but also showcases your presentation skills.

Enterprise Pitch Deck Size Of The Market Ppt PowerPoint Presentation Gallery Rules PDF
This slide provides the glimpse about the size of the market which focuses on TAM, SAM and SOM that showcase the fundamental market size metrics. Crafting an eye-catching presentation has never been more straightforward. Let your presentation shine with this tasteful yet straightforward Enterprise Pitch Deck Size Of The Market Ppt PowerPoint Presentation Gallery Rules PDF template. It offers a minimalistic and classy look that is great for making a statement. The colors have been employed intelligently to add a bit of playfulness while still remaining professional. Construct the ideal Firm Pitch Deck Size Of The Market Ppt PowerPoint Presentation Gallery Slide Download PDF that effortlessly grabs the attention of your audience Begin now and be certain to wow your customers
Sales Order Processing Performance Tracking Indicators Graphics PDF
The following slide showcases key performance indicators for sales order fulfilment to meet customer expectations, specifications, deliver goods on time, compare order fulfilment against past orders. It includes elements such as category, key performance indicators, expected rate and actual rate. Showcasing this set of slides titled Sales Order Processing Performance Tracking Indicators Graphics PDF. The topics addressed in these templates are Customer Metrics, Inbound Metrics, Financial Metrics. All the content presented in this PPT design is completely editable. Download it and make adjustments in color, background, font etc. as per your unique business setting.

Yearly Sales Assessment With Key Performance Indicator Matrix Introduction PDF
This slide covers quarterly product units sold through out a financial year in an organization with growth in revenue, profit and number of customer from previous years sales. It includes product sold and growth rate. Presenting Yearly Sales Assessment With Key Performance Indicator Matrix Introduction PDF to dispense important information. This template comprises four stages. It also presents valuable insights into the topics including Sold Growth Rate, Customers, Growth In Profit. This is a completely customizable PowerPoint theme that can be put to use immediately. So, download it and address the topic impactfully.
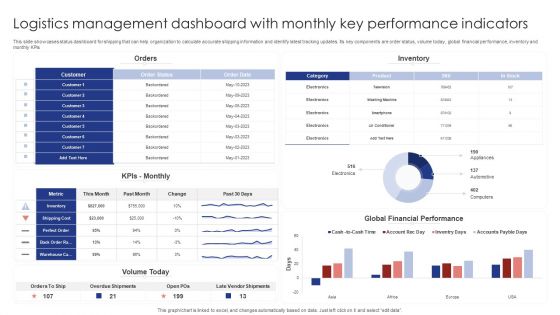
Logistics Management Dashboard With Monthly Key Performance Indicators Rules PDF
This slide showcases status dashboard for shipping that can help organization to calculate accurate shipping information and identify latest tracking updates. Its key components are order status, volume today, global financial performance, inventory and monthly KPIs. Pitch your topic with ease and precision using this Logistics Management Dashboard With Monthly Key Performance Indicators Rules PDF. This layout presents information on Orders, Inventory, Kpis Monthly. It is also available for immediate download and adjustment. So, changes can be made in the color, design, graphics or any other component to create a unique layout.

Accounting Key Performance Indicators Ppt Powerpoint
This is a accounting key performance indicators ppt powerpoint. This is a four stage process. The stages in this process are cost per invoice, invoice processing speed, productivity per team member, variance analysis.
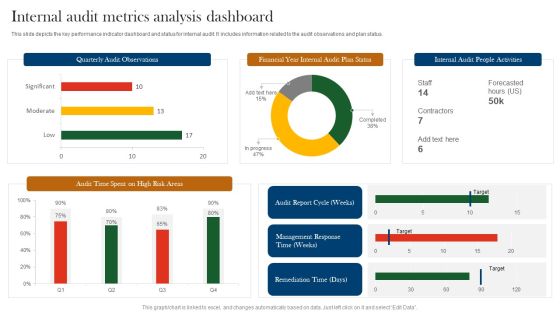
Internal Audit Metrics Analysis Dashboard Ppt Ideas Clipart Images PDF
This slide depicts the key performance indicator dashboard and status for internal audit. It includes information related to the audit observations and plan status. Pitch your topic with ease and precision using this Internal Audit Metrics Analysis Dashboard Ppt Ideas Clipart Images PDF. This layout presents information on Quarterly Audit Observations, Financial Year Internal, Audit Plan Status. It is also available for immediate download and adjustment. So, changes can be made in the color, design, graphics or any other component to create a unique layout.

Blueprint To Enhance Organizational Operations Key Business Metrics Ideas PDF
Purpose of the following slide is to show the key business metrics which can be used to measure the business performance. These metrics can be sales metrics, marketing metrics, financial metrics and human resource metrics. Want to ace your presentation in front of a live audience Our Blueprint To Enhance Organizational Operations Key Business Metrics Ideas PDF can help you do that by engaging all the users towards you. Slidegeeks experts have put their efforts and expertise into creating these impeccable powerpoint presentations so that you can communicate your ideas clearly. Moreover, all the templates are customizable, and easy to edit and downloadable. Use these for both personal and commercial use.
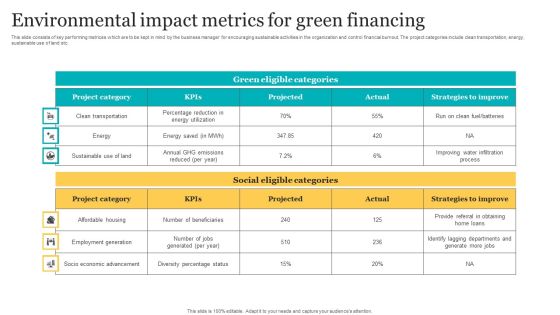
Environmental Impact Metrics For Green Financing Rules PDF
This slide consists of key performing metrices which are to be kept in mind by the business manager for encouraging sustainable activities in the organization and control financial burnout. The project categories include clean transportation, energy, sustainable use of land etc. Pitch your topic with ease and precision using this Environmental Impact Metrics For Green Financing Rules PDF. This layout presents information on Financing, Environmental, Metrics. It is also available for immediate download and adjustment. So, changes can be made in the color, design, graphics or any other component to create a unique layout.

Organization Key Metrics Summary By Human Resource Team Information PDF
This slide represents the dashboard showing the organizations financial health report prepared by the human resource department of the organization. It includes information related to sales, gross, operating and net profit, income statement, actual vs target sales, net operating cash etc. of the organization.Showcasing this set of slides titled Organization Key Metrics Summary By Human Resource Team Information PDF. The topics addressed in these templates are Organization Key Metrics Summary, Human Resource Team. All the content presented in this PPT design is completely editable. Download it and make adjustments in color, background, font etc. as per your unique business setting.
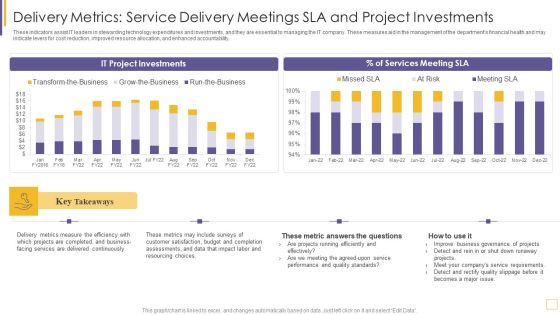
Guidelines For Exhibiting Business Value Of Information And Technology Delivery Metrics Service Portrait PDF
These indicators assist IT leaders in stewarding technology expenditures and investments, and they are essential to managing the IT company. These measures aid in the management of the departments financial health and may indicate levers for cost reduction, improved resource allocation, and enhanced accountability. Deliver and pitch your topic in the best possible manner with this guidelines for exhibiting business value of information and technology delivery metrics service portrait pdf. Use them to share invaluable insights on metrics measure, services, budget, resourcing and impress your audience. This template can be altered and modified as per your expectations. So, grab it now.
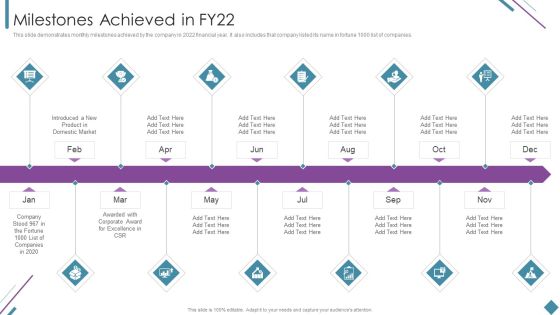
Metrics To Measure Business Performance Milestones Achieved In Fy22 Introduction PDF
This slide demonstrates monthly milestones achieved by the company in 2022 financial year. It also includes that company listed its name in fortune 1000 list of companies. This is a Metrics To Measure Business Performance Milestones Achieved In Fy22 Introduction PDF template with various stages. Focus and dispense information on twelve stages using this creative set, that comes with editable features. It contains large content boxes to add your information on topics like Corporate Award, Excellence CSR, Introduced New Product, Domestic Market. You can also showcase facts, figures, and other relevant content using this PPT layout. Grab it now.

Audit And Review Team Performance Measures And Kpis Portrait PDF
This slide illustrates audit team practices for better performance to improve the audit processes. It includes key performance indications, type of measures, measure used, target and reporting frequency etc.Pitch your topic with ease and precision using this Audit And Review Team Performance Measures And Kpis Portrait PDF. This layout presents information on Business Operations, Financial Management, Environment Changes. It is also available for immediate download and adjustment. So, changes can be made in the color, design, graphics or any other component to create a unique layout.
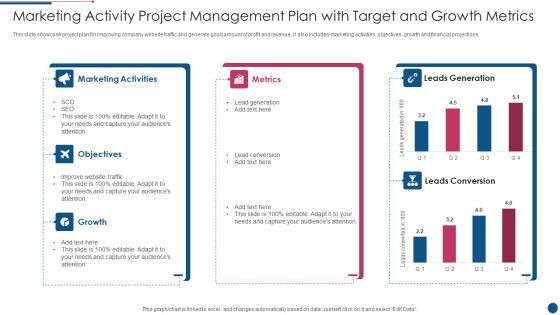
Marketing Activity Project Management Plan With Target And Growth Metrics Introduction PDF
This slide showcase project plan for improving company website traffic and generate good amount of profit and revenue, it also includes marketing activities, objectives, growth and financial projections. Pitch your topic with ease and precision using this Marketing Activity Project Management Plan With Target And Growth Metrics Introduction PDF. This layout presents information on Marketing Activities, Metrics, Growth. It is also available for immediate download and adjustment. So, changes can be made in the color, design, graphics or any other component to create a unique layout.

Net Banking Channel And Service Management Metric Dashboard Showcasing Digital Banking Professional PDF
This slide represents metric dashboard for digital banking. It covers credit limit, online limit, interest payment etc. that enables users to track financial transactions. Want to ace your presentation in front of a live audience. Our Net Banking Channel And Service Management Metric Dashboard Showcasing Digital Banking Professional PDF can help you do that by engaging all the users towards you. Slidegeeks experts have put their efforts and expertise into creating these impeccable powerpoint presentations so that you can communicate your ideas clearly. Moreover, all the templates are customizable, and easy to edit and downloadable. Use these for both personal and commercial use.

Data Quality Kpis Issues Prioritization Scorecard With Assessment Metrics Ideas PDF
This slide covers key data quality issues for e-commerce customers. It includes different metrics to check for impact of data issues in context to sales contribution analysis, marketing testimonials, customer financial risk, marketing campaigns, customer renewal analysis, etc. Showcasing this set of slides titled Data Quality Kpis Issues Prioritization Scorecard With Assessment Metrics Ideas PDF. The topics addressed in these templates are Context Of Analysis, Data Quality Attributes. All the content presented in this PPT design is completely editable. Download it and make adjustments in color, background, font etc. as per your unique business setting.
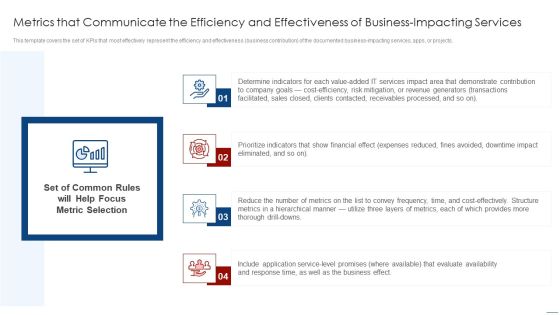
How To Evaluate And Develop The Organizational Value Of IT Service Metrics That Communicate The Efficiency Portrait PDF
This template covers the set of KPIs that most effectively represent the efficiency and effectiveness business contribution of the documented business-impacting services, apps, or projects. This is a how to evaluate and develop the organizational value of it service metrics that communicate the efficiency portrait pdf template with various stages. Focus and dispense information on four stages using this creative set, that comes with editable features. It contains large content boxes to add your information on topics like business, cost effectively, financial effect, goals. You can also showcase facts, figures, and other relevant content using this PPT layout. Grab it now.

Business Intelligence Dashboard Ppt Examples Slides
This is a business intelligence dashboard ppt examples slides. This is a four stage process. The stages in this process are metrics, scorecard, key performance indicator, numbers.

Annual B2C Business Review Dashboard Microsoft PDF
The following slide shows dashboard to help organizations arrange financial business indicators and communicate important companys information to key stakeholders. It includes sales, gross, operating and net profit and other major performance indicators. Showcasing this set of slides titled Annual B2C Business Review Dashboard Microsoft PDF. The topics addressed in these templates are Gross Profit, Sales, Operating Profit. All the content presented in this PPT design is completely editable. Download it and make adjustments in color, background, font etc. as per your unique business setting.

Automated Dashboard To Track Status Of Order Request Themes PDF
The following slide highlights automated dashboard which can be used to track the status of pleased orders, and manage the inventory across various outlets. The key performance indicators are order, summary, inventory, summary, cost of goods sold, financial statement. Showcasing this set of slides titled Automated Dashboard To Track Status Of Order Request Themes PDF. The topics addressed in these templates are Inventory Value, Inventory Summary, Cost. All the content presented in this PPT design is completely editable. Download it and make adjustments in color, background, font etc. as per your unique business setting.
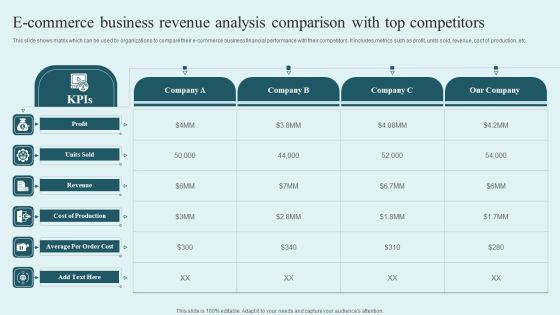
E Commerce Business Revenue Analysis Comparison With Top Competitors Rules PDF
This slide shows matrix which can be used by organizations to compare their e-commerce business financial performance with their competitors. It includes metrics such as profit, units sold, revenue, cost of production, etc. Showcasing this set of slides titled E Commerce Business Revenue Analysis Comparison With Top Competitors Rules PDF. The topics addressed in these templates are Profit, Revenue, Average Per, Order Cost . All the content presented in this PPT design is completely editable. Download it and make adjustments in color, background, font etc. as per your unique business setting.

Business Intelligence Dashboard To Track Company Sales Rules PDF
This slide displays BI dashboard to monitor financial health and profitability of the company. It includes metrics such as margin, number of stores, average lead time, store locations, etc. Showcasing this set of slides titled Business Intelligence Dashboard To Track Company Sales Rules PDF. The topics addressed in these templates are Business Intelligence Dashboard, Track Company Sales. All the content presented in this PPT design is completely editable. Download it and make adjustments in color, background, font etc. as per your unique business setting.
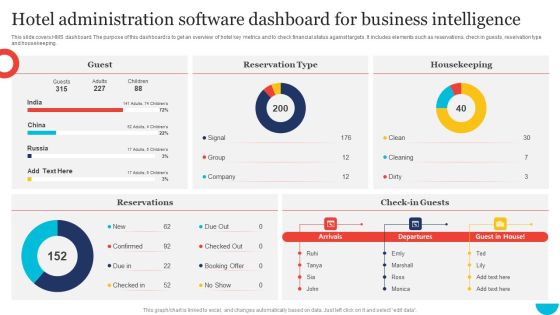
Hotel Administration Software Dashboard For Business Intelligence Infographics PDF
This slide covers HMS dashboard. The purpose of this dashboard is to get an overview of hotel key metrics and to check financial status against targets. It includes elements such as reservations, check in guests, reservation type and housekeeping. Pitch your topic with ease and precision using this Hotel Administration Software Dashboard For Business Intelligence Infographics PDF. This layout presents information on Guest, Housekeeping, Reservation Type. It is also available for immediate download and adjustment. So, changes can be made in the color, design, graphics or any other component to create a unique layout.

Our Mission Brand And Equity Evaluation Techniques And Procedures Structure PDF
Purpose of this slide is to address various approaches of measuring brand equity. Ways covered in the slide are brand awareness, financial metrics, preference metrics and competitive metrics.Create an editable Our Mission Brand And Equity Evaluation Techniques And Procedures Structure PDF that communicates your idea and engages your audience. Whether your are presenting a business or an educational presentation, pre-designed presentation templates help save time. Our Mission Brand And Equity Evaluation Techniques And Procedures Structure PDF is highly customizable and very easy to edit, covering many different styles from creative to business presentations. Slidegeeks has creative team members who have crafted amazing templates. So, go and get them without any delay.

Other Ways To Measure Brand Equity Guide To Brand Value Information PDF
Purpose of this slide is to address various approaches of measuring brand equity. Ways covered in the slide are brand awareness, financial metrics, preference metrics and competitive metrics.The best PPT templates are a great way to save time, energy, and resources. Slidegeeks have 100precent editable powerpoint slides making them incredibly versatile. With these quality presentation templates, you can create a captivating and memorable presentation by combining visually appealing slides and effectively communicating your message. Download Other Ways To Measure Brand Equity Guide To Brand Value Information PDF from Slidegeeks and deliver a wonderful presentation.

Other Ways To Measure Brand Equity Brand Value Estimation Guide Rules PDF
Purpose of this slide is to address various approaches of measuring brand equity. Ways covered in the slide are brand awareness, financial metrics, preference metrics and competitive metrics.Slidegeeks has constructed Other Ways To Measure Brand Equity Brand Value Estimation Guide Rules PDF after conducting extensive research and examination. These presentation templates are constantly being generated and modified based on user preferences and critiques from editors. Here, you will find the most attractive templates for a range of purposes while taking into account ratings and remarks from users regarding the content. This is an excellent jumping-off point to explore our content and will give new users an insight into our top-notch PowerPoint Templates.

E Business Model Security Strategy Framework To Prevent Fraudulent Transactions Rules PDF
This slide covers framework to ensure safe transactions on ecommerce platform. It includes regulatory strategies, financial and marketing operation strategies. Persuade your audience using this E Business Model Security Strategy Framework To Prevent Fraudulent Transactions Rules PDF. This PPT design covers three stages, thus making it a great tool to use. It also caters to a variety of topics including Customer Transactions, Assurance Metrics, Document Intellectual. Download this PPT design now to present a convincing pitch that not only emphasizes the topic but also showcases your presentation skills.

Objective Goals Strategies And Measures Framework For 3 Year Strategic Growth Plan Mockup PDF
This slide showcases OGSM framework that can help organization to formulate growth plan for next three financial years. Its key elements are goals, strategies, metrics and actions. Presenting Objective Goals Strategies And Measures Framework For 3 Year Strategic Growth Plan Mockup PDF to dispense important information. This template comprises one stages. It also presents valuable insights into the topics including Goals, Metrics, Actions. This is a completely customizable PowerPoint theme that can be put to use immediately. So, download it and address the topic impactfully.

R2R Dashboard With Income Statement Ppt PowerPoint Presentation Show Slide Download PDF
Following slide outlines a comprehensive R2R dashboard used for taking financial decisions. The various metrics covered in this slide are total income, expenses, net profit, cash at end of month, income and expenses, quick ratio, current ratio etc.Showcasing this set of slides titled R2R Dashboard With Income Statement Ppt PowerPoint Presentation Show Slide Download PDF. The topics addressed in these templates are Operating Expenses, Total Experience, Accounts Receivable. All the content presented in this PPT design is completely editable. Download it and make adjustments in color, background, font etc. as per your unique business setting.

Industry Wise Email Marketing Performance Statistics Analysis Graphics PDF
This slide includes email marketing benchmarks and statistics for the year 2022 based on various industries. It includes email metrics such as open rate, CTR, unsubscribes rate in industries like automobile, finance, retail, food, legal services, etc. Pitch your topic with ease and precision using this Industry Wise Email Marketing Performance Statistics Analysis Graphics PDF. This layout presents information on Automobile, Financial Service, Legal Services. It is also available for immediate download and adjustment. So, changes can be made in the color, design, graphics or any other component to create a unique layout.
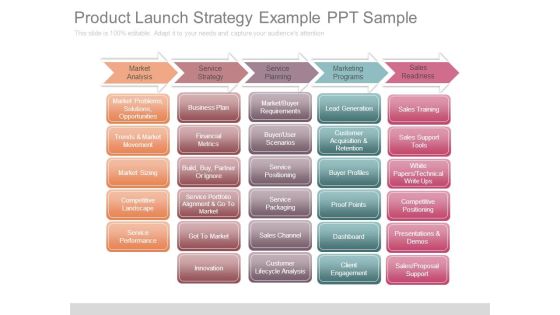
Product Launch Strategy Example Ppt Sample
This is a product launch strategy example ppt sample. This is a five stage process. The stages in this process are market analysis, service strategy, service planning, marketing programs, sales readiness, market problems solutions opportunities, trends and market movement, market sizing, competitive landscape, service performance, business plan, financial metrics, build buy partner or ignore, service portfolio alignment and go to market, got to market, innovation, market buyer requirements, buyer user scenarios, service positioning, service packaging, sales channel, customer lifecycle analysis, lead generation, customer acquisition and retention, buyer profiles, proof points, dashboard, client engagement, sales training, sales support tools, white papers technical write ups, competitive positioning, presentations and demos, sales proposal support.
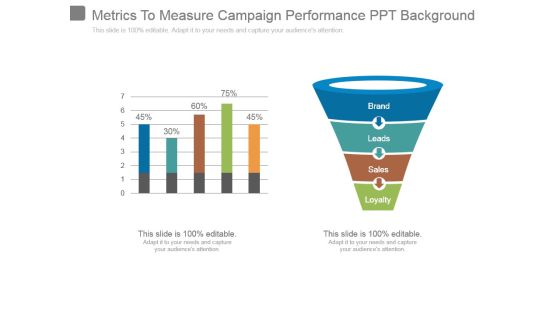
Metrics To Measure Campaign Performance Ppt Background
This is a metrics to measure campaign performance ppt background. This is a two stage process. The stages in this process are brand, leads, sales, loyalty.

Creating A Recruitment Dashboard Powerpoint Sample
This is a creating a recruitment dashboard powerpoint sample. This is a two stage process. The stages in this process are critical success factors, sourcing channels, recruiter efficiency, acceptance rate, key performance indicators, candidate, manager satisfaction, quality of hire, efficiency ratio.

Chart With Magnifying Glass For Business Research Ppt PowerPoint Presentation Inspiration Shapes
This is a chart with magnifying glass for business research ppt powerpoint presentation inspiration shapes. This is a two stage process. The stages in this process are metrics icon, kpis icon, statistics icon.
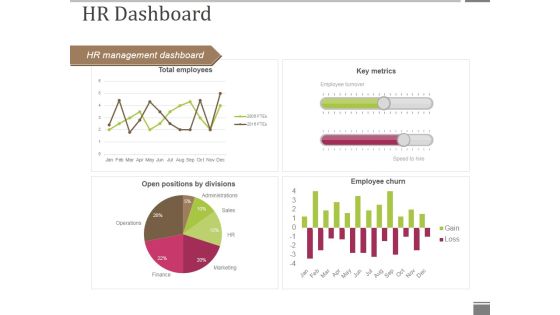
Hr Dashboard Template 1 Ppt PowerPoint Presentation Infographic Template Format Ideas
This is a hr dashboard template 1 ppt powerpoint presentation infographic template format ideas. This is a four stage process. The stages in this process are hr management dashboard, key metrics, employee churn, open positions by divisions, total employees.

Key Business Metrics Company Process Administration And Optimization Playbook Download PDF
Purpose of the following slide is to show the key business metrics which can be used to measure the business performance. These metrics can be sales metrics, marketing metrics, financial metrics and human resource metrics.Present like a pro with Key Business Metrics Company Process Administration And Optimization Playbook Download PDF Create beautiful presentations together with your team, using our easy-to-use presentation slides. Share your ideas in real-time and make changes on the fly by downloading our templates. So whether you are in the office, on the go, or in a remote location, you can stay in sync with your team and present your ideas with confidence. With Slidegeeks presentation got a whole lot easier. Grab these presentations today.

Strategic Guide To Perform Marketing Kpis To Analyze Marketing Process Performance Brochure PDF
This slide showcases various metrics to measure performance marketing process. It provides information of KPIs related to brand awareness, preference metrics, financial metrics competitive metrics, etc. Get a simple yet stunning designed Strategic Guide To Perform Marketing Kpis To Analyze Marketing Process Performance Brochure PDF. It is the best one to establish the tone in your meetings. It is an excellent way to make your presentations highly effective. So, download this PPT today from Slidegeeks and see the positive impacts. Our easy to edit Strategic Guide To Perform Marketing Kpis To Analyze Marketing Process Performance Brochure PDF can be your go to option for all upcoming conferences and meetings. So, what are you waiting for Grab this template today.
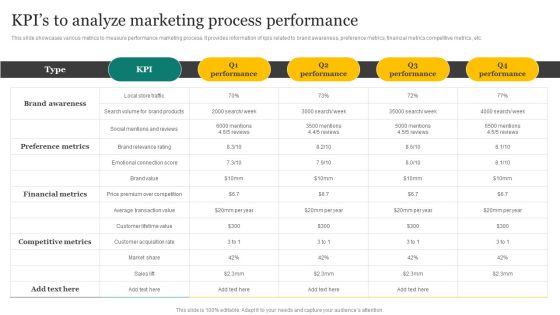
Strategic Promotion Plan Development Stages Kpis To Analyze Marketing Process Performance Guidelines PDF
This slide showcases various metrics to measure performance marketing process. It provides information of kpis related to brand awareness, preference metrics, financial metrics competitive metrics, etc. Get a simple yet stunning designed Strategic Promotion Plan Development Stages Kpis To Analyze Marketing Process Performance Guidelines PDF. It is the best one to establish the tone in your meetings. It is an excellent way to make your presentations highly effective. So, download this PPT today from Slidegeeks and see the positive impacts. Our easy to edit Strategic Promotion Plan Development Stages Kpis To Analyze Marketing Process Performance Guidelines PDF can be your go to option for all upcoming conferences and meetings. So, what are you waiting for Grab this template today.

Comprehensive Guide For Sales And Advertising Processes Kpis To Analyze Marketing Process Performance Professional PDF
This slide showcases various metrics to measure performance marketing process. It provides information of KPIs related to brand awareness, preference metrics, financial metrics competitive metrics, etc. Do you have to make sure that everyone on your team knows about any specific topic I yes, then you should give Comprehensive Guide For Sales And Advertising Processes Kpis To Analyze Marketing Process Performance Professional PDF a try. Our experts have put a lot of knowledge and effort into creating this impeccable Comprehensive Guide For Sales And Advertising Processes Kpis To Analyze Marketing Process Performance Professional PDF. You can use this template for your upcoming presentations, as the slides are perfect to represent even the tiniest detail. You can download these templates from the Slidegeeks website and these are easy to edit. So grab these today

Comprehensive Guide To Build Marketing Strategy Kpis To Analyze Marketing Process Introduction PDF
This slide showcases various metrics to measure performance marketing process. It provides information of KPIs related to brand awareness, preference metrics, financial metrics competitive metrics, etc. This Comprehensive Guide To Build Marketing Strategy Kpis To Analyze Marketing Process Introduction PDF from Slidegeeks makes it easy to present information on your topic with precision. It provides customization options, so you can make changes to the colors, design, graphics, or any other component to create a unique layout. It is also available for immediate download, so you can begin using it right away. Slidegeeks has done good research to ensure that you have everything you need to make your presentation stand out. Make a name out there for a brilliant performance.
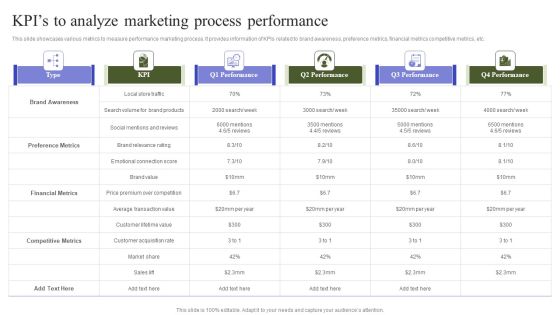
Marketing Mix Strategy Handbook Kpis To Analyze Marketing Process Performance Diagrams PDF
This slide showcases various metrics to measure performance marketing process. It provides information of KPIs related to brand awareness, preference metrics, financial metrics competitive metrics, etc. If you are looking for a format to display your unique thoughts, then the professionally designed Marketing Mix Strategy Handbook Kpis To Analyze Marketing Process Performance Diagrams PDF is the one for you. You can use it as a Google Slides template or a PowerPoint template. Incorporate impressive visuals, symbols, images, and other charts. Modify or reorganize the text boxes as you desire. Experiment with shade schemes and font pairings. Alter, share or cooperate with other people on your work. Download Marketing Mix Strategy Handbook Kpis To Analyze Marketing Process Performance Diagrams PDF and find out how to give a successful presentation. Present a perfect display to your team and make your presentation unforgettable.

Coca Cola Emotional Marketing Strategy Affect Of Consumer Emotions On Brands Kpis Inspiration PDF
This slide showcases assessing key indicators for measuring financial performance of brand. It provides details about turnover, marketing costs, sales, administrative expenses, profit, percentage turnover, trade debtor days, headcount, etc. Create an editable Coca Cola Emotional Marketing Strategy Affect Of Consumer Emotions On Brands Kpis Inspiration PDF that communicates your idea and engages your audience. Whether youre presenting a business or an educational presentation, pre-designed presentation templates help save time. Coca Cola Emotional Marketing Strategy Affect Of Consumer Emotions On Brands Kpis Inspiration PDF is highly customizable and very easy to edit, covering many different styles from creative to business presentations. Slidegeeks has creative team members who have crafted amazing templates. So, go and get them without any delay.

Comprehensive Guide To Strengthen Brand Equity Other Ways To Measure Brand Equity Brochure PDF
Purpose of this slide is to address various approaches of measuring brand equity. Ways covered in the slide are brand awareness, financial metrics, preference metrics and competitive metrics. Retrieve professionally designed Comprehensive Guide To Strengthen Brand Equity Other Ways To Measure Brand Equity Brochure PDF to effectively convey your message and captivate your listeners. Save time by selecting pre made slideshows that are appropriate for various topics, from business to educational purposes. These themes come in many different styles, from creative to corporate, and all of them are easily adjustable and can be edited quickly. Access them as PowerPoint templates or as Google Slides themes. You do not have to go on a hunt for the perfect presentation because Slidegeeks got you covered from everywhere.

Guide To Develop And Estimate Brand Value Other Ways To Measure Brand Equity Summary PDF
Purpose of this slide is to address various approaches of measuring brand equity. Ways covered in the slide are brand awareness, financial metrics, preference metrics and competitive metrics.Do you know about Slidesgeeks Guide To Develop And Estimate Brand Value Other Ways To Measure Brand Equity Summary PDF These are perfect for delivering any kind od presentation. Using it, create PowerPoint presentations that communicate your ideas and engage audiences. Save time and effort by using our pre-designed presentation templates that are perfect for a wide range of topic. Our vast selection of designs covers a range of styles, from creative to business, and are all highly customizable and easy to edit. Download as a PowerPoint template or use them as Google Slides themes.

Revolut Capital Funding Projections For Future And Our Ask For Revolut Pitch Deck Ppt Pictures PDF
Purpose of the following slide is to show the investment ask for Revolut pitch deck as it displays the key financials projections for the next 5 years, as it displays key metrics such as key summary data, gross revenues, Gross profit and net profit. Purpose of the following slide is to show the investment ask for Revolut pitch deck as it displays the key financials projections for the next 5 years, as it displays key metrics such as key summary data, gross revenues, Gross profit and net profit. Deliver and pitch your topic in the best possible manner with this Revolut Capital Funding Projections For Future And Our Ask For Revolut Pitch Deck Ppt Pictures PDF. Use them to share invaluable insights on Key Summary Data, Gross Revenue, Transaction Costs and impress your audience. This template can be altered and modified as per your expectations. So, grab it now.
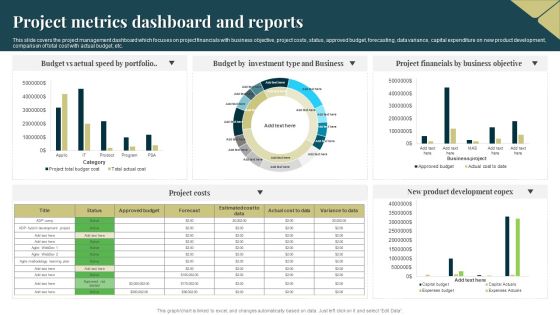
Project Metrics Dashboard And Reports Portrait PDF
This slide covers the project management dashboard which focuses on project financials with business objective, project costs, status, approved budget, forecasting, data variance, capital expenditure on new product development, comparison of total cost with actual budget, etc. Showcasing this set of slides titled Project Metrics Dashboard And Reports Portrait PDF. The topics addressed in these templates are Budget, Portfolio, Investment. All the content presented in this PPT design is completely editable. Download it and make adjustments in color, background, font etc. as per your unique business setting.
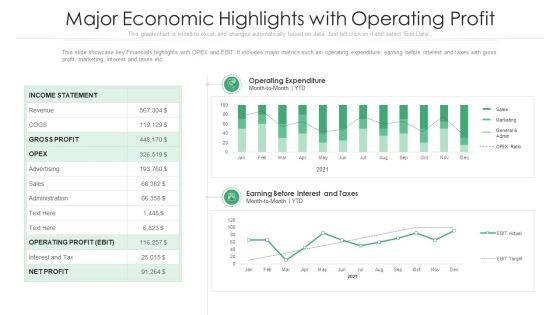
Major Economic Highlights With Operating Profit Ppt PowerPoint Presentation File Portfolio PDF
This slide showcase key Financials highlights with OPEX and EBIT. It includes major metrics such as- operating expenditure, earning before interest and taxes with gross profit, marketing, interest and taxes etc. Showcasing this set of slides titled major economic highlights with operating profit ppt powerpoint presentation file portfolio pdf. The topics addressed in these templates are revenue, sales, administration. All the content presented in this PPT design is completely editable. Download it and make adjustments in color, background, font etc. as per your unique business setting.
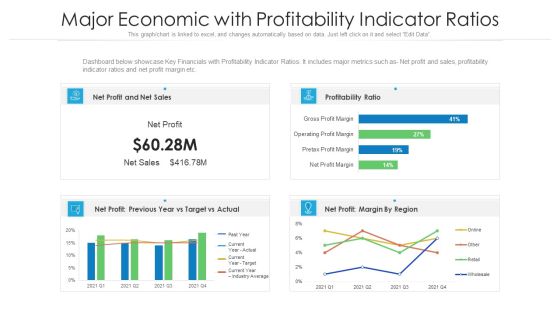
Major Economic With Profitability Indicator Ratios Ppt PowerPoint Presentation Gallery Layouts PDF
Dashboard below showcase Key Financials with Profitability Indicator Ratios. It includes major metrics such as- Net profit and sales, profitability indicator ratios and net profit margin etc. Pitch your topic with ease and precision using this major economic with profitability indicator ratios ppt powerpoint presentation gallery layouts pdf. This layout presents information on sales, profitability ratio, target. It is also available for immediate download and adjustment. So, changes can be made in the color, design, graphics or any other component to create a unique layout.
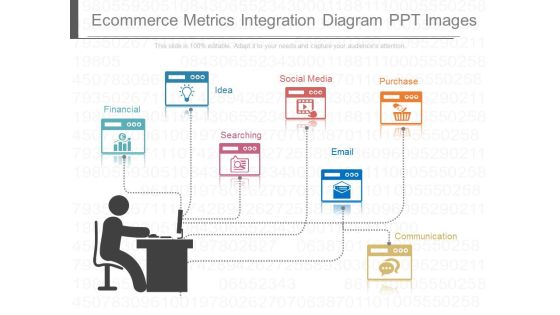
Ecommerce Metrics Integration Diagram Ppt Images
This is a ecommerce metrics integration diagram ppt images. This is a seven stage process. The stages in this process are financial, idea, searching, social media, email, purchase, communication.
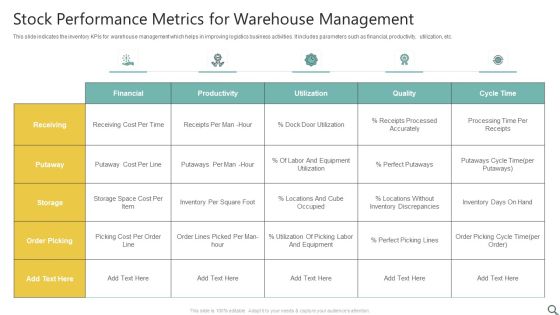
Stock Performance Metrics For Warehouse Management Ppt Tips PDF
This slide indicates the inventory KPIs for warehouse management which helps in improving logistics business activities. It includes parameters such as financial, productivity, utilization, etc. Showcasing this set of slides titled Stock Performance Metrics For Warehouse Management Ppt Tips PDF. The topics addressed in these templates are Receiving, Financial, Productivity. All the content presented in this PPT design is completely editable. Download it and make adjustments in color, background, font etc. as per your unique business setting.

Project Management Departmental Metrics Balanced Scorecard Introduction PDF
This slide covers the project management scorecard with department wise objectives and metrics to track their performance. The departmental objectives includes financial, customer and internal. Showcasing this set of slides titled Project Management Departmental Metrics Balanced Scorecard Introduction PDF. The topics addressed in these templates are Customer, Financial, Customer Retention. All the content presented in this PPT design is completely editable. Download it and make adjustments in color, background, font etc. as per your unique business setting.

Key Performance Indicators For SCM Ppt PowerPoint Presentation File Graphic Tips PDF
Presenting this set of slides with name key performance indicators for scm ppt powerpoint presentation file graphic tips pdf. The topics discussed in these slides are global, financial, perform. This is a completely editable PowerPoint presentation and is available for immediate download. Download now and impress your audience.

4 Key Market Drivers Of Economic Growth Ppt PowerPoint Presentation Templates
This is a 4 key market drivers of economic growth ppt powerpoint presentation templates. This is a four stage process. The stages in this process are key market driver.

Strategical And Tactical Planning Developing Appropriate Criteria Metrics For Strategic Execution Ideas PDF
This template covers balance scorecard for developing appropriate criteria for strategic execution. It includes metrices for financial, learning and growth, customer and internal objectives. Deliver and pitch your topic in the best possible manner with this Strategical And Tactical Planning Developing Appropriate Criteria Metrics For Strategic Execution Ideas PDF. Use them to share invaluable insights on Financial, Learning And Growth, Internal, Customer and impress your audience. This template can be altered and modified as per your expectations. So, grab it now.

Loyalty Program Performance Ppt PowerPoint Presentation Tips
This is a loyalty program performance ppt powerpoint presentation tips. This is a four stage process. The stages in this process are enrollments, reward outstanding, loyalty revenue, gift sales.

Loyalty Program Performance Ppt PowerPoint Presentation Portfolio
This is a loyalty program performance ppt powerpoint presentation portfolio. This is a four stage process. The stages in this process are enrollments, reward outstanding, loyalty revenue, gift sales.

Results Of Service Performance Evaluation With Customer Objectives Diagrams PDF
Following slide depicts a dashboard which can be used by managers to track the result of customer service balanced scorecard to take corrective actions and achieve organizational goals. The key performing indicators relate to financial, customer, learning and growth and internal objectives. Showcasing this set of slides titled Results Of Service Performance Evaluation With Customer Objectives Diagrams PDF. The topics addressed in these templates are Financial, Customer, Internal. All the content presented in this PPT design is completely editable. Download it and make adjustments in color, background, font etc. as per your unique business setting.
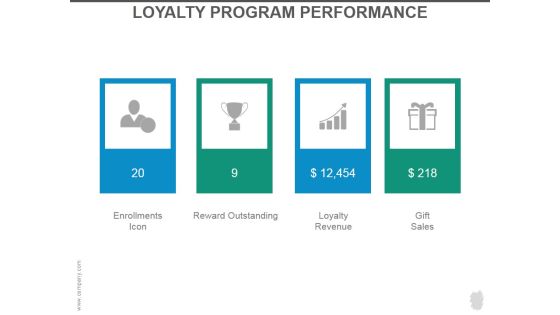
Loyalty Program Performance Ppt PowerPoint Presentation Slides
This is a loyalty program performance ppt powerpoint presentation slides. This is a four stage process. The stages in this process are enrollments icon, reward outstanding, loyalty revenue, gift sales.

Loyalty Program Performance Ppt PowerPoint Presentation Introduction
This is a loyalty program performance ppt powerpoint presentation introduction. This is a four stage process. The stages in this process are enrollments icon, reward outstanding, loyalty revenue, gift sales.
International Economic Performance Metrics And Kpis Ppt PowerPoint Presentation Gallery Icon PDF
Presenting this set of slides with name international economic performance metrics and kpis ppt powerpoint presentation gallery icon pdf. The topics discussed in these slides are global, financial, performance. This is a completely editable PowerPoint presentation and is available for immediate download. Download now and impress your audience.

10 Designs To An Amazing Pitch Example Of Ppt
This is a 10 designs to an amazing pitch example of ppt. This is a ten stage process. The stages in this process are business model, money, market size, the solution, team, marketing plan, competition, elevator pitch, proprietary tech, the problem.
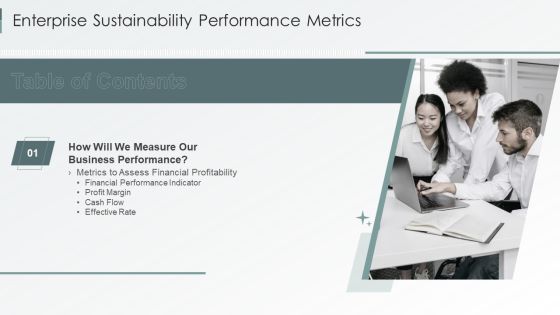
Table Of Contents Enterprise Sustainability Performance Metrics Rules Pictures PDF
This is a Table Of Contents Enterprise Sustainability Performance Metrics Rules Pictures PDF template with various stages. Focus and dispense information on one stage using this creative set, that comes with editable features. It contains large content boxes to add your information on topics like Business Performance, Assess Financial, Performance Indicator. You can also showcase facts, figures, and other relevant content using this PPT layout. Grab it now.
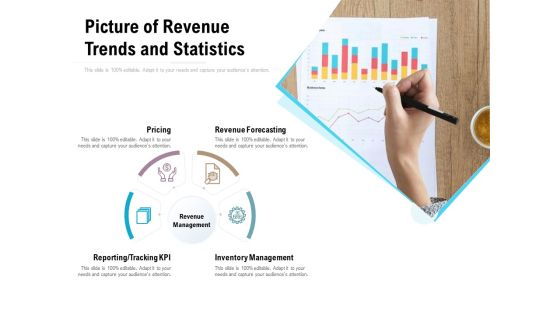
Picture Of Revenue Trends And Statistics Ppt PowerPoint Presentation Ideas Backgrounds
Presenting this set of slides with name picture of revenue trends and statistics ppt powerpoint presentation ideas backgrounds. This is a four stage process. The stages in this process are pricing, revenue forecasting, inventory management, reporting, tracking kpi, revenue management. This is a completely editable PowerPoint presentation and is available for immediate download. Download now and impress your audience.

Revenue Planning Framework With Inventory Management Ppt PowerPoint Presentation Show Smartart
Presenting this set of slides with name revenue planning framework with inventory management ppt powerpoint presentation show smartart. This is a four stage process. The stages in this process are revenue forecasting, pricing, inventory management, reporting, tracking kpi. This is a completely editable PowerPoint presentation and is available for immediate download. Download now and impress your audience.

Strategy For Managing Ecommerce Returns Reverse Logistics Dashboard Days Template PDF
Deliver an awe inspiring pitch with this creative strategy for managing ecommerce returns reverse logistics dashboard days template pdf bundle. Topics like global, financial, performance, metric, inventory can be discussed with this completely editable template. It is available for immediate download depending on the needs and requirements of the user.

Profit Summary Base Plan Vs Stretch Plan Presentation Diagrams
This is a profit summary base plan vs stretch plan presentation diagrams. This is a three stage process. The stages in this process are base plan, stretch plan, comments, kpi, cost of sales, revenue, gross profit, customer acquisition cost, other operating expense, operating profit, change in cash, ending cash, employees ftes.
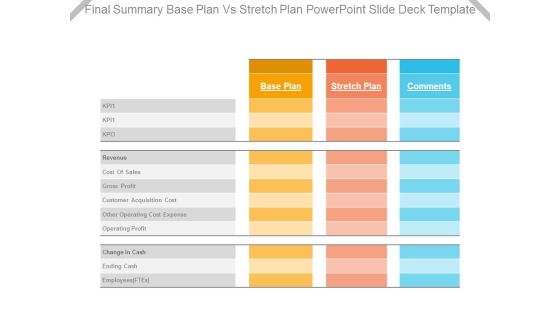
Final Summary Base Plan Vs Stretch Plan Powerpoint Slide Deck Template
This is a final summary base plan vs stretch plan powerpoint slide deck template. This is a three stage process. The stages in this process are kpi, revenue, cost of sales, gross profit, customer acquisition cost, other operating cost expense, operating profit, change in cash, ending cash, employees ftes.
KPIs And Metrics To Measure Pharmaceutical Drug Of Pharmaceutical Company Icons PDF
Mentioned slide showcases various key performance indicators KPIs which can be used to measure the development of pharmaceutical companies in different years. The key metrics are productivity, competency, quality of care and financial. Showcasing this set of slides titled KPIs And Metrics To Measure Pharmaceutical Drug Of Pharmaceutical Company Icons PDF. The topics addressed in these templates are Productivity, Competency, Quality Of Care. All the content presented in this PPT design is completely editable. Download it and make adjustments in color, background, font etc. as per your unique business setting.
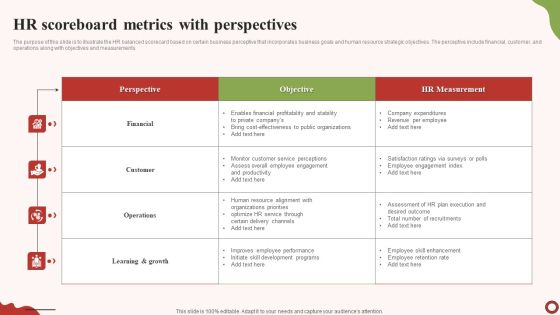
HR Scoreboard Metrics With Perspectives Themes PDF
The purpose of this slide is to illustrate the HR balanced scorecard based on certain business perceptive that incorporates business goals and human resource strategic objectives. The perceptive include financial, customer, and operations along with objectives and measurements. Showcasing this set of slides titled HR Scoreboard Metrics With Perspectives Themes PDF. The topics addressed in these templates are Financia, Customer, Operations. All the content presented in this PPT design is completely editable. Download it and make adjustments in color, background, font etc. as per your unique business setting.

Organisational Level Employee Key Performance Indicators Performance Indicators Rules PDF
The following slide highlights the organisational level staff key performance Indicators illustrating key headings KPI, description, benchmark and value. It also depicts revenue per employee, profit per FTE, human capital ROI, absenteeism rate and overtime per employee Showcasing this set of slides titled Organisational Level Employee Key Performance Indicators Performance Indicators Rules PDF The topics addressed in these templates are Revenue Compensation, Overtime Employee, Benchmark All the content presented in this PPT design is completely editable. Download it and make adjustments in color, background, font etc. as per your unique business setting.
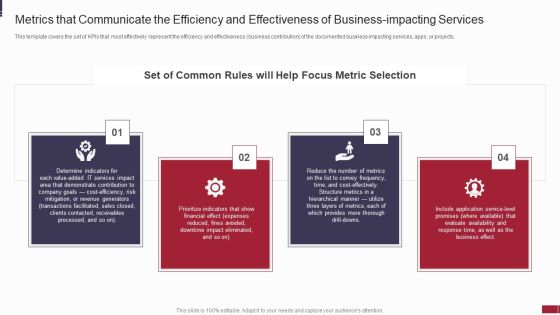
IT Value Story Significant To Corporate Leadership Metrics That Communicate The Efficiency Background PDF
This template covers the set of KPIs that most effectively represent the efficiency and effectiveness business contribution of the documented business-impacting services, apps, or projects. Presenting it value story significant to corporate leadership metrics that communicate the efficiency background pdf to provide visual cues and insights. Share and navigate important information on four stages that need your due attention. This template can be used to pitch topics like determine, financial, expenses, metrics. In addtion, this PPT design contains high resolution images, graphics, etc, that are easily editable and available for immediate download.

Communicate Company Value To Your Stakeholders Metrics That Communicate The Efficiency Download PDF
This template covers the set of KPIs that most effectively represent the efficiency and effectiveness business contribution of the documented business-impacting services, apps, or projects. This is a communicate company value to your stakeholders metrics that communicate the efficiency download pdf template with various stages. Focus and dispense information on four stages using this creative set, that comes with editable features. It contains large content boxes to add your information on topics like determine, services, financial, expenses, reduce. You can also showcase facts, figures, and other relevant content using this PPT layout. Grab it now.
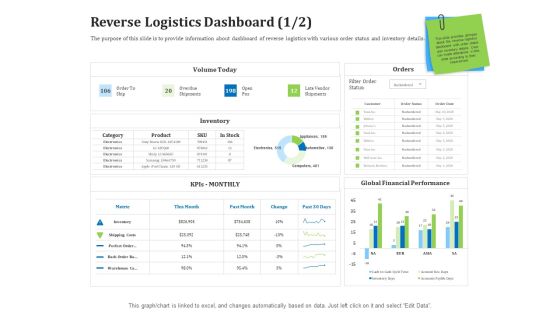
Reverse Logistics Management Reverse Logistics Dashboard Days Ppt Infographics Files PDF
The purpose of this slide is to provide information about dashboard of reverse logistics with various order status and inventory details. Deliver an awe inspiring pitch with this creative reverse logistics management reverse logistics dashboard days ppt infographics files pdf bundle. Topics like global, financial, performance, metric, inventory can be discussed with this completely editable template. It is available for immediate download depending on the needs and requirements of the user.
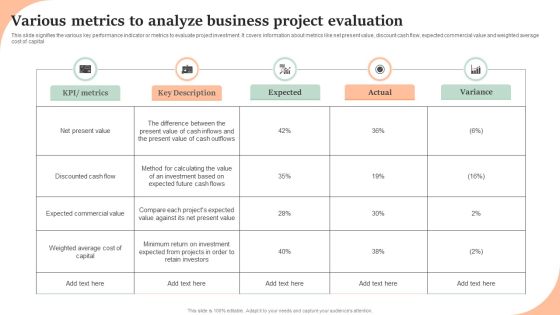
Various Metrics To Analyze Business Project Evaluation Inspiration PDF
This slide signifies the various key performance indicator or metrics to evaluate project investment. It covers information about metrics like net present value, discount cash flow, expected commercial value and weighted average cost of capital. Pitch your topic with ease and precision using this Various Metrics To Analyze Business Project Evaluation Inspiration PDF. This layout presents information on KPI, Metrics, Key Description, Expected, Actual, Variance. It is also available for immediate download and adjustment. So, changes can be made in the color, design, graphics or any other component to create a unique layout.
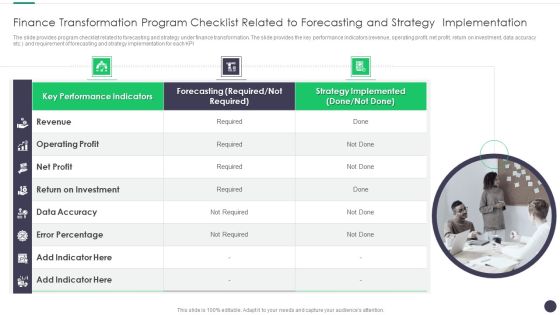
Finance And Accounting Online Conversion Plan Finance Transformation Program Brochure PDF
The slide provides program checklist related to forecasting and strategy under finance transformation. The slide provides the key performance indicators revenue, operating profit, net profit, return on investment, data accuracy etc. and requirement of forecasting and strategy implementation for each KPI. This is a Finance And Accounting Online Conversion Plan Finance Transformation Program Brochure PDF template with various stages. Focus and dispense information on one stage using this creative set, that comes with editable features. It contains large content boxes to add your information on topics like Performance Indicators, Strategy Implemented, Revenue. You can also showcase facts, figures, and other relevant content using this PPT layout. Grab it now.

Defining The Most Commonly Used Performance Monitoring Metrics For Supply Chain Microsoft PDF
Purpose of this slide is to illustrate key performance metrics used by supply chain enterprises to track overall business performance. KPIs covered are of operational, financial, strategic and relationship.Crafting an eye-catching presentation has never been more straightforward. Let your presentation shine with this tasteful yet straightforward Defining The Most Commonly Used Performance Monitoring Metrics For Supply Chain Microsoft PDF template. It offers a minimalistic and classy look that is great for making a statement. The colors have been employed intelligently to add a bit of playfulness while still remaining professional. Construct the ideal Defining The Most Commonly Used Performance Monitoring Metrics For Supply Chain Microsoft PDF that effortlessly grabs the attention of your audience Begin now and be certain to wow your customers
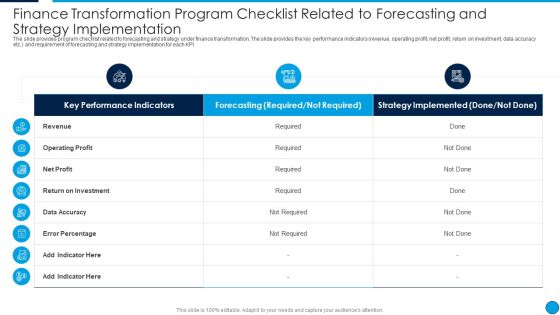
Summary Finance Transformation Program Checklist Related To Forecasting Clipart PDF
The slide provides program checklist related to forecasting and strategy under finance transformation. The slide provides the key performance indicators revenue, operating profit, net profit, return on investment, data accuracy etc. and requirement of forecasting and strategy implementation for each KPI. Deliver and pitch your topic in the best possible manner with this Summary Finance Transformation Program Checklist Related To Forecasting Clipart PDF. Use them to share invaluable insights on Key Performance Indicators, Forecasting Required, Not Required, Strategy Implemented, Return On Investment and impress your audience. This template can be altered and modified as per your expectations. So, grab it now.

Quality Resources Department Training Report Ppt Summary Graphics PDF
This slide contains the balanced scorecard on the quality resources to have a accurate idea of business resources and workflow. It also includes department and owner, objective, category, metric , target and actual levels, etc. Showcasing this set of slides titled Quality Resources Department Training Report Ppt Summary Graphics PDF. The topics addressed in these templates are Internal Business Process, Financial, Learning And Growth. All the content presented in this PPT design is completely editable. Download it and make adjustments in color, background, font etc. as per your unique business setting.
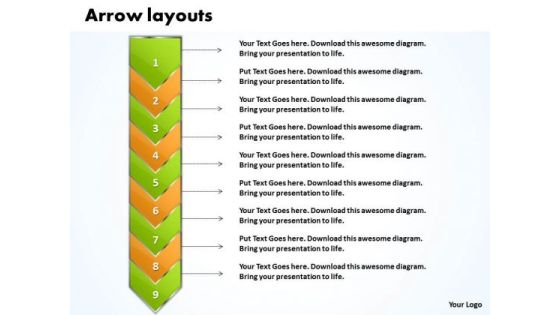
Ppt Go Green Layouts PowerPoint Free And Orange Arrow 9 Stages Templates
PPT go green layouts powerpoint free and orange arrow 9 stages Templates-Use this Curved Arrows diagram to show activities that are related to the business plan metrics and monitor the results to determine if the business plan is proceeding as planned. Our PPT images are so perfectly designed that it reveals the very basis of our PPT diagrams and are an effective tool to make your clients understand.-PPT go green layouts powerpoint free and orange arrow 9 stages Templates-Arrow, Background, Process, Business, Chart, Diagram, Financial, Graphic, Gray, Icon, Illustration, Management, Orange, Perspective, Process, Reflection, 9 Stages, Steps, Text, Transparency

Ppt Team Effort Person Standing Yellow Piece Of Chart PowerPoint Ks2 Templates
PPT team effort person standing yellow piece of chart PowerPoint ks2 Templates-Use this Circular Arrow diagram to show activities that are related to the business plan metrics and monitor the results to determine if the business plan is proceeding as planned. You can apply other 3D Styles and shapes to the slide to enhance your presentations.-PPT team effort person standing yellow piece of chart PowerPoint ks2 Templates-arrow, bar, business, businessman, candidate, cartoon, character, chart, circle, circular, client, communication, company, concept, diagram, finance, financial, flow, growth, human, illustration, increase, information, iteration, man, market, marketing, process, processing, profit, sales, statistics, stats, success, target

Annual Strategic Annual Business Growth Plan Themes PDF
This slide showcase growth plan of organization in coming year with a focus of increasing sales revenue. It also includes purpose, key objectives, initiatives and key performance indicators KPI. Presenting Annual Strategic Annual Business Growth Plan Themes PDF to dispense important information. This template comprises three stages. It also presents valuable insights into the topics including Market Development, Process Improvement, People Development. This is a completely customizable PowerPoint theme that can be put to use immediately. So, download it and address the topic impactfully.

Sales Techniques Playbook MEDDIC Sales Methodology For Client Qualification Download PDF
Sales methodology caters guidelines that assist sales representatives in closing deal with clients. MEDDIC sales methodology is client qualification process for complex and enterprise sales. MEDDIC comprise of metrics, economic buyer, decision criteria, decision process, identify pain and champion. Deliver and pitch your topic in the best possible manner with this sales techniques playbook meddic sales methodology for client qualification download pdf Use them to share invaluable insights on determine economic impact of product, ensure engagement of financial, comparative assessment and impress your audience. This template can be altered and modified as per your expectations. So, grab it now.
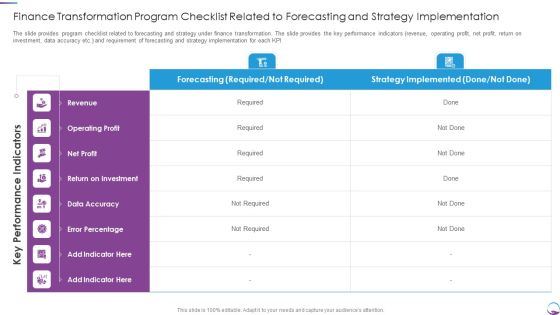
Finance Transformation Program Checklist Related To Forecasting And Strategy Implementation Pictures PDF
The slide provides program checklist related to forecasting and strategy under finance transformation. The slide provides the key performance indicators revenue, operating profit, net profit, return on investment, data accuracy etc. and requirement of forecasting and strategy implementation for each KPI. Deliver and pitch your topic in the best possible manner with this Finance Transformation Program Checklist Related To Forecasting And Strategy Implementation Pictures PDF. Use them to share invaluable insights on Finance Transformation Program Checklist Related To Forecasting And Strategy Implementation and impress your audience. This template can be altered and modified as per your expectations. So, grab it now.
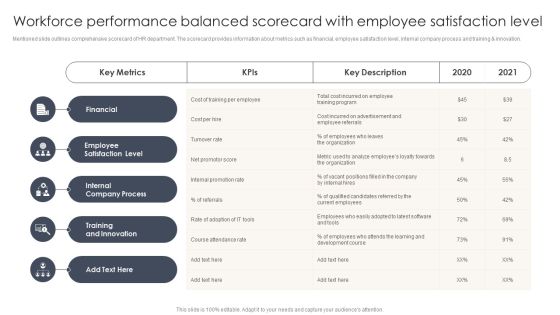
Workforce Performance Balanced Scorecard With Employee Satisfaction Level Inspiration PDF
Mentioned slide outlines comprehensive scorecard of HR department. The scorecard provides information about metrics such as financial, employee satisfaction level, internal company process and training and innovation. Pitch your topic with ease and precision using this Workforce Performance Balanced Scorecard With Employee Satisfaction Level Inspiration PDF. This layout presents information on Employee Satisfaction Level, Internal Company Process, Training Innovation. It is also available for immediate download and adjustment. So, changes can be made in the color, design, graphics or any other component to create a unique layout.

Pitchbook For IPO Deal Companys Strategic Decisions For IPO Issue Elements PDF
The slide covers the strategic steps taken by the company before introducing its IPO. Key strategic steps include IPO decision, IPO qualification, IPO preparation. This is a pitchbook for ipo deal companys strategic decisions for ipo issue elements pdf template with various stages. Focus and dispense information on three stages using this creative set, that comes with editable features. It contains large content boxes to add your information on topics like requirements, financial, costs, performance, metrics. You can also showcase facts, figures, and other relevant content using this PPT layout. Grab it now.

4 Key Project Management Responsibilities To Legal Services Structure PDF
This slide provides the glimpse about the legal market, regulatory and commercial factors which defines, plans, delivers and close the legal projects. This is a 4 key project management responsibilities to legal services structure pdf template with various stages. Focus and dispense information on four stages using this creative set, that comes with editable features. It contains large content boxes to add your information on topics like requirements, financial, risk, management, metrics. You can also showcase facts, figures, and other relevant content using this PPT layout. Grab it now.

Customer Service Key Performance Indicators Ppt Example
This is a customer service key performance indicators ppt example. This is a three stage process. The stages in this process are overall satisfaction with service, satisfaction with value for money, overall satisfaction with relationship.

Basics Of Crm Strategy Diagram Powerpoint Slide Backgrounds
This is a basics of crm strategy diagram powerpoint slide backgrounds. This is a eight stage process. The stages in this process are customer experiences, processes, technology, project management, organizational orientation, adoption, metrics and financials, customer information.
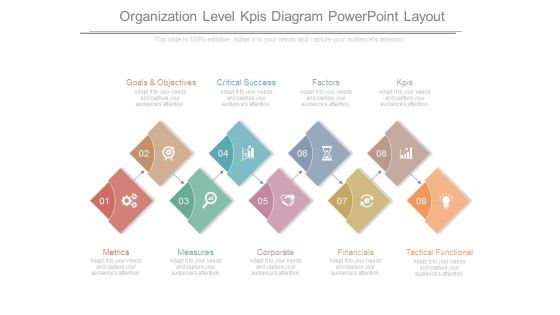
Organization Level Kpis Diagram Powerpoint Layout
This is a organization level kpis diagram powerpoint layout. This is a nine stage process. The stages in this process are goals and objectives, critical success, factors, kpis, metrics, measures, corporate, financials, tactical functional.

Transformation Process Metrics With Operational Efficiency Ppt PowerPoint Presentation Pictures Graphic Images PDF
Presenting this set of slides with name transformation process metrics with operational efficiency ppt powerpoint presentation pictures graphic images pdf. The topics discussed in these slides are changes successful, changes by business justification, financials, operational efficiency. This is a completely editable PowerPoint presentation and is available for immediate download. Download now and impress your audience.
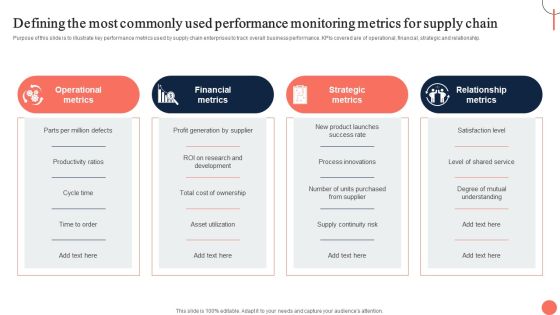
Strategies For Dynamic Supply Chain Agility Defining The Most Commonly Used Performance Demonstration PDF
Purpose of this slide is to illustrate key performance metrics used by supply chain enterprises to track overall business performance. KPIs covered are of operational, financial, strategic and relationship. Create an editable Strategies For Dynamic Supply Chain Agility Defining The Most Commonly Used Performance Demonstration PDF that communicates your idea and engages your audience. Whether youre presenting a business or an educational presentation, pre designed presentation templates help save time. Strategies For Dynamic Supply Chain Agility Defining The Most Commonly Used Performance Demonstration PDF is highly customizable and very easy to edit, covering many different styles from creative to business presentations. Slidegeeks has creative team members who have crafted amazing templates. So, go and get them without any delay.

Prospective Buyer Retention Dashboard With Key Performance Indicators Themes PDF
This slide shows the dashboard representing the key performance metrics for retention of potential customers of the organization. It shows no. of active users, churn rate, cost of customer acquisition, their life time value, monthly recurring revenue etc.Pitch your topic with ease and precision using this Prospective Buyer Retention Dashboard With Key Performance Indicators Themes PDF. This layout presents information on Recurring Revenue, Revenue Growth, Customer Acquisition. It is also available for immediate download and adjustment. So, changes can be made in the color, design, graphics or any other component to create a unique layout.

Revenue And Employee Key Performance Indicators Background PDF
The following slide highlights the revenue and staff key performance Indicators illustrating key headings which includes revenue centres, employee vs profitability, billable hours, average rate per hour and profitable employees Deliver an awe inspiring pitch with this creative Revenue And Employee Key Performance Indicators Background PDF bundle. Topics like Revenue Centres, Employee Profitability, Profitable Employee can be discussed with this completely editable template. It is available for immediate download depending on the needs and requirements of the user.

Key Performance Indicators For Staff Performance Management Clipart PDF
The following slide highlights the key performance Indicators for staff performance management illustrating key headings which includes revenue per hour, profit per employee, utilization rate, task completion rate, overtime per employee and employee capacity Persuade your audience using this Key Performance Indicators For Staff Growth Topics PDF This PPT design covers six stages, thus making it a great tool to use. It also caters to a variety of topics including Revenue Employee, Profit Employee, Task Completion Download this PPT design now to present a convincing pitch that not only emphasizes the topic but also showcases your presentation skills.
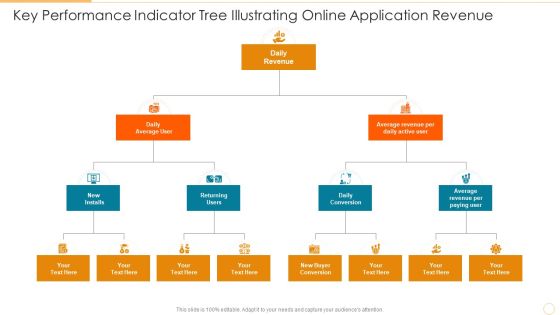
Key Performance Indicator Tree Illustrating Online Application Revenue Download PDF
Presenting key performance indicator tree illustrating online application revenue download pdf to dispense important information. This template comprises three stages. It also presents valuable insights into the topics including daily conversion, returning users, daily revenue. This is a completely customizable PowerPoint theme that can be put to use immediately. So, download it and address the topic impactfully.

Business Case Development And Approval Ppt Presentation
This is a business case development and approval ppt presentation. This is a four stage process. The stages in this process are situation analysis, vision and plan, financials, swot analysis, various illustrations, 0bjectives, metrics, key initiatives, process, technology, organization, timeline, cash flow, payback, rol, npv, irr, external consumer analysis, internal business discovery.

Key Performance Indicators For Ecommerce Diagram Ppt Design
This is a key performance indicators for ecommerce diagram ppt design. This is a eight stage process. The stages in this process are cost strategies, price strategies, market share strategies, market size strategies, conversion optimization, social sentiment, economic factors, brand awareness.

Competitive Analysis By Key Performance Indicators 2020 Designs PDF
The slide shows the comparison of major KPIs key performance indicators of the company with its competitors. Major KPIs include Revenue, net profit, number of flights, number of passengers, number of pilots etc.Deliver an awe-inspiring pitch with this creative competitive analysis by key performance indicators 2020 designs pdf. bundle. Topics like net profits, revenue, number of passengers can be discussed with this completely editable template. It is available for immediate download depending on the needs and requirements of the user.

Competitive Analysis By Key Performance Indicators 2020 Professional PDF
The slide shows the comparison of major KPIs key performance indicators of the company with its competitors. Major KPIs include Revenue, net profit, number of flights, number of passengers, number of pilots etc. Deliver an awe inspiring pitch with this creative competitive analysis by key performance indicators 2020 professional pdf bundle. Topics like revenue, net profits can be discussed with this completely editable template. It is available for immediate download depending on the needs and requirements of the user.

Competitive Analysis By Key Performance Indicators 2020 Elements PDF
The slide shows the comparison of major KPIs key performance indicators of the company with its competitors. Major KPIs include Revenue, net profit, number of flights, number of passengers, number of pilots etc. Deliver an awe inspiring pitch with this creative competitive analysis by key performance indicators 2020 elements pdf bundle. Topics like competitive analysis by key performance indicators can be discussed with this completely editable template. It is available for immediate download depending on the needs and requirements of the user.

Key Performance Indicators For Smarketing Ppt Icon Graphic Images PDF
This slide shows various KPIs which can be used to measure marketing and sales alignment. These are overall revenue, sales cycle length, marketing qualified leads, etc. Presenting Key Performance Indicators For Smarketing Ppt Icon Graphic Images PDF to dispense important information. This template comprises one stages. It also presents valuable insights into the topics including KPIs, Overall Revenue, Sales Cycle Length. This is a completely customizable PowerPoint theme that can be put to use immediately. So, download it and address the topic impactfully.

Competitive Analysis By Key Performance Indicators 2020 Inspiration PDF
The slide shows the comparison of major KPIs key performance indicators of the company with its competitors. Major KPIs include Revenue, net profit, number of flights, number of passengers, number of pilots etc. Deliver and pitch your topic in the best possible manner with this competitive analysis by key performance indicators 2020 inspiration pdf. Use them to share invaluable insights on comparison, revenue, net profit, number of flights, number of passengers and impress your audience. This template can be altered and modified as per your expectations. So, grab it now.

Organization Manpower Management Technology HR Key Performance Indicators Graphics PDF
Deliver an awe inspiring pitch with this creative organization manpower management technology hr key performance indicators graphics pdf bundle. Topics like criteria, workforce, performance, revenue, internal can be discussed with this completely editable template. It is available for immediate download depending on the needs and requirements of the user.
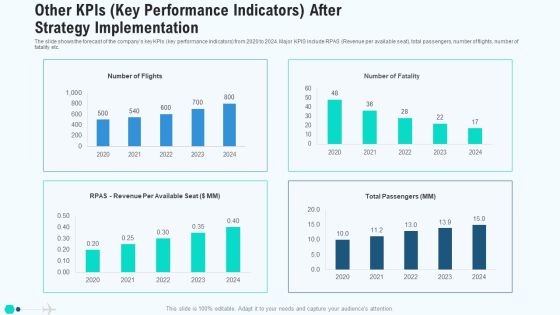
Other Kpis Key Performance Indicators After Strategy Implementation Mockup PDF
The slide shows the forecast of the companys key KPIs key performance indicators from 2020 to 2024. Major KPIS include RPAS Revenue per available seat, total passengers, number of flights, number of fatality etc. Deliver and pitch your topic in the best possible manner with this other kpis key performance indicators after strategy implementation mockup pdf. Use them to share invaluable insights on other kpis key performance indicators after strategy implementation and impress your audience. This template can be altered and modified as per your expectations. So, grab it now.
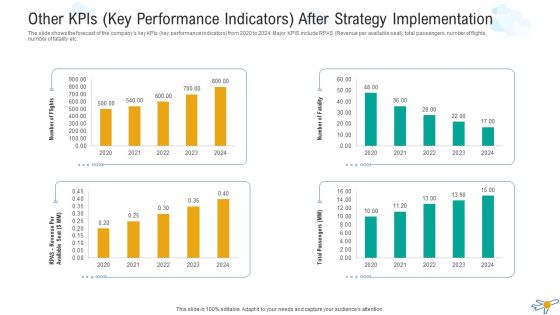
Other Kpis Key Performance Indicators After Strategy Implementation Microsoft PDF
The slide shows the forecast of the companys key KPIs key performance indicators from 2020 to 2024. Major KPIS include RPAS Revenue per available seat, total passengers, number of flights, number of fatality etc. Deliver and pitch your topic in the best possible manner with this other kpis key performance indicators after strategy implementation microsoft pdf. Use them to share invaluable insights on other kpis key performance indicators after strategy implementation and impress your audience. This template can be altered and modified as per your expectations. So, grab it now.

Other Kpis Key Performance Indicators After Strategy Implementation Infographics PDF
The slide shows the forecast of the companys key KPIs key performance indicators from 2020 to 2024. Major KPIS include RPAS Revenue per available seat, total passengers, number of flights, number of fatality etc. Deliver and pitch your topic in the best possible manner with this other kpis key performance indicators after strategy implementation infographics pdf. Use them to share invaluable insights on other kpis key performance indicators after strategy implementation and impress your audience. This template can be altered and modified as per your expectations. So, grab it now.

Organizations Key Performance Indicators To Measure Progress One Pager Documents
This one page covers about key performance indicators to measure progress through various KPIs that includes revenue growth, comparable sales growth and adjusted operating profit growth. Presenting you a fantastic Organizations Key Performance Indicators To Measure Progress One Pager Documents. This piece is crafted on hours of research and professional design efforts to ensure you have the best resource. It is completely editable and its design allow you to rehash its elements to suit your needs. Get this Organizations Key Performance Indicators To Measure Progress One Pager Documents A4 One-pager now.
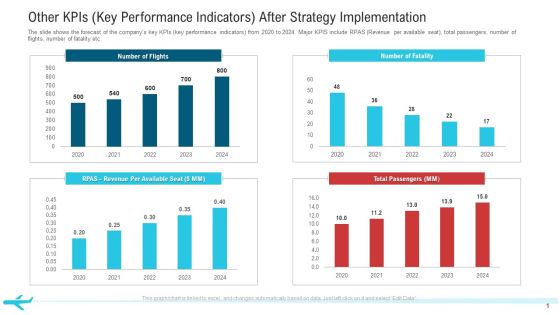
Other Kpis Key Performance Indicators After Strategy Implementation Professional PDF
The slide shows the forecast of the companys key KPIs key performance indicators from 2020 to 2024. Major KPIS include RPAS Revenue per available seat, total passengers, number of flights, number of fatality etc.Deliver and pitch your topic in the best possible manner with this other KPIs key performance indicators after strategy implementation professional pdf. Use them to share invaluable insights on total passengers, number of flights, 2020 to 2024 and impress your audience. This template can be altered and modified as per your expectations. So, grab it now.

Key Performance Indicators For Advertising And Promotion Plan Background PDF
This slide shows KPIs for measuring effectiveness of advertising and promotion plan for increasing overall revenue. It include KPIs such as conversion rate, cost per lead and social media management, etc. Persuade your audience using this Key Performance Indicators For Advertising And Promotion Plan Background PDF. This PPT design covers five stages, thus making it a great tool to use. It also caters to a variety of topics including Conversion Rate, Cost Per Lead, Social Media Management. Download this PPT design now to present a convincing pitch that not only emphasizes the topic but also showcases your presentation skills.
 Home
Home