AI PPT Maker
Templates
PPT Bundles
Design Services
Business PPTs
Business Plan
Management
Strategy
Introduction PPT
Roadmap
Self Introduction
Timelines
Process
Marketing
Agenda
Technology
Medical
Startup Business Plan
Cyber Security
Dashboards
SWOT
Proposals
Education
Pitch Deck
Digital Marketing
KPIs
Project Management
Product Management
Artificial Intelligence
Target Market
Communication
Supply Chain
Google Slides
Research Services
 One Pagers
All Categories
-
Home
- Customer Favorites
- Financial Icons
Financial Icons

Leading And Lagging Indicators Diagram Example Of Ppt
This is a leading and lagging indicators diagram example of ppt. This is a two stage process. The stages in this process are legging indicator, management ability, employee engagement, leading indicator, process improvement, financial performance, customer loyalty.

Advisors Investment Management Process Flow Diagram Ppt Example
This is a advisors investment management process flow diagram ppt example. This is a three stage process. The stages in this process are investment strategy, portfolio management, performance reporting, holistic financial plan.

Practice Management Systems For Law Firms Ppt Diagrams
This is a practice management systems for law firms ppt diagrams. This is a five stage process. The stages in this process are financial management, contact management, case management, time management, document management.

Advanced Email Metrics And Analysis Services Diagram Slide
This is a advanced email metrics and analysis services diagram slide. This is a four stage process. The stages in this process are analytics data warehouse, data mining, financial modeling.
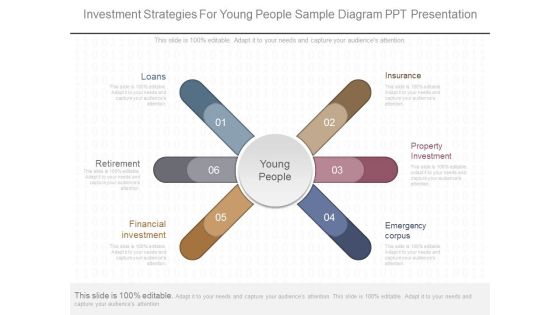
Investment Strategies For Young People Sample Diagram Ppt Presentation
This is a investment strategies for young people sample diagram ppt presentation. This is a six stage process. The stages in this process are loans, retirement, financial investment, emergency corpus, property investment, insurance.
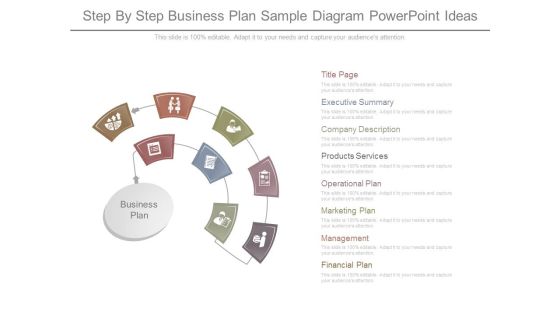
Step By Step Business Plan Sample Diagram Powerpoint Ideas
This is a step by step business plan sample diagram powerpoint ideas. This is a eight stage process. The stages in this process are business plan, title page, executive summary, products services, operational plan, marketing plan, management, financial plan.
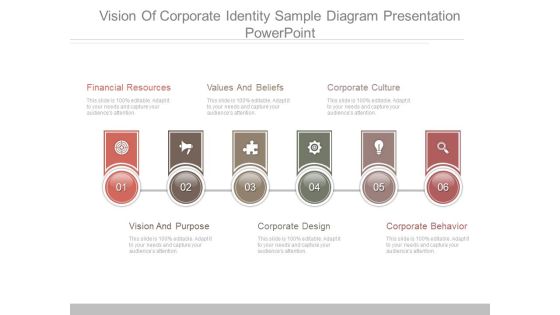
Vision Of Corporate Identity Sample Diagram Presentation Powerpoint
This is a vision of corporate identity sample diagram presentation powerpoint. This is a six stage process. The stages in this process are financial resources, values and beliefs, corporate culture, vision and purpose, corporate design, corporate behavior.

B2b Integration Solutions With Ecommerce Diagram Ppt Model
This is a b2b integration solutions with ecommerce diagram ppt model. This is a seven stage process. The stages in this process are print pdf catalog, web storefront, mobile web shops, financial administration, mobile media, payment services, online web shops.
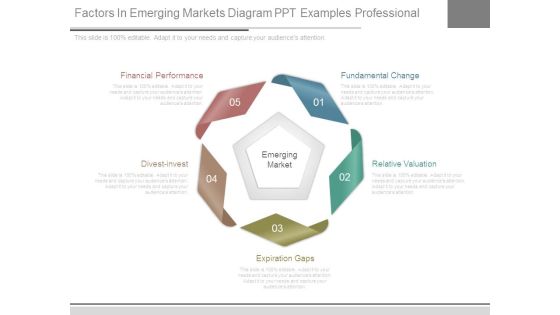
Factors In Emerging Markets Diagram Ppt Examples Professional
This is a factors in emerging markets diagram ppt examples professional. This is a five stage process. The stages in this process are financial performance, fundamental change, relative valuation, expiration gaps, divest invest, emerging market.
It Outsourcing Strategy Diagram Powerpoint Slide Deck Samples
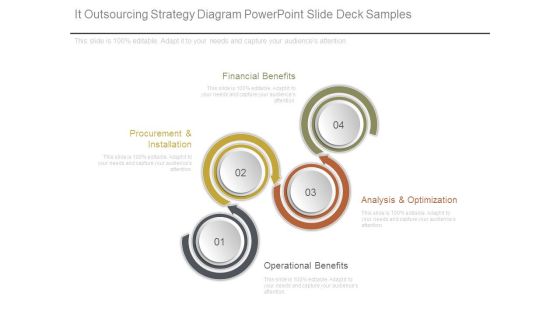
This is a it outsourcing strategy diagram powerpoint slide deck samples. This is a four stage process. The stages in this process are procurement and installation, financial benefits, operational benefits, analysis and optimization.

Management And Control Of Quality Diagram Presentation Examples
This is a management and control of quality diagram presentation examples. This is a five stage process. The stages in this process are implement, financial services, smartphone applications, mortage services, health care.
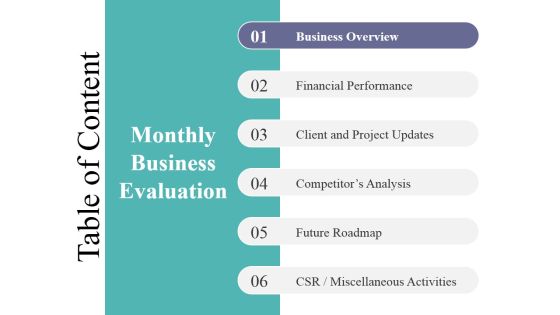
Table Of Content Template 2 Ppt PowerPoint Presentation Model Diagrams
This is a table of content template 2 ppt powerpoint presentation model diagrams. This is a six stage process. The stages in this process are business overview, financial performance, client and project updates, competitors analysis, future roadmap, csr miscellaneous activities.

Business Diagram Eight Staged Circular Puzzle Bar Graph Presentation Template
This Power Point template has been crafted with graphic of eight staged circular puzzle and bar graph. This PPT contains the financial result analysis related concept. Use this PPT for your business and success related presentations.

Dashboard Diagram For Finance And Strategic Analysis Powerpoint Slides
This PowerPoint template display graphics of clock with arrows around it and dollar symbol in center. You may use this PPT slide for financial and strategic analysis. This dashboard slide may useful for multilevel status report creation and approval process.
Five Arrows Signboard Style Timeline Diagram Powerpoint Slides
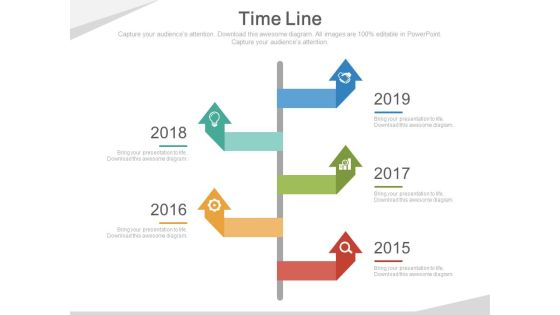
This five arrows signboard style timeline template can be used for multiple purposes including event planning, new milestones and tasks. This PPT slide may be helpful to display financial strategy timeline. Download this PowerPoint timeline template to make impressive presentations.
Timeline Infographic Diagram For Business Achievements Powerpoint Slides
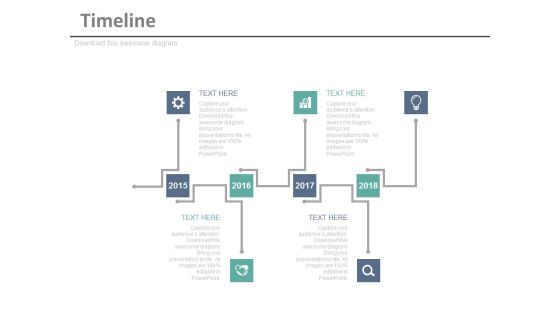
This timeline infographic template can be used for multiple purposes including event planning, new milestones and tasks. This PPT slide may be helpful to display financial strategy timeline. Download this PowerPoint timeline template to make impressive presentations.

Five Sequential Year Tags Timeline Diagram Powerpoint Slides
This PowerPoint timeline template can be used for specific organizational objectives. This PPT slide may be helpful to display financial strategy and timeline. Download this PowerPoint timeline template to make impressive presentations.

Tree For Dollar Growth Concept Powerpoint Template
This business diagram has been designed with dollar growth tree. You may use this slide to display financial success and growth concepts. Make your mark with this unique slide and create an impression that will endure.

Business Accounting And Taxation Example Powerpoint Guide
This is a business accounting and taxation example powerpoint guide. This is a three stage process. The stages in this process are accounting and tax, financial management, business adviser.

Real Estate Development Analysis Powerpoint Slides Show
This is a real estate development analysis powerpoint slides show. This is a five stage process. The stages in this process are development analysis, financial and economic analysis, environmental data impact analysis, customer base management analysis, real estate development analysis.

3d Happy Person With Dollars PowerPoint Templates
Concept of financial growth analysis with happiness has been defined in this PowerPoint template. This diagram slide contains the graphic of 3d man standing over the currency. Use this image for business and finance related topics in any presentation.

Arrows Diagram For Short Term Vs Long Term Objectives Presentation Outline
This is a arrows diagram for short term vs long term objectives presentation outline. This is a two stage process. The stages in this process are long term objectives, financial plan, short term objectives.

Business Person With Big Dollar Sign Powerpoint Templates
Adjust the above diagram into your presentations to visually support your content. This slide has been professionally designed with graphics of business man with big dollar sign. This template offers an excellent background to display corporate financial management.
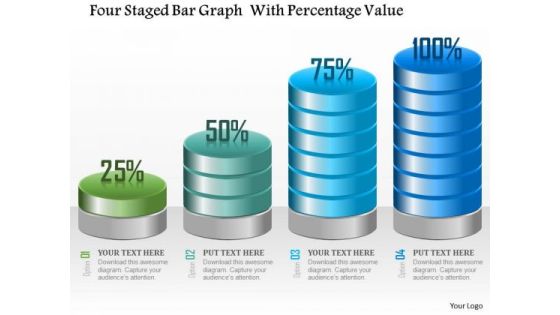
Business Diagram Four Staged Bar Graph With Percentage Value Presentation Template
Four staged bar graph with percentage value has been used to craft this power point template. This PPT contains the concept of making financial timeline and result analysis. This PPT can be used for business and finance related presentations.
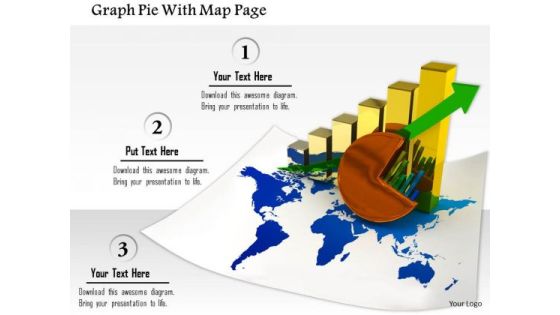
Stock Photo Graph Pie With Map Page PowerPoint Slide
This image slide contains business charts on world map. This image is designed with bar graph and pie chart on world map depicting global economy. Use this image slide to represent financial growth in any business presentation.
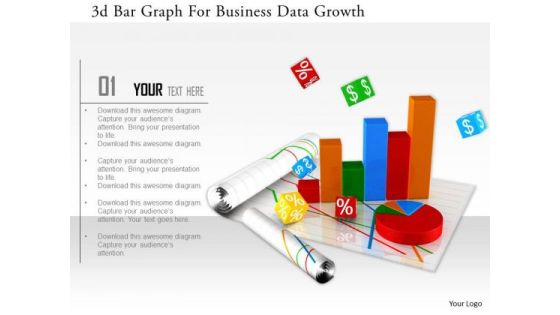
Stock Photo 3d Bar Graph For Business Data Growth Image Graphics For PowerPoint Slide
This image slide has graphics of financial charts and reports. This contains bar graph and pie chart to present business reports. Build an innovative presentations using this professional image slide.
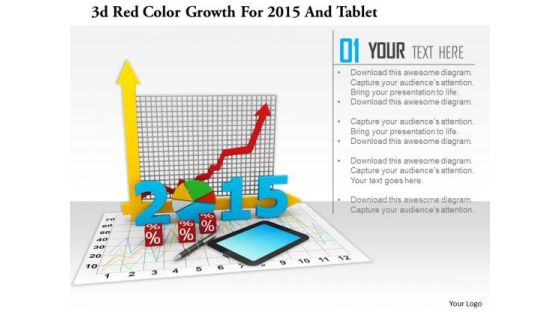
Stock Photo 3d Red Color Growth For 2015 And Tablet PowerPoint Slide
This image slide has graphics of financial charts and reports. This contains bar graph and pie chart to present business reports. Build an innovative presentation using this professional image slide.
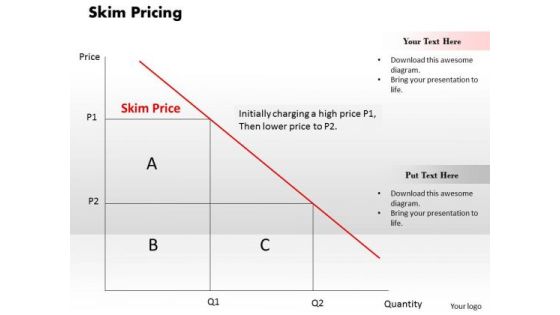
Business Framework Skim Pricing PowerPoint Presentation
This business framework power point template contains the graphic of graph. This PPT has been created with concept of skim pricing. Explain the skim pricing in your business and financial presentations by using this unique PPT.
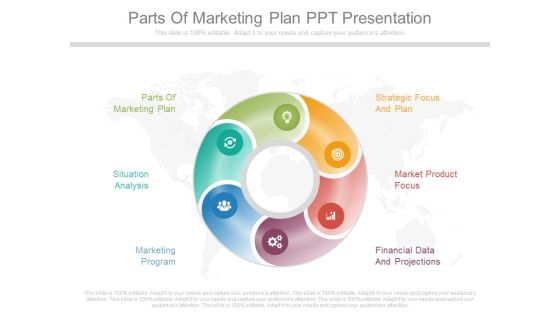
Parts Of Marketing Plan Ppt Presentation
This is a parts of marketing plan ppt presentation. This is a six stage process. The stages in this process are parts of marketing plan, strategic focus and plan, situation analysis, market product focus, marketing program, financial data and projections.
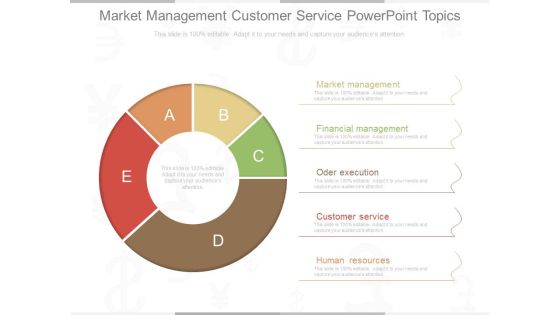
Market Management Customer Service Powerpoint Topics
This is a market management customer service powerpoint topics. This is a five stage process. The stages in this process are market management, financial management, oder execution, customer service, human resources.

Internal Business Environment Template Ppt Example
This is an internal business environment template ppt example. This is a six stage process. The stages in this process are plans and policies, human resources, financial resources, corporate image, plant and machinery, lab our management.
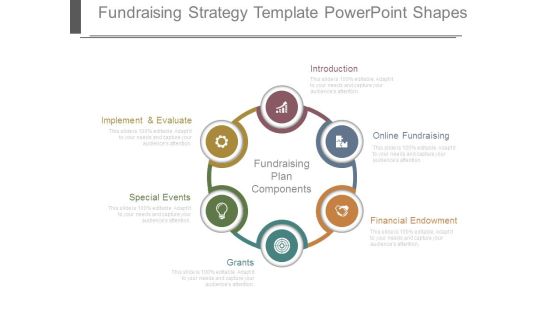
Fundraising Strategy Template Powerpoint Shapes
This is a fundraising strategy template powerpoint shapes. This is a six stage process. The stages in this process are implement and evaluate, special events, grants, introduction, online fundraising, financial endowment, fundraising plan components.
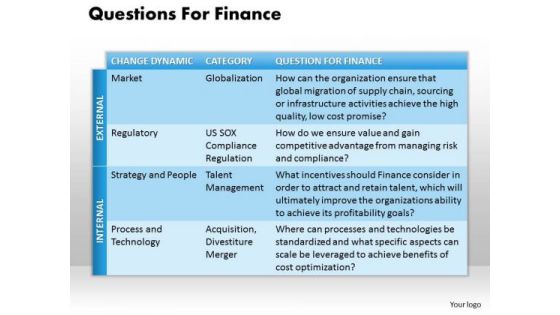
Business Framework Questions For Finance PowerPoint Presentation
This diagram depicts concepts of financial planning. Download this business diagram for your business and finance planning projects. This pre designed high quality business diagram will make your presentation simply the best.

Table Of Content Template 2 Ppt PowerPoint Presentation Ideas Rules
This is a table of content template 2 ppt powerpoint presentation ideas rules. This is a six stage process. The stages in this process are business overview, financial performance, client and project updates, competitors analysis, future roadmap, csr miscellaneous activities.

Table Of Content Template 3 Ppt PowerPoint Presentation Model Slide
This is a table of content template 3 ppt powerpoint presentation model slide. This is a six stage process. The stages in this process are business overview, financial performance, client and project updates, competitors analysis, future roadmap, csr miscellaneous activities.
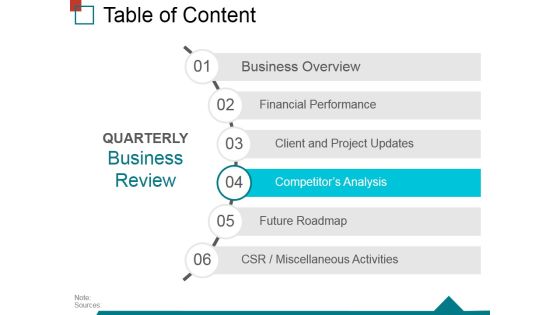
Table Of Content Template 4 Ppt PowerPoint Presentation Layouts Example
This is a table of content template 4 ppt powerpoint presentation layouts example. This is a six stage process. The stages in this process are business overview, financial performance, client and project updates, competitors analysis, future roadmap, csr miscellaneous activities.
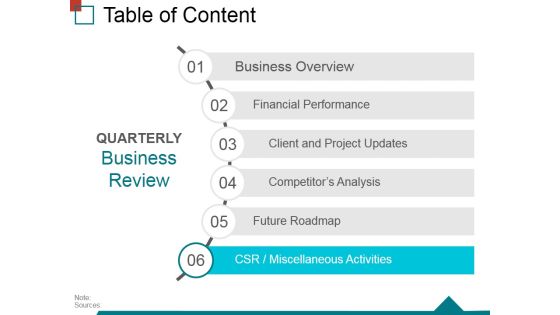
Table Of Content Template 6 Ppt PowerPoint Presentation Inspiration Grid
This is a table of content template 6 ppt powerpoint presentation inspiration grid. This is a six stage process. The stages in this process are business overview, financial performance, client and project updates, competitors analysis, future roadmap, csr miscellaneous activities.

Dollar Infographic For Equity Accounting Powerpoint Template
Our professionally designed business diagram is as an effective tool for communicating concept of equity accounting. It contains dollar infographic diagram. Above slide is suitable to display financial planning and strategy.

Four Directional Arrows Road Infographics Powerpoint Template
Download this exclusive business diagram to present four steps of financial reporting. This slide contains the four directional arrows road infographic. This PPT diagram slide is useful for business presentations.

Dollar Trophy For Goal Success Powerpoint Templates
This PowerPoint slide has been designed with diagram of dollar trophy. This diagram is designed to depict concepts of goal and financial success. This professional slide helps in making an instant impact on viewers.
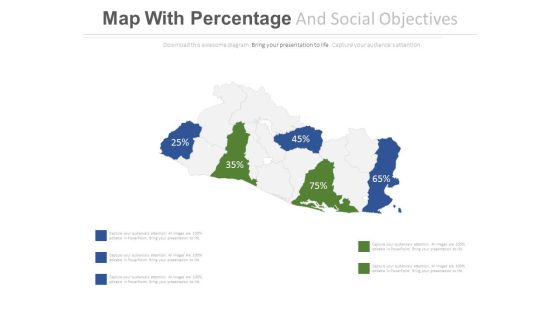
Map With Highlighted Areas And Percentage Values Powerpoint Slides
This PowerPoint template displays map diagram with highlighted areas and percentage values. You may use this PPT slide to exhibit area wise financial growth. Download this PowerPoint map diagram to build impressive presentations.
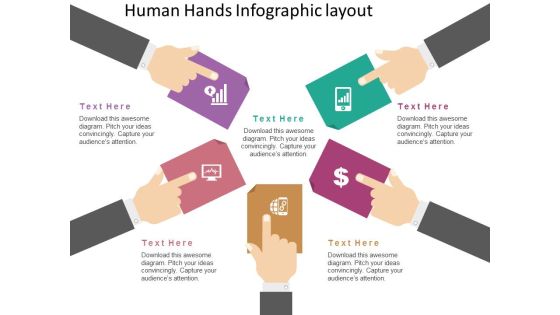
Human Hands Infographic Layout Powerpoint Template
Our professionally designed business diagram is as an effective tool for communicating concepts of financial planning. This slide illustrates human hands infographic. Convey your views with this diagram slide.

Service Resource Planning Ppt PowerPoint Presentation Styles
This is a service resource planning ppt powerpoint presentation styles. This is a five stage process. The stages in this process are crm, demand and capacity planning, engagement management, service delivery management, erp and corporate dashboards, financial management.

Executive Summary Ppt PowerPoint Presentation Model Show
This is a executive summary ppt powerpoint presentation model show. This is a five stage process. The stages in this process are background, capabilities, accreditation, promoters and shareholding, financial highlights.

Area Stacked Ppt PowerPoint Presentation Infographics Shapes
This is a area stacked ppt powerpoint presentation infographics shapes. This is a two stage process. The stages in this process are product, area stacked, sales in percentage, financial year.

Stacked Area Clustered Column Ppt PowerPoint Presentation Summary Slides
This is a stacked area clustered column ppt powerpoint presentation summary slides. This is a three stage process. The stages in this process are product, in percentage, financial year, bar graph.

Consulting Slides 3 Stages Of Business Process Business Presentation
This Linear Flow diagram is a powerful tool for financial systems as well as business processed and marketing. Lay down the fundamentals to build upon and lead the way to spread good cheer to one and all.

Illustration Of Dollar Growth Graph PowerPoint Template
This business slide contains graphics of dollar symbols on graph. This diagram helps to portray concept of financial planning. Present your views using this innovative slide and be assured of leaving a lasting impression.

Growth Graph With Design Elements PowerPoint Templates
The above template displays growth bar graph. This PowerPoint template signifies the concept of business and financial planning. Adjust the above diagram in your business presentations to visually support your content.
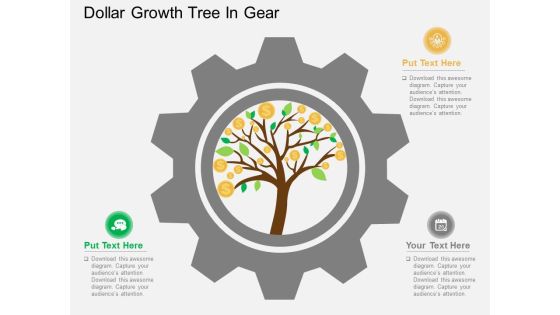
Dollar Growth Tree In Gear Powerpoint Templates
This PowerPoint slide has been designed with dollar growth tree. This diagram is designed to display financial growth planning. This professional slide helps in making an instant impact on viewers.
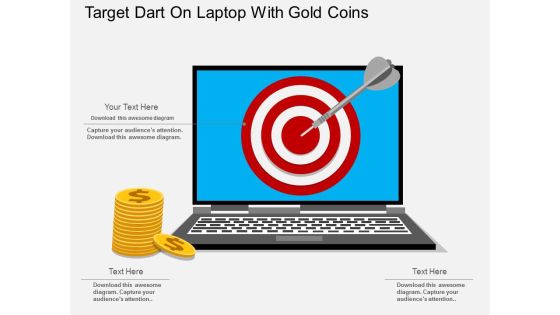
Target Dart On Laptop With Gold Coins Powerpoint Template
This business PowerPoint slide displays target dart on laptop with gold coins. This diagram is suitable for financial planning and target related topics. Download this PPT slide to make impressive presentations.

Business Man With Binocular For Profit Vision Powerpoint Template
This PPT slide has been designed with graphics of business man looking into binoculars. Download this diagram to portray concepts like financial planning. This slide is innovatively designed to highlight your worthy view.

Timeline Steps For Organizational Strategy Powerpoint Slides
This infographic timeline template can be used for multiple purposes including financial planning, new milestones and tasks. It contains organizational strategy timeline diagram. Download this PowerPoint timeline template to make impressive presentations.

Business Chart Arrows PowerPoint Templates And PowerPoint Themes 1012
Visually support your Microsoft office PPT Presentation with our above template illustrating a colored bar graph. This image has been professionally designed to emphasize the concept of financial analysis and statistics. This image has been conceived to enable you to emphatically communicate your ideas in your Business and Financial PPT presentations showing reports, ratings and reviews etc. Go ahead and add personality to your presentations with our stunning templates.
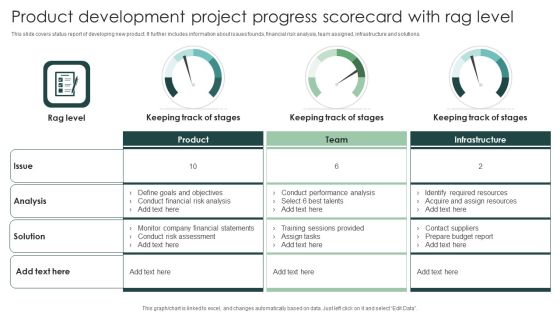
Product Development Project Progress Scorecard With Rag Level Themes PDF
This slide covers status report of developing new product. It further includes information about issues founds, financial risk analysis, team assigned, infrastructure and solutions. Showcasing this set of slides titled Product Development Project Progress Scorecard With Rag Level Themes PDF. The topics addressed in these templates are Conduct Financial, Prepare Budget Report, Assign Resources. All the content presented in this PPT design is completely editable. Download it and make adjustments in color, background, font etc. as per your unique business setting.
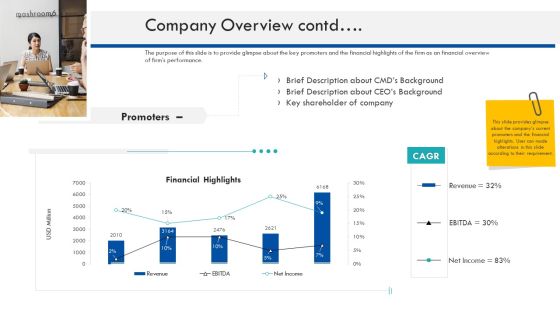
Enterprise Handbook Company Overview Contd Ppt Styles Themes PDF
The purpose of this slide is to provide glimpse about the key promoters and the financial highlights of the firm as an financial overview of firms performance. Deliver an awe inspiring pitch with this creative enterprise handbook company overview contd ppt styles themes pdf bundle. Topics like company overview contd can be discussed with this completely editable template. It is available for immediate download depending on the needs and requirements of the user.

Brief Description About Firm Assuring Food Quality And Hygiene Themes PDF
This slide provides information regarding the brief description about firm in terms of its history, financial highlights and firm offerings as food processing firm. Deliver and pitch your topic in the best possible manner with this brief description about firm assuring food quality and hygiene themes pdf. Use them to share invaluable insights on financial, lifestyle, health and wellness and impress your audience. This template can be altered and modified as per your expectations. So, grab it now.

Accounting Department Organizational Chart Ppt PowerPoint Presentation Pictures Graphics
Presenting this set of slides with name accounting department organizational chart ppt powerpoint presentation pictures graphics. This is a five stage process. The stages in this process are board of directors, chief executive officer, vice presidents, chief financial officer, controller, treasurer, internal auditor, managerial accountant, financial accountant, tax accountant. This is a completely editable PowerPoint presentation and is available for immediate download. Download now and impress your audience.

Logistics Dashboard For XYZ Logistic Company Orders Ppt Infographic Template Diagrams PDF
The slide shows the logistic measurement dashboard for measuring order status, total orders, overdue shipments, global financial performance etc. Deliver and pitch your topic in the best possible manner with this logistics dashboard for xyz logistic company orders ppt infographic template diagrams pdf. Use them to share invaluable insights on global financial performance, orders, inventory and impress your audience. This template can be altered and modified as per your expectations. So, grab it now.
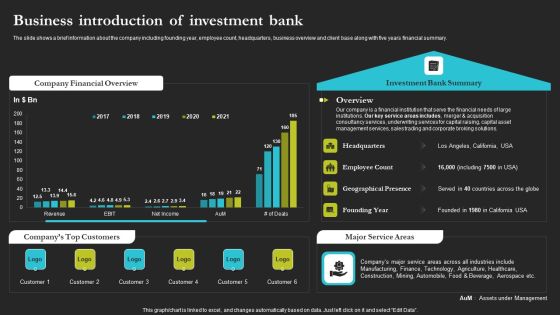
Sell Side Merger And Acquisition Business Introduction Of Investment Bank Diagrams PDF
The slide shows a brief information about the company including founding year, employee count, headquarters, business overview and client base along with five years financial summary. Deliver an awe inspiring pitch with this creative Sell Side Merger And Acquisition Business Introduction Of Investment Bank Diagrams PDF bundle. Topics like Company Financial Overview, Companys Top Customers, Major Service Areas can be discussed with this completely editable template. It is available for immediate download depending on the needs and requirements of the user.
