AI PPT Maker
Templates
PPT Bundles
Design Services
Business PPTs
Business Plan
Management
Strategy
Introduction PPT
Roadmap
Self Introduction
Timelines
Process
Marketing
Agenda
Technology
Medical
Startup Business Plan
Cyber Security
Dashboards
SWOT
Proposals
Education
Pitch Deck
Digital Marketing
KPIs
Project Management
Product Management
Artificial Intelligence
Target Market
Communication
Supply Chain
Google Slides
Research Services
 One Pagers
All Categories
-
Home
- Customer Favorites
- Financial Icons
Financial Icons

Bar Chart Ppt PowerPoint Presentation Inspiration Demonstration
This is a bar chart ppt powerpoint presentation inspiration demonstration. This is a two stage process. The stages in this process are bar chart, financial years, sales in percentage, product, finance.

Bar Chart Ppt PowerPoint Presentation Model Picture
This is a bar chart ppt powerpoint presentation model picture. This is a two stage process. The stages in this process are product, sales in percentage, financial years, bar chart.

Circle Diagram For Business Marketing Mix Powerpoint Slides
This PowerPoint template has been designed with nine steps circle chart. This PPT slide can be used to prepare presentations for profit growth report and also for financial data analysis. You can download finance PowerPoint template to prepare awesome presentations.

Four Options Circle Chart With Percentage Powerpoint Slides
This PowerPoint template has been designed with graphics of four options circle chart. This PowerPoint template may be used to display four steps of financial analysis. Prove the viability of your ideas using this impressive slide.

Bar Chart Ppt PowerPoint Presentation Slides Example File
This is a bar chart ppt powerpoint presentation slides example file. This is a two stage process. The stages in this process are product, financial years, sales in percentage.
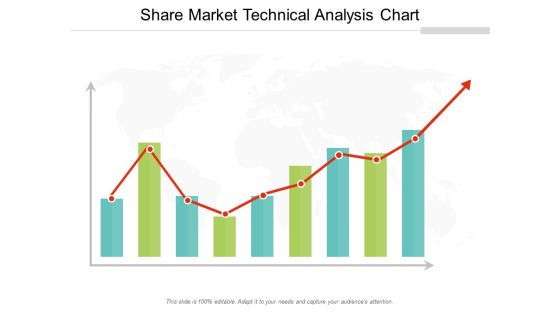
Share Market Technical Analysis Chart Ppt Powerpoint Presentation Professional Rules
This is a share market technical analysis chart ppt powerpoint presentation professional rules. This is a three stage process. The stages in this process are stock market, financial market, bull market.

Bar Graph For Marketing Research Data Powerpoint Slides
This PowerPoint template has been designed with diagram of bar graph. This PPT slide can be used to prepare presentations for profit growth report and also for financial data analysis. You can download finance PowerPoint template to prepare awesome presentations.

Bar Graph For Marketing Research Process Powerpoint Slides
This PowerPoint template has been designed with diagram of bar graph. This PPT slide can be used to prepare presentations for profit growth report and also for financial data analysis. You can download finance PowerPoint template to prepare awesome presentations.

Bar Chart Ppt PowerPoint Presentation Summary Themes
This is a bar chart ppt powerpoint presentation summary themes. This is a three stage process. The stages in this process are financial years, sales in percentage, business, marketing, graph.

Bar Chart Ppt PowerPoint Presentation Diagram Lists
This is a bar chart ppt powerpoint presentation diagram lists. This is a two stage process. The stages in this process are business, marketing, financial years, sales in percentage, graph.

Bar Chart Ppt PowerPoint Presentation Visual Aids Diagrams
This is a bar chart ppt powerpoint presentation visual aids diagrams. This is a two stage process. The stages in this process are business, marketing, financial years, sales in percentage, graph.

Area Chart Ppt PowerPoint Presentation Inspiration Professional
This is a area chart ppt powerpoint presentation inspiration professional. This is a two stage process. The stages in this process are financial year, in percentage, area chart, finance, business, marketing.

Area Chart Ppt PowerPoint Presentation Model Inspiration
This is a area chart ppt powerpoint presentation model inspiration. This is a two stage process. The stages in this process are financial year, in percentage, area chart, business, marketing.

Combo Chart Ppt PowerPoint Presentation Model Vector
This is a combo chart ppt powerpoint presentation model vector. This is a two stage process. The stages in this process are financial year, in percentage, business, marketing, combo chart.

Bar Chart Ppt PowerPoint Presentation Outline Introduction
This is a bar chart ppt powerpoint presentation outline introduction. This is a one stage process. The stages in this process are sales in percentage, product, business, financial years, graph.

Bar Chart Ppt PowerPoint Presentation Styles Outfit
This is a bar chart ppt powerpoint presentation styles outfit. This is a Seven stage process. The stages in this process are sales in percentage, financial years, graph, business.

Area Chart Ppt PowerPoint Presentation Layouts Maker
This is a area chart ppt powerpoint presentation layouts maker. This is a two stage process. The stages in this process are financial year, sales in percentage, graph, business, marketing.

Area Chart Ppt PowerPoint Presentation Summary Show
This is a area chart ppt powerpoint presentation summary show. This is a two stage process. The stages in this process are sales in percentage, financial year, business, marketing, finance.

area chart ppt powerpoint presentation professional elements
This is a area chart ppt powerpoint presentation professional elements. This is a two stage process. The stages in this process are financial year sales in percentage, business, marketing, graph.

Bar Chart Ppt PowerPoint Presentation File Slide
This is a bar chart ppt powerpoint presentation file slide. This is a one stage process. The stages in this process are sales in percentage financial years, business, marketing, strategy, graph.

Line Chart Ppt PowerPoint Presentation Outline Ideas
This is a line chart ppt powerpoint presentation outline ideas. This is a two stage process. The stages in this process are business, marketing, financial years, sales in percentage, strategy.

Column Chart Ppt PowerPoint Presentation Show Structure
This is a column chart ppt powerpoint presentation show structure. This is a two stage process. The stages in this process are business, financial year in, sales in percentage, marketing, graph.

Bar Chart Ppt PowerPoint Presentation Layouts Template
This is a bar chart ppt powerpoint presentation layouts template. This is a two stage process. The stages in this process are financial year, sales in percentage, business, marketing, finance.

Area Chart Ppt PowerPoint Presentation Model Demonstration
This is a area chart ppt powerpoint presentation model demonstration. This is a two stage process. The stages in this process are business, marketing, financial year, in percentage, graph.
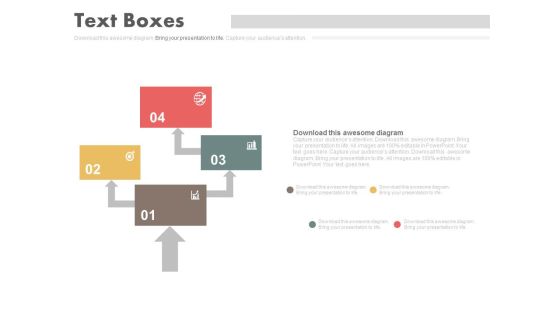
Four Steps Arrow Chart Design Powerpoint Slides
This PowerPoint template has been designed with four steps arrow chart. This PPT slide can be used to prepare presentations for marketing reports and also for financial data analysis. You can download finance PowerPoint template to prepare awesome presentations.

Bar Chart Ppt PowerPoint Presentation Outline Backgrounds
This is a bar chart ppt powerpoint presentation outline backgrounds. This is a one stage process. The stages in this process are sales in percentage, financial years, product, bar graph, finance.

Bar Chart Ppt PowerPoint Presentation Professional Graphics Download
This is a bar chart ppt powerpoint presentation professional graphics download. This is a seven stage process. The stages in this process are sales in percentage, financial years, chart, business.
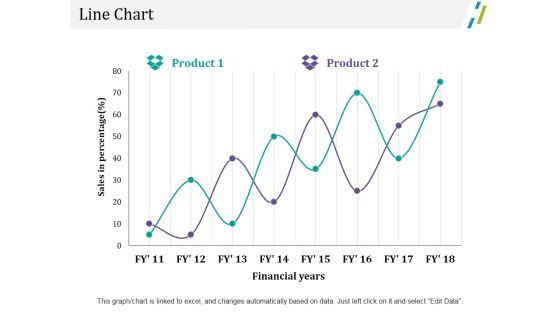
Line Chart Ppt PowerPoint Presentation Outline File Formats
This is a line chart ppt powerpoint presentation outline file formats. This is a two stage process. The stages in this process are business, marketing, sales in percentage, financial years, chart.
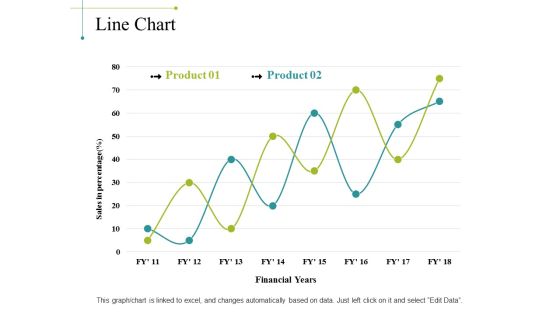
Line Chart Ppt PowerPoint Presentation Portfolio Background Image
This is a line chart ppt powerpoint presentation portfolio background image. This is a two stage process. The stages in this process are sales in percentage, financial years, chart, business, marketing, finance.

Clustered Column Chart Ppt PowerPoint Presentation Show Slideshow
This is a clustered column chart ppt powerpoint presentation show slideshow. This is a six stage process. The stages in this process are financial year in, sales in percentage, business, marketing, finance.

Bar Chart Ppt PowerPoint Presentation Summary File Formats
This is a bar chart ppt powerpoint presentation summary file formats. This is a two stage process. The stages in this process are business, finance, financial years, sales in percentage, graph.

Combo Chart Ppt PowerPoint Presentation Gallery Design Ideas
This is a combo chart ppt powerpoint presentation gallery design ideas. This is a three stage process. The stages in this process are business, financial years, sales in percentage, finance, graph.

Area Chart Ppt PowerPoint Presentation Outline Graphics Pictures
This is a area chart ppt powerpoint presentation outline graphics pictures. This is a two stage process. The stages in this process are financial year, in percentage, business, marketing, finance.

Combo Chart Ppt PowerPoint Presentation Summary Background Images
This is a combo chart ppt powerpoint presentation summary background images. This is a two stage process. The stages in this process are business, marketing, financial year, in percentage, graph.
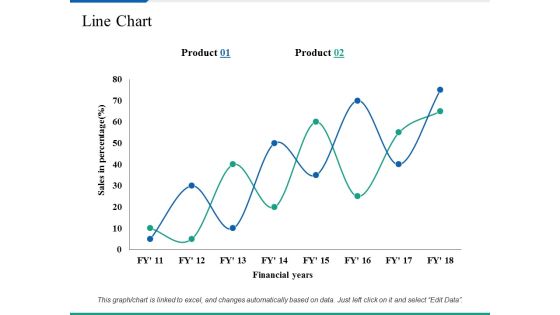
Line Chart Ppt PowerPoint Presentation Summary Clipart Images
This is a line chart ppt powerpoint presentation summary clipart images. This is a two stage process. The stages in this process are business, marketing, sales in percentage, financial years, strategy.

Bar Chart Ppt PowerPoint Presentation Pictures Background Image
This is a bar chart ppt powerpoint presentation pictures background image. This is a seven stage process. The stages in this process are financial years, sales in percentage, graph, business.

Area Chart Ppt PowerPoint Presentation Layouts Graphics Example
This is a area chart ppt powerpoint presentation layouts graphics example. This is a two stage process. The stages in this process are sales in percentage, financial year, business, marketing, presentation.
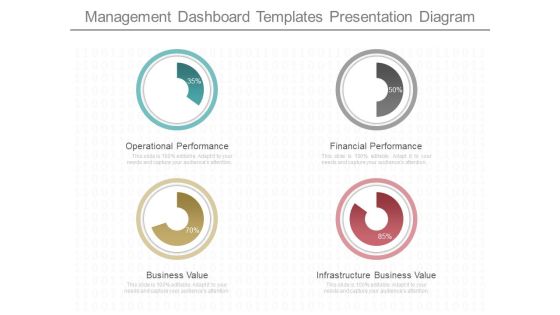
Management Dashboard Templates Presentation Diagram
This is a management dashboard templates presentation diagram. This is a four stage process. The stages in this process are operational performance, business value, financial performance, infrastructure business value.
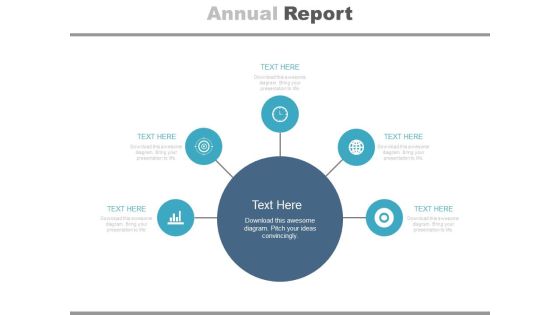
Diagram For Market Research Analysis Powerpoint Slides
This PowerPoint template has been designed with circular infographic diagram. It can be used to display steps for market research and also for financial data analysis. You can download finance PowerPoint template to prepare awesome presentations.
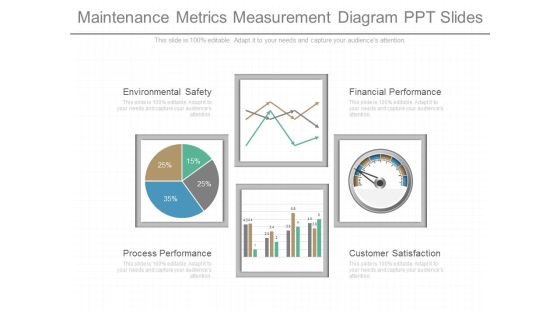
Maintenance Metrics Measurement Diagram Ppt Slides
This is a maintenance metrics measurement diagram ppt slides. This is a four stage process. The stages in this process are environmental safety, process performance, financial performance, customer satisfaction.
Six Staged Hub And Spokes Diagram Powerpoint Slides
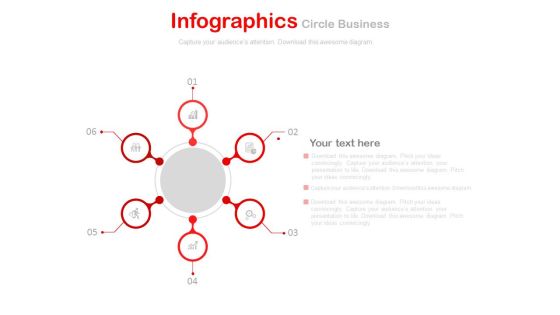
This PowerPoint template has been designed with circular hub and spokes diagram. This PPT slide can be used to display cycle of financial steps. You can download finance PowerPoint template to prepare awesome presentations.

Hourglass With Yen Currency Symbol Powerpoint Templates
Create dynamic presentations with our professional template containing graphics of hourglass with yen currency symbol. This diagram is useful for time management and financial planning. Download this template to leave permanent impression on your audience.

Clustered Column Ppt PowerPoint Presentation Ideas Graphic Tips
This is a clustered column ppt powerpoint presentation ideas graphic tips. This is a two stage process. The stages in this process are financial year, sales in percentage, product, graph, business.

Clustered Column Ppt PowerPoint Presentation Portfolio Smartart
This is a clustered column ppt powerpoint presentation portfolio smartart. This is a two stage process. The stages in this process are financial year, product, sales in percentage, finance, business, graph.

Clustered Column Ppt PowerPoint Presentation Pictures Mockup
This is a clustered column ppt powerpoint presentation pictures mockup. This is a two stage process. The stages in this process are product, sales in percentage, financial year, graph, business.

Executive Summary Ppt PowerPoint Presentation Professional Example
This is a executive summary ppt powerpoint presentation professional example. This is a four stage process. The stages in this process are background, capabilities, accreditation, promoters and shareholding, financial highlights.

Clustered Column Ppt PowerPoint Presentation Slides Smartart
This is a clustered column ppt powerpoint presentation slides smartart. This is a two stage process. The stages in this process are product, sales in percentage, financial year, bar graph.

Clustered Column Ppt PowerPoint Presentation File Graphics
This is a clustered column ppt powerpoint presentation file graphics. This is a two stage process. The stages in this process are product, financial year, sales in percentage, graph, growth.

Clustered Column Ppt PowerPoint Presentation Show Graphics
This is a clustered column ppt powerpoint presentation show graphics. This is a two stage process. The stages in this process are financial year, sales in percentage, business, marketing, graph.

Cash Flow Statement Kpis Template 2 Ppt PowerPoint Presentation Layouts Visuals
This is a cash flow statement kpis template 2 ppt powerpoint presentation layouts visuals. This is a four stage process. The stages in this process are operations, financial activities, investing activities, net increase in cash.

Cash Flow Statement Kpis Tabular Form Ppt PowerPoint Presentation Summary Elements
This is a cash flow statement kpis tabular form ppt powerpoint presentation summary elements. This is a four stage process. The stages in this process are net increase cash, financial activities, operations, investing activities.

Clustered Column Ppt PowerPoint Presentation Gallery Format
This is a clustered column ppt powerpoint presentation gallery format. This is a two stage process. The stages in this process are business, marketing, graph, financial year, sales in percentage.

Three Tags With Magnifier For Competitive Advantages Powerpoint Slides
This PowerPoint template has been designed with diagram of three tags with magnifier. This PPT slide can be used to prepare presentations for financial planning. You can download finance PowerPoint template to prepare awesome presentations.

Bar Chart Ppt PowerPoint Presentation Professional Files
This is a bar chart ppt powerpoint presentation professional files. This is a seven stage process. The stages in this process are bar chart, product, sales in percentage, financial years.
Line Chart Ppt PowerPoint Presentation Infographic Template Introduction
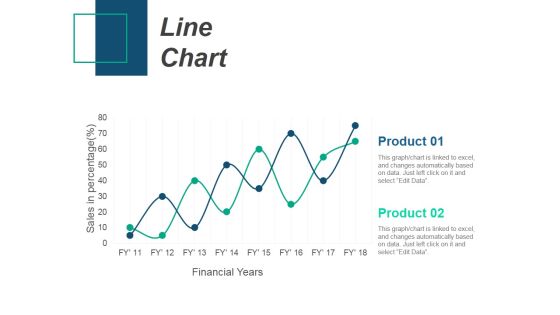
This is a line chart ppt powerpoint presentation infographic template introduction. This is a two stage process. The stages in this process are product, sales in percentage, financial years, line chart.

Human Hand Holding Dollar Note Powerpoint Templates
Use this PowerPoint template, in your corporate presentations. It contains graphics of human hand holding dollar note. This slide is 100 percent editable. This business slide may be used to exhibit financial planning. Make wonderful presentations using this diagram.
Man On Dollar Stack With Ladder Powerpoint Template
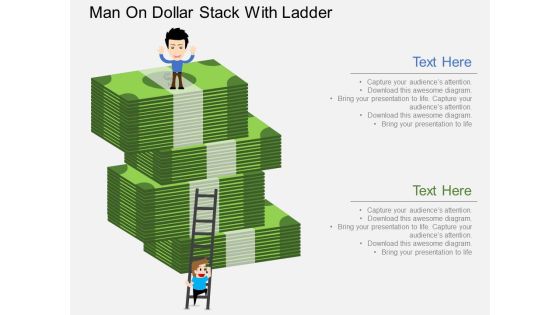
This PowerPoint template has been designed with man on dollar stack with ladder. This diagram is excellent visual tools to present financial progress. Download this PPT slide to explain complex information immediately and clearly.
Essential Components Of Three Step Dupont Analysis Model Diagrams PDF
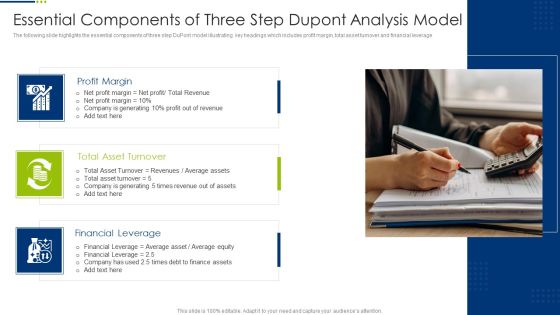
The following slide highlights the essential components of three step DuPont model illustrating key headings which includes profit margin, total asset turnover and financial leverage. Presenting Essential Components Of Three Step Dupont Analysis Model Diagrams PDF to dispense important information. This template comprises three stages. It also presents valuable insights into the topics including Profit Margin, Total Asset Turnover, Financial Leverage. This is a completely customizable PowerPoint theme that can be put to use immediately. So, download it and address the topic impactfully.

Circles With Percentage Values Powerpoint Templates
This PowerPoint template displays circles with percentage values. This business diagram is suitable for financial data analysis. Use this business diagram slide to highlight the key issues of your presentation.

Clustered Column Line Ppt PowerPoint Presentation Model Rules
This is a clustered column line ppt powerpoint presentation model rules. This is a four stage process. The stages in this process are financial year, sales in percentage, business, marketing, growth, graph.
