Financial Graphs
Icon Of BCWP Graph For Project Management Topics PDF
Persuade your audience using this Icon Of BCWP Graph For Project Management Topics PDF This PPT design covers one stage, thus making it a great tool to use. It also caters to a variety of topics including Icon BCWP, Graph Project, Management Download this PPT design now to present a convincing pitch that not only emphasizes the topic but also showcases your presentation skills.

Doughnut Graph Icon Highlighting IT Team Structure Structure PDF
Presenting Doughnut Graph Icon Highlighting IT Team Structure Structure PDF to dispense important information. This template comprises four stages. It also presents valuable insights into the topics including Doughnut Graph, Icon Highlighting, IT Team Structure. This is a completely customizable PowerPoint theme that can be put to use immediately. So, download it and address the topic impactfully.

Doughnut Graph Icon With Dollar Symbol Topics PDF
Persuade your audience using this Doughnut Graph Icon With Dollar Symbol Topics PDF. This PPT design covers four stages, thus making it a great tool to use. It also caters to a variety of topics including Doughnut Graph, Icon, Dollar Symbol. Download this PPT design now to present a convincing pitch that not only emphasizes the topic but also showcases your presentation skills.

Cost For Quality Graph Ppt PowerPoint Presentation Ideas Files
This is a cost for quality graph ppt powerpoint presentation ideas files. This is a four stage process. The stages in this process are external failure, internal failure, prevention, appraisal, quality improvement.

Bar Graph For Business Growth Steps Powerpoint Slides
This PowerPoint template contains design of bar graph with icons. You may download this slide to display strategy steps for business growth. You can easily customize this template to make it more unique as per your need.

Bar Graph With Line Chart For Analysis Powerpoint Slides
This PowerPoint template contains design of bar graph with line chart. You may download this slide to display strategy steps for business growth. You can easily customize this template to make it more unique as per your need.

Bar Graph With Yearly Statistical Analysis Powerpoint Slides
This PowerPoint template contains diagram of bar graph with yearly percentage ratios. You may download this slide to display statistical analysis. You can easily customize this template to make it more unique as per your need.
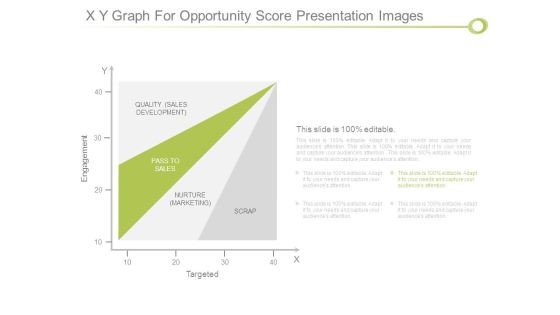
X Y Graph For Opportunity Score Presentation Images
This is a x y graph for opportunity score presentation images. This is a one stage process. The stages in this process are engagement, quality sales development, pass to sales, nurture marketing, scrap, targeted.

Clustered Column Graph Finance Investment Ppt PowerPoint Presentation Outline Icons
This is a clustered column graph finance investment ppt powerpoint presentation outline icons. This is a three stage process. The stages in this process are finance, investment, business, marketing, analysis.

Clustered Bar Graph Ppt PowerPoint Presentation Pictures Example File
This is a clustered bar graph ppt powerpoint presentation pictures example file. This is a two stage process. The stages in this process are finance, marketing, management, investment, analysis.

Bar Graph Finance Ppt PowerPoint Presentation Infographics Designs Download
This is a bar graph finance ppt powerpoint presentation infographics designs download. This is a three stage process. The stages in this process are finance, marketing, management, investment, analysis.

Bar Graph Employee Value Proposition Ppt PowerPoint Presentation File Layout
This is a bar graph employee value proposition ppt powerpoint presentation file layout. This is a three stage process. The stages in this process are business, management, strategy, analysis, marketing.

Commodities Exchange Basics Ppt Powerpoint Presentation Diagram Graph Charts
This is a commodities exchange basics ppt powerpoint presentation diagram graph charts. This is a four stage process. The stages in this process are finance, marketing, management, investment, analysis.

Bar Graph Marketing Process Ppt PowerPoint Presentation Ideas Example Introduction
This is a bar graph marketing process ppt powerpoint presentation ideas example introduction. This is a three stage process. The stages in this process are finance, management, strategy, analysis, marketing.

Column Chart And Graph Ppt PowerPoint Presentation File Introduction
This is a column chart and graph ppt powerpoint presentation file introduction. This is a three stage process. The stages in this process are finance, marketing, management, investment, analysis.

Scatter Bubble Chart Graph Ppt PowerPoint Presentation Infographic Template Maker
This is a scatter bubble chart graph ppt powerpoint presentation infographic template maker. This is a two stage process. The stages in this process are finance, marketing, management, investment, analysis.

Donut Pie Chart Graph Ppt PowerPoint Presentation File Styles
This is a donut pie chart graph ppt powerpoint presentation file styles. This is a three stage process. The stages in this process are finance, marketing, management, investment, analysis.

Stacked Bar Graph Ppt PowerPoint Presentation Portfolio Slide Portrait
This is a stacked bar graph ppt powerpoint presentation portfolio slide portrait. This is a three stage process. The stages in this process are finance, marketing, management, investment, analysis.

Clustered Bar Graph Ppt PowerPoint Presentation Model Background Designs
This is a clustered bar graph ppt powerpoint presentation model background designs. This is a three stage process. The stages in this process are finance, marketing, management, investment, analysis.

Donut Pie Chart Graph Ppt PowerPoint Presentation Ideas Guidelines
This is a donut pie chart graph ppt powerpoint presentation ideas guidelines. This is a three stage process. The stages in this process are finance, marketing, management, investment, analysis.

Clustered Column Line Graph Ppt PowerPoint Presentation File Clipart
This is a clustered column line graph ppt powerpoint presentation file clipart. This is a three stage process. The stages in this process are finance, marketing, management, investment, analysis.

Combo Chart Graph Ppt PowerPoint Presentation Infographic Template Layout Ideas
This is a combo chart graph ppt powerpoint presentation infographic template layout ideas. This is a three stage process. The stages in this process are finance, marketing, analysis, investment, million.

Clustered Column Line Graph Ppt PowerPoint Presentation Inspiration Deck
This is a clustered column line graph ppt powerpoint presentation inspiration deck. This is a three stage process. The stages in this process are finance, marketing, analysis, investment, million.
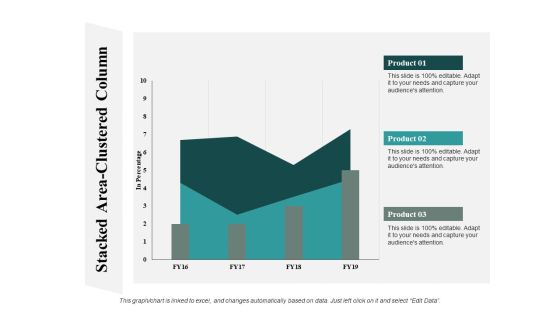
Stacked Area Clustered Column Graph Ppt PowerPoint Presentation Summary Guide
This is a stacked area clustered column graph ppt powerpoint presentation summary guide. This is a three stage process. The stages in this process are finance, marketing, analysis, investment, million.

Combo Chart Graph Ppt PowerPoint Presentation Gallery Designs Download
This is a combo chart graph ppt powerpoint presentation gallery designs download. This is a three stage process. The stages in this process are finance, marketing, analysis, investment, million.

Area Chart Graph Ppt PowerPoint Presentation Professional Format Ideas
This is a column chart graph ppt powerpoint presentation slides file formats. This is a stage three process. The stages in this process are finance, marketing, analysis, investment, million.
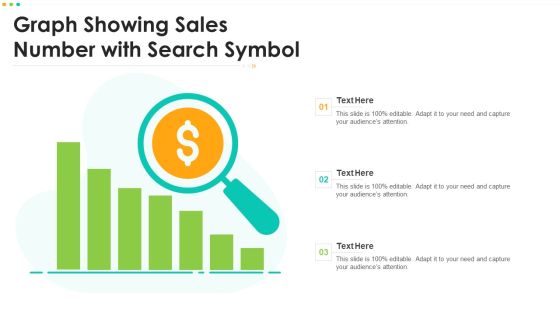
Graph Showing Sales Number With Search Symbol Professional PDF
Persuade your audience using this Graph Showing Sales Number With Search Symbol Professional PDF. This PPT design covers three stages, thus making it a great tool to use. It also caters to a variety of topics including Graph Showing Sales Number With Search Symbol. Download this PPT design now to present a convincing pitch that not only emphasizes the topic but also showcases your presentation skills.
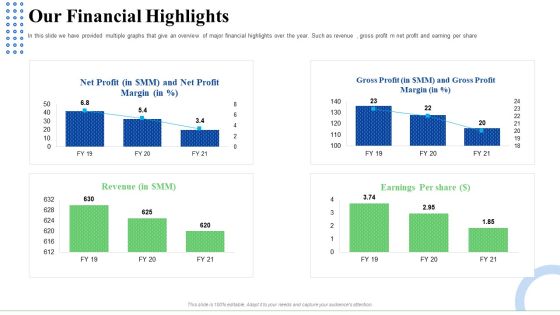
Strategic Plan For Business Expansion And Growth Our Financial Highlights Mockup PDF
In this slide we have provided multiple graphs that give an overview of major financial highlights over the year. Such as revenue , gross profit m net profit and earning per share. Deliver an awe inspiring pitch with this creative strategic plan for business expansion and growth our financial highlights mockup pdf bundle. Topics like revenue, gross profit, net profit can be discussed with this completely editable template. It is available for immediate download depending on the needs and requirements of the user.

Tactical Planning For Marketing And Commercial Advancement Our Financial Highlights Download PDF
In this slide we have provided multiple graphs that give an overview of major financial highlights over the year. Such as revenue , gross profit m net profit and earning per share. Deliver an awe inspiring pitch with this creative tactical planning for marketing and commercial advancement our financial highlights download pdf bundle. Topics like revenue, gross profit, net profit can be discussed with this completely editable template. It is available for immediate download depending on the needs and requirements of the user.
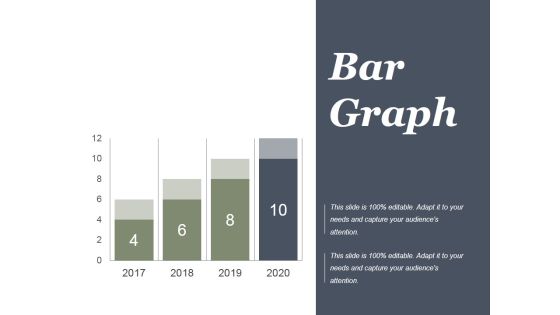
Project Performance Bar Graph Ppt PowerPoint Presentation Outline
This is a project performance bar graph ppt powerpoint presentation outline. This is a four stage process. The stages in this process are finance, year, business, marketing, future, marketing.

Column Chart Graph Ppt PowerPoint Presentation Slides File Formats
This is a combo chart bar ppt powerpoint presentation slides portfolio. This is a three stage process. The stages in this process are finance, marketing, analysis, investment, million.

Growth Arrow On Bar Graph Infographics Powerpoint Template
This PowerPoint template has been designed with growth arrow on bar graph. You may download this diagram slide to display growth and progress concepts. Illustrate your plans to your listeners with this impressive template.

Images Of Business People 3d Men With Bar Graph Making Effort PowerPoint Templates
We present our images of business people 3d men with bar graph making effort PowerPoint templates.Use our People PowerPoint Templates because You canTake a leap off the starting blocks with our PowerPoint Templates and Slides. They will put you ahead of the competition in quick time. Present our Business PowerPoint Templates because our PowerPoint Templates and Slides are the string of your bow. Fire of your ideas and conquer the podium. Use our Marketing PowerPoint Templates because They will Put the wind in your sails. Skim smoothly over the choppy waters of the market. Use our Teamwork PowerPoint Templates because Our PowerPoint Templates and Slides will steer your racing mind. Hit the right buttons and spur on your audience. Download and present our Shapes PowerPoint Templates because Our PowerPoint Templates and Slides will let you Hit the target. Go the full distance with ease and elan.Use these PowerPoint slides for presentations relating to 3d, abstract, accounting, achievement, bar graph, business, cartoon, concept, financial, goal, gold, golden, graph, growth, help, icon, lifting, bar, market, meeting, men, partnership, people, presentation, profits, progress, report, strength, team, teamwork. The prominent colors used in the PowerPoint template are Green, Blue, White.
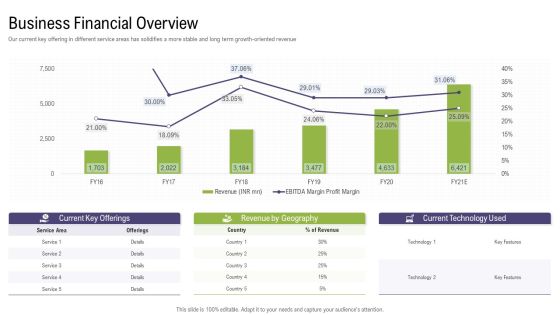
Mergers And Acquisitions Synergy Business Financial Overview Template PDF
Deliver an awe-inspiring pitch with this creative mergers and acquisitions synergy business financial overview template pdf. bundle. Topics like current key offerings, current key offerings, current technology used can be discussed with this completely editable template. It is available for immediate download depending on the needs and requirements of the user.
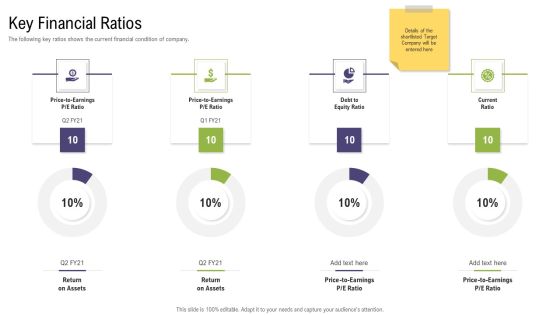
Mergers And Acquisitions Synergy Key Financial Ratios Designs PDF
Deliver and pitch your topic in the best possible manner with this mergers and acquisitions synergy key financial ratios designs pdf. Use them to share invaluable insights on Price to earnings p or e ratio debt to, equity ratio, current ratio, return on assets, return on assets and impress your audience. This template can be altered and modified as per your expectations. So, grab it now.

Financial Growth Business PowerPoint Templates And PowerPoint Backgrounds 0711
Microsoft PowerPoint Template and Background with finance graph depicting growth

Annual Financial Data Insights Dashboard Icon Introduction PDF
Showcasing this set of slides titled Annual Financial Data Insights Dashboard Icon Introduction PDF. The topics addressed in these templates are Annual Financial, Data Insights, Dashboard. All the content presented in this PPT design is completely editable. Download it and make adjustments in color, background, font etc. as per your unique business setting.

Annual Financial Data With KPI Insights Dashboard Structure PDF
The following slides highlights the financial kpas in summarized form to evaluate companys annual operating performance. It includes metrics such as gross, operating and net profit margin, income statement, target versus actual EBIT etc. Pitch your topic with ease and precision using this Annual Financial Data With KPI Insights Dashboard Structure PDF. This layout presents information on Gross Profit Margin, Operating Profit Margin, Net Profit Margin. It is also available for immediate download and adjustment. So, changes can be made in the color, design, graphics or any other component to create a unique layout.
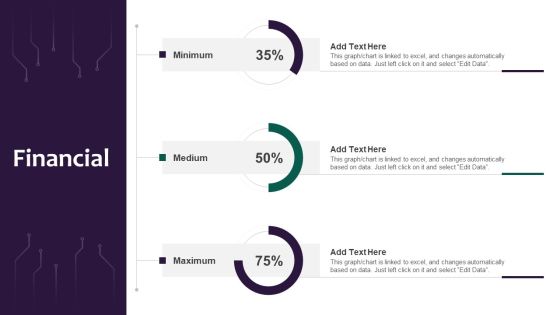
Information Systems Security And Risk Management Plan Financial Professional PDF
Crafting an eye catching presentation has never been more straightforward. Let your presentation shine with this tasteful yet straightforward Information Systems Security And Risk Management Plan Financial Professional PDF template. It offers a minimalistic and classy look that is great for making a statement. The colors have been employed intelligently to add a bit of playfulness while still remaining professional. Construct the ideal Information Systems Security And Risk Management Plan Financial Professional PDF that effortlessly grabs the attention of your audience Begin now and be certain to wow your customers.

Post Implementation Other Operation And Financial Kpis Summary PDF
The slide provides five years graphs 2022F to 2026F forecasted number of major KPIs key performance indicators, that might help to track the performance of ABC Railway. Covered KPIs include Revenue, Total Passengers, operating income, customer satisfaction rate etc.Deliver and pitch your topic in the best possible manner with this post implementation other operation and financial KPIs summary pdf. Use them to share invaluable insights on total passengers, operating income, revenue, 2022 to 2026 and impress your audience. This template can be altered and modified as per your expectations. So, grab it now.

Post Implementation Other Operation And Financial Kpis Inspiration PDF
The slide provides five years graphs 2022F-2026F forecasted number of major KPIs key performance indicators, that might help to track the performance of ABC Railway. Covered KPIs include Revenue, Total Passengers, operating income, customer satisfaction rate etc. Deliver and pitch your topic in the best possible manner with this post implementation other operation and financial kpis inspiration pdf. Use them to share invaluable insights on revenue, operating income, customer satisfaction and impress your audience. This template can be altered and modified as per your expectations. So, grab it now.
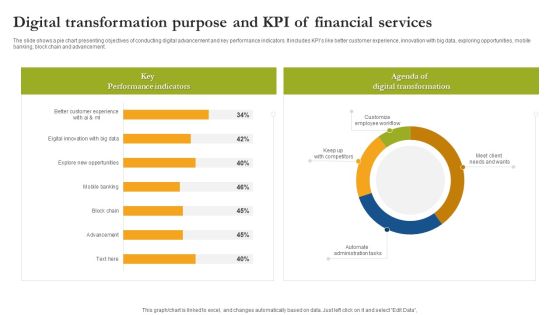
Digital Transformation Purpose And Kpi Of Financial Services Guidelines PDF
The slide shows a pie chart presenting objectives of conducting digital advancement and key performance indicators. It includes KPIs like better customer experience, innovation with big data, exploring opportunities, mobile banking, block chain and advancement. Showcasing this set of slides titled Digital Transformation Purpose And Kpi Of Financial Services Guidelines PDF. The topics addressed in these templates are Key Performance Indicators Digital Transformation, Customize Employee Workflow. All the content presented in this PPT design is completely editable. Download it and make adjustments in color, background, font etc. as per your unique business setting.

Graph Depicting Sales Representative Contribution To Revenue Growth Graphics PDF
Showcasing this set of slides titled Graph Depicting Sales Representative Contribution To Revenue Growth Graphics PDF. The topics addressed in these templates are Graph Depicting Sales, Revenue Growth. All the content presented in this PPT design is completely editable. Download it and make adjustments in color, background, font etc. as per your unique business setting.

Graph Representing Revenue Growth In B2b Sales Background PDF
Pitch your topic with ease and precision using this Graph Representing Revenue Growth In B2b Sales Background PDF. This layout presents information on Graph Representing, Revenue Growth, Sales. It is also available for immediate download and adjustment. So, changes can be made in the color, design, graphics or any other component to create a unique layout.
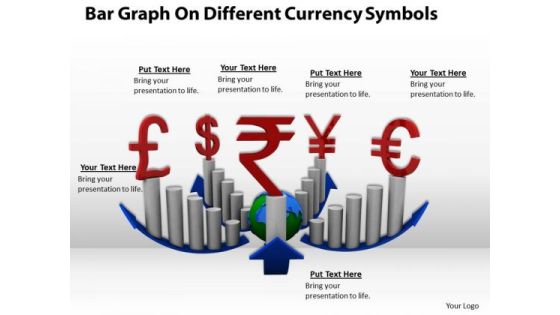
Stock Photo Bar Graph For Currency And Finance PowerPoint Slide
This image slide displays bar graphs with different currency symbols. This image has been designed with graphic of bar graphs, blue colored growth arrow and symbols of different currencies. Use this image slide, in your presentations to express views on finance, growth and achievements. This image slide may also be used to exhibit finance accounts in your presentations. This image slide will enhance the quality of your presentations.
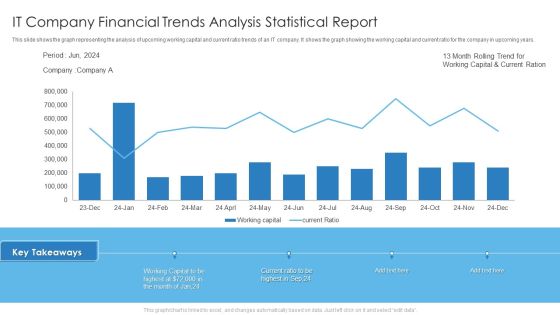
IT Company Financial Trends Analysis Statistical Report Slides PDF
This slide shows the graph representing the analysis of upcoming working capital and current ratio trends of an IT company. It shows the graph showing the working capital and current ratio for the company in upcoming years. Deliver and pitch your topic in the best possible manner with this IT Company Financial Trends Analysis Statistical Report Slides PDF. Use them to share invaluable insights on It Company Financial, Trends Analysis Statistical Report and impress your audience. This template can be altered and modified as per your expectations. So, grab it now.

Inventory Turnover Financial Ratios Chart Conversion Portrait PDF
This slide illustrates graph for inventory turnover ratio that can help company to analyze efficiency of inventory management. It showcases ratio graph comparison of 4 companies for a period of last 6 years Pitch your topic with ease and precision using this inventory turnover financial ratios chart conversion portrait pdf. This layout presents information on inventory turnover financial ratios chart conversion. It is also available for immediate download and adjustment. So, changes can be made in the color, design, graphics or any other component to create a unique layout.

Business Financial Highlights For Planning And Forecasting Background PDF
The slide shows bar graph showing actual and forecasted revenue, expenses and net profit of a company for various financial years. It is done to effectively conduct financial and investment planning for business growth and sustainability. Pitch your topic with ease and precision using this Business Financial Highlights For Planning And Forecasting Background PDF. This layout presents information on Revenue, Expenses And Costs, Net Profit. It is also available for immediate download and adjustment. So, changes can be made in the color, design, graphics or any other component to create a unique layout.

Fixed Asset Turnover Financial Ratios Comparison Chart Structure PDF
This slide showcases graph for fixed asset turnover ratio that can help to identify how efficiently a company is a generating sales with its machinery and equipment. It showcases comparison of ratio of three companies for a period of 5 financial years Showcasing this set of slides titled fixed asset turnover financial ratios comparison chart structure pdf. The topics addressed in these templates are fixed asset turnover financial ratios comparison chart. All the content presented in this PPT design is completely editable. Download it and make adjustments in color, background, font etc. as per your unique business setting.

Brand Revenue Comparative Analysis Graph With Key Insights Inspiration PDF
This slide illustrates graphical representation of sales revenue of three brands. It includes insights and facts and figures of these brands.Showcasing this set of slides titled Brand Revenue Comparative Analysis Graph With Key Insights Inspiration PDF. The topics addressed in these templates are Brand Revenue Comparative Analysis Graph With Key Insights. All the content presented in this PPT design is completely editable. Download it and make adjustments in color, background, font etc. as per your unique business setting.

Analytical Incrementalism Monthly Financial Analysis Of Our Company Slides PDF
The graph provides a glimpse of the companys revenue, operating profit and productivity for 12 months. Deliver an awe-inspiring pitch with this creative analytical incrementalism monthly financial analysis of our company slides pdf bundle. Topics like operating profit, productivity, revenue can be discussed with this completely editable template. It is available for immediate download depending on the needs and requirements of the user.

Annual Graph For Human Resource Recruitment Trends Summary PDF
The slide shows the HR recruitment trend graph from year 2018 to 2022. It includes number of employees hired per year along with key takeaways. Pitch your topic with ease and precision using this Annual Graph For Human Resource Recruitment Trends Summary PDF. This layout presents information on Employee Recruitment, Rise Employee, Economic Reforms. It is also available for immediate download and adjustment. So, changes can be made in the color, design, graphics or any other component to create a unique layout.
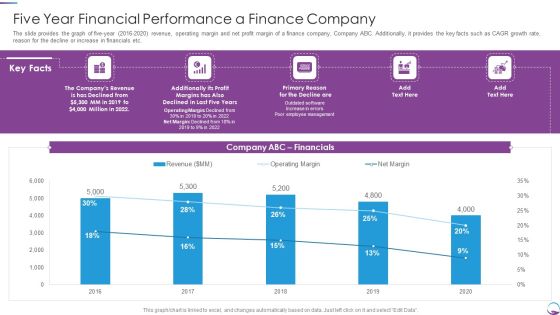
Five Year Financial Performance A Finance Company Slides PDF
The slide provides the graph of five year 2016 to 2020 revenue, operating margin and net profit margin of a finance company, Company ABC. Additionally, it provides the key facts such as CAGR growth rate, reason for the decline or increase in financials etc. Deliver and pitch your topic in the best possible manner with this Five Year Financial Performance A Finance Company Slides PDF. Use them to share invaluable insights on Five Year Financial Performance A Finance Company and impress your audience. This template can be altered and modified as per your expectations. So, grab it now.

Bioprocessing Company Venture Capitalist Presentation Addressing Financial Projections Infographics PDF
This slide caters details about financial projections of biotech platform in terms of total test performed, total revenues, total royalties, along with financial assumptions.Deliver and pitch your topic in the best possible manner with this bioprocessing company venture capitalist presentation addressing financial projections infographics pdf Use them to share invaluable insights on addressing financial projections of biotech platform and impress your audience. This template can be altered and modified as per your expectations. So, grab it now.
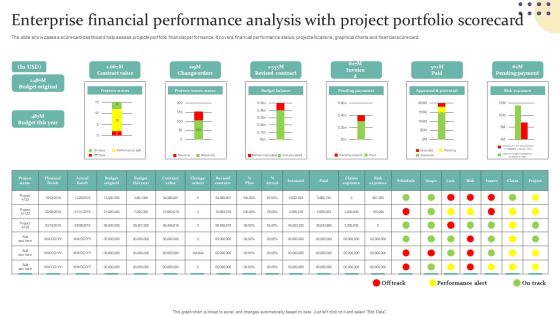
Enterprise Financial Performance Analysis With Project Portfolio Scorecard Guidelines PDF
The slide showcases a scorecard dashboard help assess projects portfolio financial performance. It covers financial performance status, projects locations, graphical charts and financial scorecard. Showcasing this set of slides titled Enterprise Financial Performance Analysis With Project Portfolio Scorecard Guidelines PDF. The topics addressed in these templates are Projects Status, Projects Issues Status, Budget Balance. All the content presented in this PPT design is completely editable. Download it and make adjustments in color, background, font etc. as per your unique business setting.
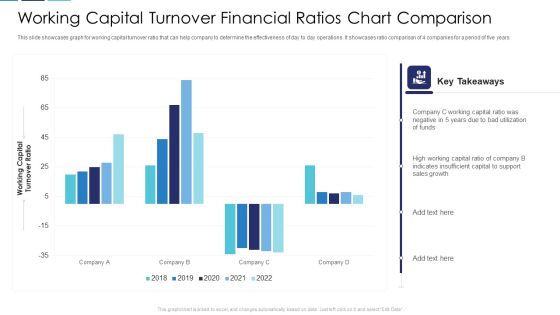
Working Capital Turnover Financial Ratios Chart Comparison Clipart PDF
This slide showcases graph for working capital turnover ratio that can help company to determine the effectiveness of day to day operations. It showcases ratio comparison of 4 companies for a period of five years Pitch your topic with ease and precision using this working capital turnover financial ratios chart comparison clipart pdf. This layout presents information on working capital turnover financial ratios chart comparison. It is also available for immediate download and adjustment. So, changes can be made in the color, design, graphics or any other component to create a unique layout.

Cab Aggregator Services Investor Capital Funding Financial Highlights Introduction PDF
This slide provides the glimpse about the financial highlights which focuses on sales, gross margin, net profit, etc. Deliver an awe inspiring pitch with this creative cab aggregator services investor capital funding financial highlights introduction pdf bundle. Topics like financial highlights can be discussed with this completely editable template. It is available for immediate download depending on the needs and requirements of the user.

Cab Aggregator Venture Capital Funding Financial Highlights Elements PDF
This slide provides the glimpse about the financial highlights which focuses on sales, gross margin, net profit, etc. Deliver an awe inspiring pitch with this creative cab aggregator venture capital funding financial highlights elements pdf bundle. Topics like financial highlights can be discussed with this completely editable template. It is available for immediate download depending on the needs and requirements of the user.
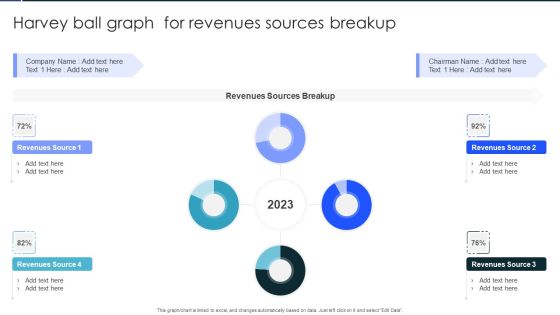
Harvey Ball Graph For Revenues Sources Breakup Infographics PDF
Showcasing this set of slides titled Harvey Ball Graph For Revenues Sources Breakup Infographics PDF. The topics addressed in these templates are Revenues Sources Breakup, Revenues, Sources Breakup. All the content presented in this PPT design is completely editable. Download it and make adjustments in color, background, font etc. as per your unique business setting.

Product Performance Comparison Graph Showing Revenue Growth Portrait PDF
Showcasing this set of slides titled Product Performance Comparison Graph Showing Revenue Growth Portrait PDF. The topics addressed in these templates are Sales Revenue, Product. All the content presented in this PPT design is completely editable. Download it and make adjustments in color, background, font etc. as per your unique business setting.

Company Turnover Financial Ratios Chart Comparison Icons PDF
This slide illustrates graph for turnover ratios that are accounts receivable, inventory turnover, accounts payable turnover, fixed asset turnover and total assets turnover ratio. It showcases comparison of three companies. Pitch your topic with ease and precision using this company turnover financial ratios chart comparison icons pdf. This layout presents information on company turnover financial ratios chart comparison. It is also available for immediate download and adjustment. So, changes can be made in the color, design, graphics or any other component to create a unique layout.

Dividend Payout Financial Ratios Chart Comparison Themes PDF
This slide showcases dividend payout ratio graph that can help organization to determine the percentage of the companys earnings that is paid out to shareholders by way of dividend. It showcases comparison for a period of 8 years Showcasing this set of slides titled dividend payout financial ratios chart comparison themes pdf. The topics addressed in these templates are dividend payout financial ratios chart comparison. All the content presented in this PPT design is completely editable. Download it and make adjustments in color, background, font etc. as per your unique business setting.

Price To Earning Financial Ratios Chart Comparison Slides PDF
This slide illustrates P or E ratio graph that can help company to measures its current share price relative to its per-share earnings. It showcases comparison for last 5 years Showcasing this set of slides titled price to earning financial ratios chart comparison slides pdf. The topics addressed in these templates are price to earning financial ratios chart comparison. All the content presented in this PPT design is completely editable. Download it and make adjustments in color, background, font etc. as per your unique business setting.
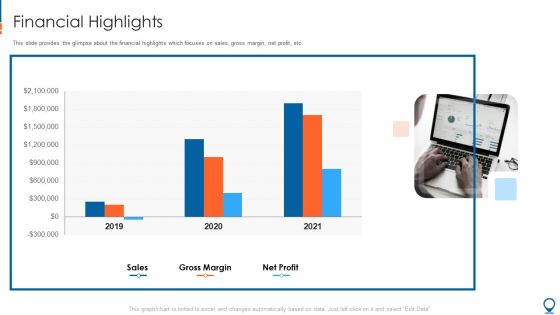
Ride Hailing Pitch Deck For Fundraising Financial Highlights Background PDF
This slide provides the glimpse about the financial highlights which focuses on sales, gross margin, net profit, etc. Deliver an awe inspiring pitch with this creative ride hailing pitch deck for fundraising financial highlights background pdf bundle. Topics like financial highlights can be discussed with this completely editable template. It is available for immediate download depending on the needs and requirements of the user.

Business Graph Money PowerPoint Templates And PowerPoint Themes 0712
Business Graph Money PowerPoint Templates And PowerPoint Themes 0712-Microsoft Powerpoint Templates and Background with business graph
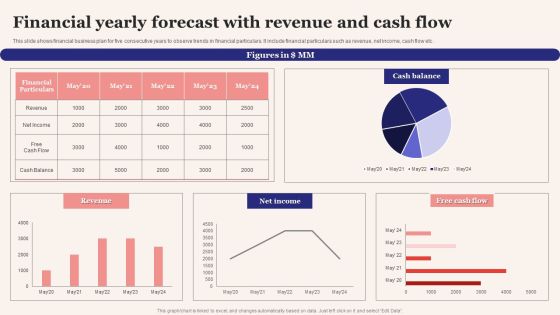
Financial Yearly Forecast With Revenue And Cash Flow Formats PDF
This slide shows financial business plan for five consecutive years to observe trends in financial particulars. It include financial particulars such as revenue, net income, cash flow etc. Pitch your topic with ease and precision using this Financial Yearly Forecast With Revenue And Cash Flow Formats PDF. This layout presents information on Financial Particulars, Cash Balance, Free Cash Flow. It is also available for immediate download and adjustment. So, changes can be made in the color, design, graphics or any other component to create a unique layout.

Stack Of Coins Profit Growth Graph PowerPoint Templates Ppt Backgrounds For Slides 0213
We present our Stack Of Coins Profit Growth Graph PowerPoint Templates PPT Backgrounds For Slides 0213.Present our Marketing PowerPoint Templates because Our PowerPoint Templates and Slides will fulfill your every need. Use them and effectively satisfy the desires of your audience. Download our Finance PowerPoint Templates because It will Raise the bar of your Thoughts. They are programmed to take you to the next level. Download our Business PowerPoint Templates because Our PowerPoint Templates and Slides are endowed to endure. Ideas conveyed through them will pass the test of time. Use our Success PowerPoint Templates because Our PowerPoint Templates and Slides will provide you a launch platform. Give a lift off to your ideas and send them into orbit. Download our Arrows PowerPoint Templates because Our PowerPoint Templates and Slides are created by a hardworking bunch of busybees. Always flitting around with solutions gauranteed to please.Use these PowerPoint slides for presentations relating to Financial success concept, graph with coins, finance, arrows, success, business, marketing. The prominent colors used in the PowerPoint template are Yellow, Red, White.
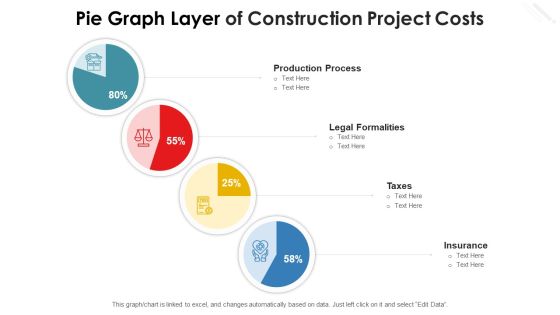
Pie Graph Layer Of Construction Project Costs Diagrams PDF
Showcasing this set of slides titled pie graph layer of construction project costs diagrams pdf. The topics addressed in these templates are production process, taxes, legal formalities, insurance. All the content presented in this PPT design is completely editable. Download it and make adjustments in color, background, font etc. as per your unique business setting.
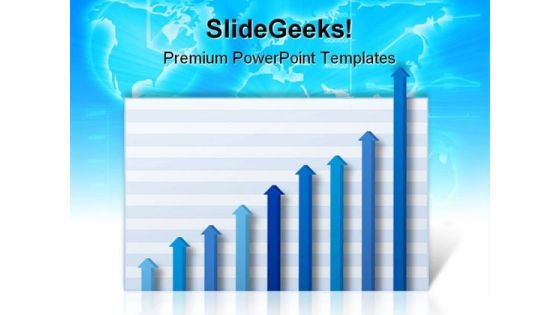
Business Graph Money PowerPoint Templates And PowerPoint Backgrounds 0511
Microsoft PowerPoint Template and Background with business graph with profits rising off the chart graph

Healthcare Financial Analysis Scorecard With Country Revenue Ppt Layouts PDF
This graph or chart is linked to excel, and changes automatically based on data. Just left click on it and select Edit Data. Deliver an awe inspiring pitch with this creative Healthcare Financial Analysis Scorecard With Country Revenue Ppt Layouts PDF bundle. Topics like Revenue Generated Departments, Country Revenue Current can be discussed with this completely editable template. It is available for immediate download depending on the needs and requirements of the user.

Hiring Agency Profile With Financial Charts Ppt Model Example PDF
This graph or chart is linked to excel, and changes automatically based on data. Just left click on it and select edit data. Pitch your topic with ease and precision using this hiring agency profile with financial charts ppt model example pdf. This layout presents information on revenue, operating income, operating margin, satisfaction rate. It is also available for immediate download and adjustment. So, changes can be made in the color, design, graphics or any other component to create a unique layout.

Company Quarterly Financial Highlights With Key Insights Information PDF
This slide shows the graph related to quarterly decreasing trend of the net sales and operating profit margin for the year 2021, along with the key insights. Deliver and pitch your topic in the best possible manner with this company quarterly financial highlights with key insights information pdf. Use them to share invaluable insights on strategies, sales, marketing, revenue, operating profit, methods and impress your audience. This template can be altered and modified as per your expectations. So, grab it now.

Pie Graph Layer Of Organizational Report Themes PDF
Pitch your topic with ease and precision using this pie graph layer of organizational report themes pdf. This layout presents information on revenues increased by, business growth and expansion, customer traffic increased by. It is also available for immediate download and adjustment. So, changes can be made in the color, design, graphics or any other component to create a unique layout.
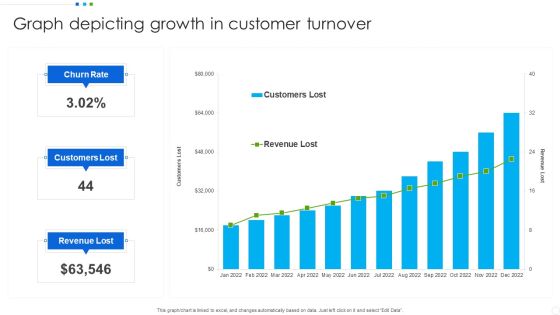
Graph Depicting Growth In Customer Turnover Infographics PDF
Showcasing this set of slides titled Graph Depicting Growth In Customer Turnover Infographics PDF. The topics addressed in these templates are Revenue Lost, Customers Lost, Churn Rate. All the content presented in this PPT design is completely editable. Download it and make adjustments in color, background, font etc. as per your unique business setting.
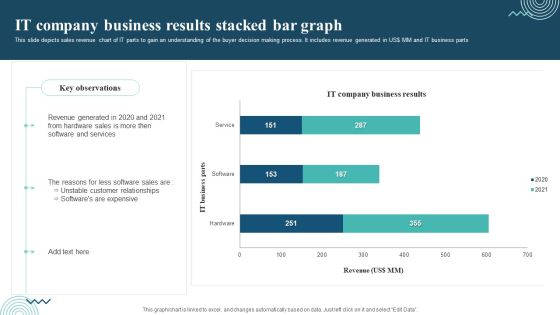
IT Company Business Results Stacked Bar Graph Topics PDF
Showcasing this set of slides titled IT Company Business Results Stacked Bar Graph Topics PDF. The topics addressed in these templates are Revenue Generated, Software And Services, Unstable Customer Relationships. All the content presented in this PPT design is completely editable. Download it and make adjustments in color, background, font etc. As per your unique business setting.

BANT Sales Lead Qualification Model Our Financial Highlights Background PDF
This graph or chart is linked to excel and change automatically based on data. Just left click on it and select Edit Data. Deliver an awe inspiring pitch with this creative BANT Sales Lead Qualification Model Our Financial Highlights Background PDF bundle. Topics like Gross Profit, Net Profit, Earnings Per can be discussed with this completely editable template. It is available for immediate download depending on the needs and requirements of the user.

Business Graph Marketing PowerPoint Templates And PowerPoint Themes 0712
Business Graph Marketing PowerPoint Templates And PowerPoint Themes 0712-Microsoft Powerpoint Templates and Background with business graph
Business Graph Success PowerPoint Templates And PowerPoint Themes 0712
Business Graph Success PowerPoint Templates And PowerPoint Themes 0712-Microsoft Powerpoint Templates and Background with business graph

Income Graph Business PowerPoint Templates And PowerPoint Themes 0712
Income Graph Business PowerPoint Templates And PowerPoint Themes 0712-Microsoft Powerpoint Templates and Background with bar graph
Business Graph Finance PowerPoint Templates And PowerPoint Themes 0712
Business Graph Finance PowerPoint Templates And PowerPoint Themes 0712-Microsoft Powerpoint Templates and Background with business graph

Success Graph Finance PowerPoint Templates And PowerPoint Themes 0812
Success Graph Finance PowerPoint Templates And PowerPoint Themes 0812-Microsoft Powerpoint Templates and Background with success graph
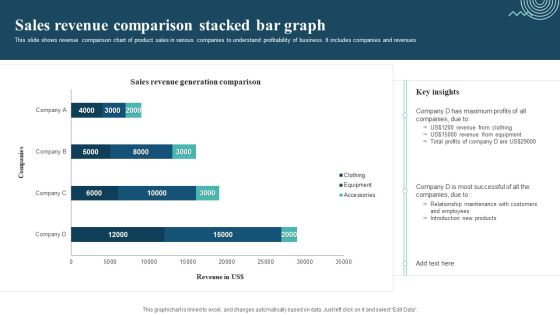
Sales Revenue Comparison Stacked Bar Graph Mockup PDF
This slide shows revenue comparison chart of product sales in various companies to understand profitability of business. It includes companies and revenues. Showcasing this set of slides titled Sales Revenue Comparison Stacked Bar Graph Mockup PDF. The topics addressed in these templates are Sales Revenue Comparison, Revenue From Clothing, Revenue From Equipment. All the content presented in this PPT design is completely editable. Download it and make adjustments in color, background, font etc. as per your unique business setting.

U S Environmental High Tech Industry Revenue Graph Professional PDF
This slide shows the revenue generated from different environmental technologies in US . It includes analytical services , wastewater treatment woks , solid waste management , etc. Showcasing this set of slides titled U S Environmental High Tech Industry Revenue Graph Professional PDF. The topics addressed in these templates are Management, Materials Collection, Revenues. All the content presented in this PPT design is completely editable. Download it and make adjustments in color, background, font etc. as per your unique business setting.
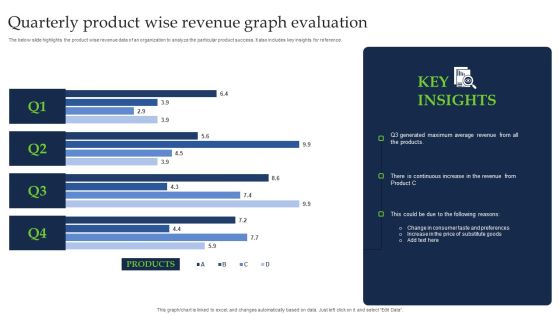
Quarterly Product Wise Revenue Graph Evaluation Brochure PDF
The below slide highlights the product wise revenue data of an organization to analyze the particular product success. It also includes key insights for reference. Pitch your topic with ease and precision using this Quarterly Product Wise Revenue Graph Evaluation Brochure PDF. This layout presents information on Products, Average Revenue. It is also available for immediate download and adjustment. So, changes can be made in the color, design, graphics or any other component to create a unique layout.
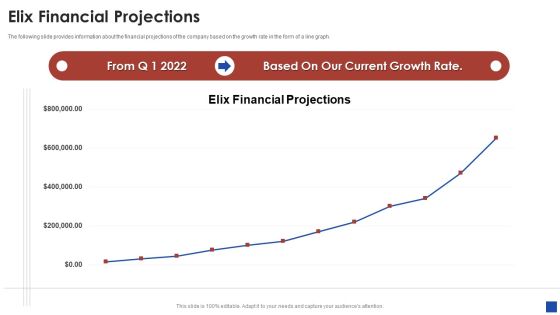
Elix Incubator Venture Capital Funding Elix Financial Projections Background PDF
The following slide provides information about the financial projections of the company based on the growth rate in the form of a line graph. Deliver an awe inspiring pitch with this creative elix incubator venture capital funding elix financial projections background pdf bundle. Topics like elix financial projections can be discussed with this completely editable template. It is available for immediate download depending on the needs and requirements of the user.
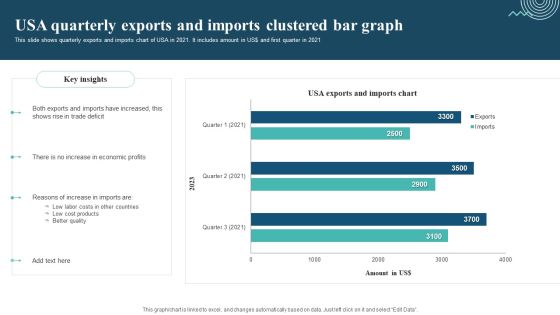
Usa Quarterly Exports And Imports Clustered Bar Graph Designs PDF
This slide shows quarterly exports and imports chart of USA in 2021. It includes amount in US dollar and first quarter in 2021. Pitch your topic with ease and precision using this Usa Quarterly Exports And Imports Clustered Bar Graph Designs PDF. This layout presents information on Exports And Imports, Trade Deficit, Economic Profits. It is also available for immediate download and adjustment. So, changes can be made in the color, design, graphics or any other component to create a unique layout.

Organization Monitor Monthly Budgeting To Check Financial Stability Slides PDF
Following slides shows mmonitoring monthly budgeting by the organisation to ensure financial stability which assist in revenue generation. It includes sales, operating profit, etc. Showcasing this set of slides titled Organization Monitor Monthly Budgeting To Check Financial Stability Slides PDF. The topics addressed in these templates are Organization Monitor Monthly Budgeting, Check Financial Stability. All the content presented in this PPT design is completely editable. Download it and make adjustments in color, background, font etc. as per your unique business setting.

Financial Waterfall Model Revenue Growth Analysis Professional PDF
The following slide showcases financial waterfall for revenue growth in electronics industry. It presents information related to percentage increase in sales, net sales, etc. Showcasing this set of slides titled Financial Waterfall Model Revenue Growth Analysis Professional PDF. The topics addressed in these templates are Financial, Revenue Growth, Analysis. All the content presented in this PPT design is completely editable. Download it and make adjustments in color, background, font etc. as per your unique business setting.
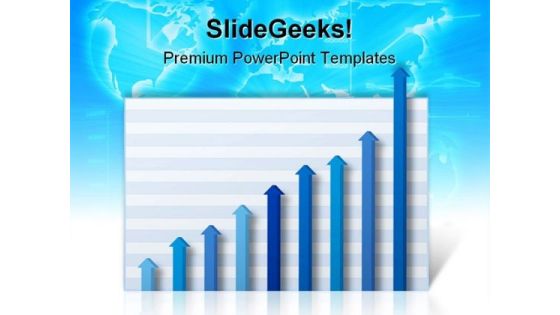
Business Graph Money PowerPoint Themes And PowerPoint Slides 0511
Microsoft PowerPoint Slide and Theme with business graph with profits rising off the chart graph

Project KPI Dashboard To Monitor Financial Budget Evaluation Demonstration PDF
This slide signifies the key performance indicator dashboard to evaluate financial estimation. It covers information regarding to expense, payable account and monthly performance. Showcasing this set of slides titled Project KPI Dashboard To Monitor Financial Budget Evaluation Demonstration PDF. The topics addressed in these templates are Project KPI Dashboard, Monitor Financial Budget Evaluation. All the content presented in this PPT design is completely editable. Download it and make adjustments in color, background, font etc. as per your unique business setting.

Financial Software Vendor Scan And Mini Profiles Mockup PDF
The slide provides brief business overview of a financial software vendor. Profile include details such as business overview, revenue from the software, user base the software, major industries served, key partners, major competitors etc. Deliver an awe inspiring pitch with this creative Financial Software Vendor Scan And Mini Profiles Mockup PDF bundle. Topics like Financial Services, Consumer Goods, Technology, Revenue can be discussed with this completely editable template. It is available for immediate download depending on the needs and requirements of the user.
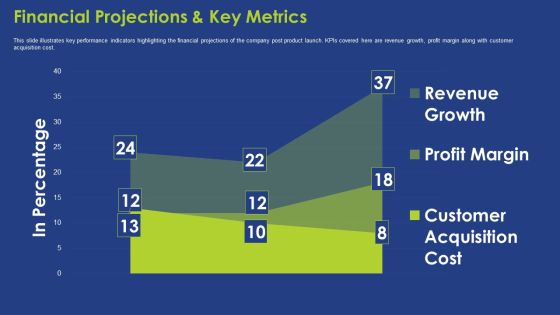
Financial Projections And Key Metrics Ppt Summary Background PDF
This slide illustrates key performance indicators highlighting the financial projections of the company post product launch. KPIs covered here are revenue growth, profit margin along with customer acquisition cost. Deliver an awe inspiring pitch with this creative financial projections and key metrics ppt summary background pdf bundle. Topics like financial projections and key metrics can be discussed with this completely editable template. It is available for immediate download depending on the needs and requirements of the user.
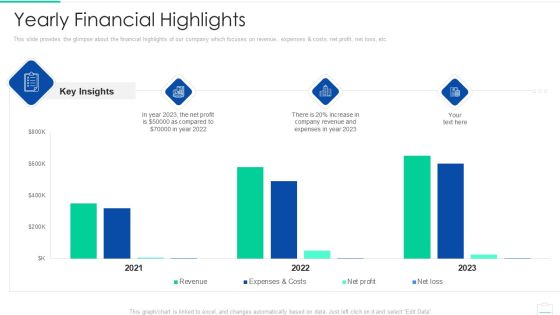
Market Area Analysis Yearly Financial Highlights Designs PDF
This slide provides the glimpse about the financial highlights of our company which focuses on revenue, expenses and costs, net profit, net loss, etc.Deliver an awe inspiring pitch with this creative market area analysis yearly financial highlights designs pdf bundle. Topics like yearly financial highlights can be discussed with this completely editable template. It is available for immediate download depending on the needs and requirements of the user.

Addressing Financial Projections Of Front Platform Elements PDF
This slide caters details about financial projections of Front platform including expenditure, revenues, ARR and headcount.Deliver and pitch your topic in the best possible manner with this addressing financial projections of front platform elements pdf. Use them to share invaluable insights on addressing financial projections of front platform and impress your audience. This template can be altered and modified as per your expectations. So, grab it now.

Addressing Potential Financial Performance Of Yelp Template PDF
This slide caters details about potential financial performance of Yelp platform in terms of net revenues and EBITDA. Deliver and pitch your topic in the best possible manner with this addressing potential financial performance of yelp template pdf. Use them to share invaluable insights on addressing potential financial performance of yelp and impress your audience. This template can be altered and modified as per your expectations. So, grab it now.

Merger And Acquisition Due Diligence Key Financial Highlights Clipart PDF
This slide provides the financial highlights the key financial highlights of the firm. It covers gross profit margin, OPEX ratio, operating profit margin and net profit margin. Deliver and pitch your topic in the best possible manner with this merger and acquisition due diligence key financial highlights clipart pdf. Use them to share invaluable insights on revenue, gross profit, operating profit, expenses and impress your audience. This template can be altered and modified as per your expectations. So, grab it now.
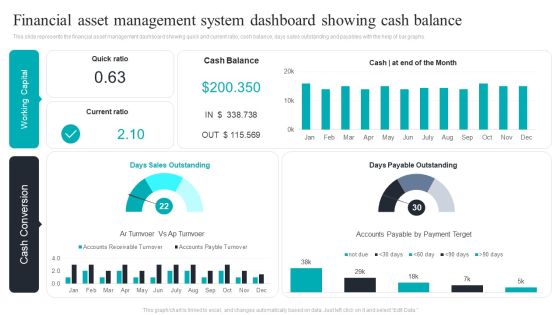
Financial Asset Management System Dashboard Showing Cash Balance Download PDF
This slide represents the financial asset management dashboard showing quick and current ratio, cash balance, days sales outstanding and payables with the help of bar graphs. Pitch your topic with ease and precision using this Financial Asset Management System Dashboard Showing Cash Balance Download PDF. This layout presents information on Financial Asset, Management System, Dashboard Showing, Cash Balance. It is also available for immediate download and adjustment. So, changes can be made in the color, design, graphics or any other component to create a unique layout.
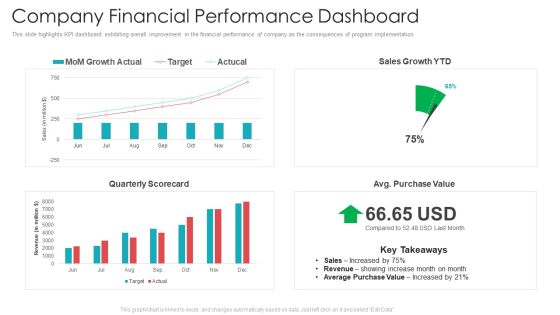
Official Team Collaboration Plan Company Financial Performance Dashboard Summary PDF
This slide highlights KPI dashboard exhibiting overall improvement in the financial performance of company as the consequences of program implementation. Deliver an awe-inspiring pitch with this creative official team collaboration plan company financial performance dashboard summary pdf bundle. Topics like company financial performance dashboard can be discussed with this completely editable template. It is available for immediate download depending on the needs and requirements of the user.

Financial Solutions Company Profile Ownership Structure Rules PDF
The slide highlights the shareholding patterns in financial banking group. It showcase percentage shareholdings of foreign institutional investors, domestic institutional investors, mutual funds, company and financial institutions and key insights Deliver an awe inspiring pitch with this creative Financial Solutions Company Profile Ownership Structure Rules PDF bundle. Topics like Shareholding Pattern, Institutional Investors, Domestic Institutional can be discussed with this completely editable template. It is available for immediate download depending on the needs and requirements of the user.
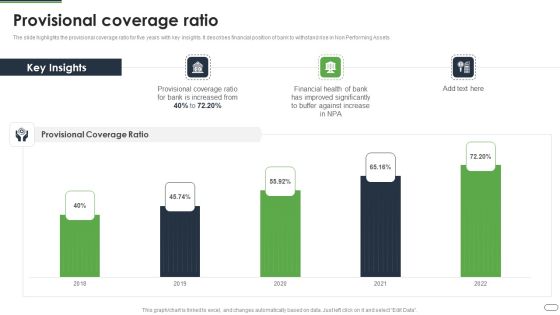
Financial Solutions Company Profile Provisional Coverage Ratio Clipart PDF
The slide highlights the provisional coverage ratio for five years with key insights. It describes financial position of bank to withstand rise in Non Performing Assets Deliver an awe inspiring pitch with this creative Financial Solutions Company Profile Provisional Coverage Ratio Clipart PDF bundle. Topics like Financial Health, Improved Significantly, Against Increase can be discussed with this completely editable template. It is available for immediate download depending on the needs and requirements of the user.

ISO 9001 Certification Procedure Causes Of Financial Loss Sample PDF
This template includes causes of financial losses on the firm due to low or no quality management system such as no client interactions and process management. Deliver an awe inspiring pitch with this creative ISO 9001 Certification Procedure Causes Of Financial Loss Sample PDF bundle. Topics like Process Management, Customer Satisfaction Program, Financial Loss can be discussed with this completely editable template. It is available for immediate download depending on the needs and requirements of the user.

Planned Vs Actual Cost Financial Yearly Forecast Portrait PDF
This slide shows planned and actual cost business finance plan to cover financial gaps. It includes planned and actual cost for a year with deviations. Pitch your topic with ease and precision using this Planned Vs Actual Cost Financial Yearly Forecast Portrait PDF. This layout presents information on Planned Vs Actual Cost, Financial Yearly Forecast. It is also available for immediate download and adjustment. So, changes can be made in the color, design, graphics or any other component to create a unique layout.

School Yearly Forecast With Financial Performance Information PDF
This slide shows business financial plan for pool water services to manage things effectively. It includes financial position, Target Market and Action Plan etc. Pitch your topic with ease and precision using this School Yearly Forecast With Financial Performance Information PDF. This layout presents information on Target Market, Action Plan. It is also available for immediate download and adjustment. So, changes can be made in the color, design, graphics or any other component to create a unique layout.

Brand Remodeling Strategy Of Financial Institutions Professional PDF
Following slide presents a statistical overview of branch transformation strategy of financial institutions. Major elements covered are branch design transformation, increase customer care executives, cross channel integration etc. Pitch your topic with ease and precision using this Brand Remodeling Strategy Of Financial Institutions Professional PDF. This layout presents information on Brand Remodeling Strategy, Financial Institutions. It is also available for immediate download and adjustment. So, changes can be made in the color, design, graphics or any other component to create a unique layout.

Organization Financial Asset Structure Performance Report Portrait PDF
This slide showcase companys financial structure which includes current asset, liabilities, asset structure, and key ratios. It includes long term receivables, intangible assets, goodwill, intellectual property, real estate etc. Showcasing this set of slides titled Organization Financial Asset Structure Performance Report Portrait PDF. The topics addressed in these templates are Financial Position, Assets Structure, Current Assets. All the content presented in this PPT design is completely editable. Download it and make adjustments in color, background, font etc. as per your unique business setting.

Financial Analysis Dashboard Of Corporate Bank Mockup PDF
Following slide outlines the dashboard for financial examination of corporate financial institution which shows how banks managing their cash flow annually Pitch your topic with ease and precision using this Financial Analysis Dashboard Of Corporate Bank Mockup PDF. This layout presents information on Month, Current Ratio, Inventory. It is also available for immediate download and adjustment. So, changes can be made in the color, design, graphics or any other component to create a unique layout.
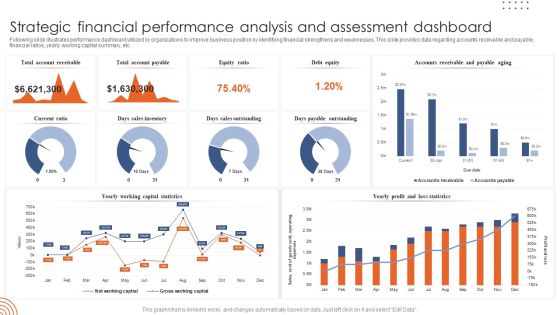
Strategic Financial Performance Analysis And Assessment Dashboard Template PDF
Following slide illustrates performance dashboard utilized by organizations to improve business position by identifying financial strengthens and weaknesses. This slide provides data regarding accounts receivable and payable, financial ratios, yearly working capital summary, etc. Showcasing this set of slides titled Strategic Financial Performance Analysis And Assessment Dashboard Template PDF. The topics addressed in these templates are Strategic Financial Performance, Analysis Assessment Dashboard. All the content presented in this PPT design is completely editable. Download it and make adjustments in color, background, font etc. as per your unique business setting.

Startup Business Company Financial Model Showing Operating Expenses Professional PDF
This slide represents the financial model prepared by the financial forecasting team of startup company showing the increase in operating expenses of the organization in the upcoming financial years. Pitch your topic with ease and precision using this Startup Business Company Financial Model Showing Operating Expenses Professional PDF. This layout presents information on General And Administrative, Total Payroll Travel, Sales And Marketing. It is also available for immediate download and adjustment. So, changes can be made in the color, design, graphics or any other component to create a unique layout.

Commercial Bank Financial Services Company Profile Ownership Structure Professional PDF
The slide highlights the shareholding patterns in financial banking group. It showcase percentage shareholdings of foreign institutional investors, domestic institutional investors, mutual funds, company and financial institutions and key insights. Deliver an awe inspiring pitch with this creative Commercial Bank Financial Services Company Profile Ownership Structure Professional PDF bundle. Topics like Financial Institutions, Domestic Institutional Investors, Mutual Funds, Foreign Institutional Investors can be discussed with this completely editable template. It is available for immediate download depending on the needs and requirements of the user.
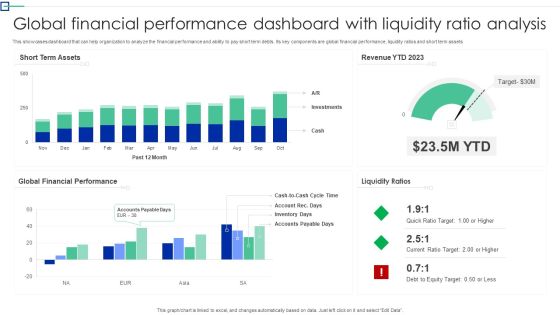
Global Financial Performance Dashboard With Liquidity Ratio Analysis Information PDF
This showcases dashboard that can help organization to analyze the financial performance and ability to pay short term debts. Its key components are global financial performance, liquidity ratios and short term assets. Pitch your topic with ease and precision using this Global Financial Performance Dashboard With Liquidity Ratio Analysis Information PDF. This layout presents information on Short Term Assets, Global Financial Performance, Liquidity Ratios. It is also available for immediate download and adjustment. So, changes can be made in the color, design, graphics or any other component to create a unique layout.

Financial Ratio Assessment Showing Liquidity And Profitability Brochure PDF
This slide shows financial analysis based on ratios to know about the different areas of an organization. It include financial ratios like liquidity ratios, debt ratios and asset management ratios etc. Showcasing this set of slides titled Financial Ratio Assessment Showing Liquidity And Profitability Brochure PDF. The topics addressed in these templates are Financial Ratio Analysis, Equity Ratio, Tangible Net Debt Ratio. All the content presented in this PPT design is completely editable. Download it and make adjustments in color, background, font etc. as per your unique business setting.

Products Sale Graph Business PowerPoint Templates And PowerPoint Themes 0912
Products Sale Graph Business PowerPoint Templates And PowerPoint Themes 0912-Microsoft Powerpoint Templates and Background with business graph-Business graph, competition, business, finance, sales, Money
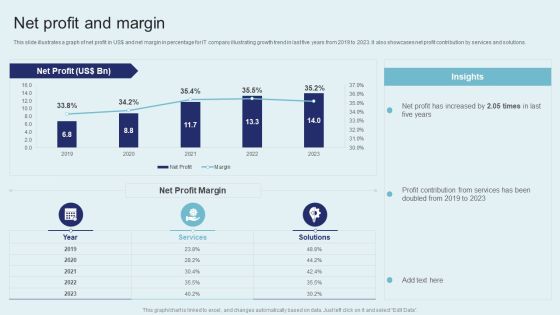
IT Firm Financial Statement Net Profit And Margin Slides PDF
This slide illustrates a graph of net profit in US dollar and net margin in percentage for IT company illustrating growth trend in last five years from 2019 to 2023. It also showcases net profit contribution by services and solutions. Do you have to make sure that everyone on your team knows about any specific topic I yes, then you should give IT Firm Financial Statement Net Profit And Margin Slides PDF a try. Our experts have put a lot of knowledge and effort into creating this impeccable IT Firm Financial Statement Net Profit And Margin Slides PDF. You can use this template for your upcoming presentations, as the slides are perfect to represent even the tiniest detail. You can download these templates from the Slidegeeks website and these are easy to edit. So grab these today.

IT Firm Financial Statement Operating Profit And Margin Formats PDF
This slide illustrates a graph of operating profit in US dollar and operating margin in percentage for IT company IT Firm Fina growth trend in last five years from 2019 to 2023. It also showcases operating profit contribution by services and solutions. Get a simple yet stunning designed IT Firm Financial Statement Operating Profit And Margin Formats PDF. It is the best one to establish the tone in your meetings. It is an excellent way to make your presentations highly effective. So, download this PPT today from Slidegeeks and see the positive impacts. Our easy to edit IT Firm Financial Statement Operating Profit And Margin Formats PDF can be your go to option for all upcoming conferences and meetings. So, what are you waiting for Grab this template today.
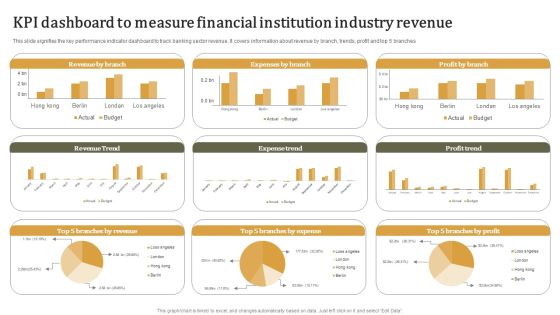
KPI Dashboard To Measure Financial Institution Industry Revenue Summary PDF
Pitch your topic with ease and precision using this KPI Dashboard To Measure Financial Institution Industry Revenue Summary PDF. This layout presents information on Measure Financial, Institution Industry . It is also available for immediate download and adjustment. So, changes can be made in the color, design, graphics or any other component to create a unique layout.
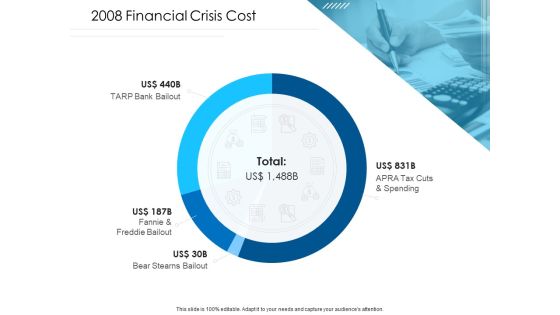
Unconventional Monetary Policy 2008 Financial Crisis Cost Structure PDF
Deliver an awe inspiring pitch with this creative unconventional monetary policy 2008 financial crisis cost structure pdf bundle. Topics like 2008 financial crisis cost can be discussed with this completely editable template. It is available for immediate download depending on the needs and requirements of the user.

Yearly Sales Assessment Of Products With Bar Graph Structure PDF
This slide represent graphical presentation of annual sales review of various products sold by an organization within 5 years showing difference in revenue generated .It shows report of following years 2018,2019,2020,and 2021. Showcasing this set of slides titled Yearly Sales Assessment Of Products With Bar Graph Structure PDF. The topics addressed in these templates are Product, Sales Of Product, Product Demand. All the content presented in this PPT design is completely editable. Download it and make adjustments in color, background, font etc. as per your unique business setting.
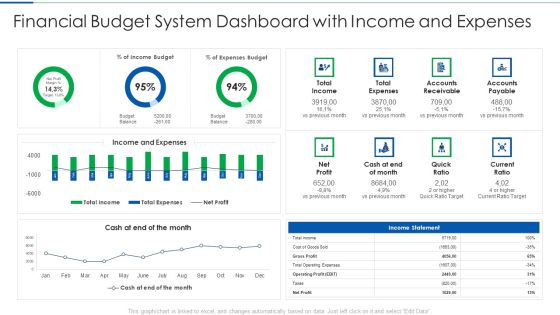
Financial Budget System Dashboard With Income And Expenses Themes PDF
Deliver an awe inspiring pitch with this creative financial budget system dashboard with income and expenses themes pdf bundle. Topics like financial budget system dashboard with income and expenses can be discussed with this completely editable template. It is available for immediate download depending on the needs and requirements of the user.
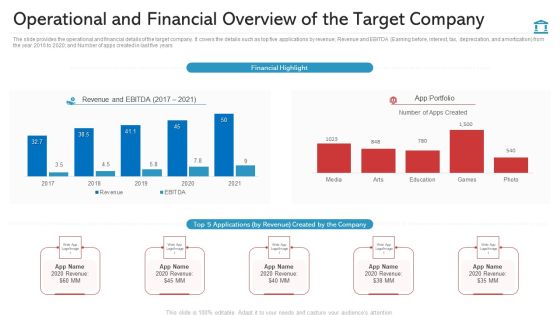
Operational And Financial Overview Of The Target Company Structure PDF
Deliver and pitch your topic in the best possible manner with thisoperational and financial overview of the target company structure pdf. Use them to share invaluable insights on financial highlight, revenue and ebitda 2017 to 2021, revenue and impress your audience. This template can be altered and modified as per your expectations. So, grab it now.

Summary Financial Sales And Profit Margin Analysis Dashboard Pictures PDF
This graph or chart is linked to excel, and changes automatically based on data. Just left click on it and select Edit Data. Deliver an awe inspiring pitch with this creative Summary Financial Sales And Profit Margin Analysis Dashboard Pictures PDF bundle. Topics like Net Profit, Past Year Vs Target Vs Actual, Net Profit Margin By Region, Channel, Expenses Breakdown, Costs And Expenses, Profitability Indicator Ratios can be discussed with this completely editable template. It is available for immediate download depending on the needs and requirements of the user.

 Home
Home