Financial Graphs

Bar Graph Ppt PowerPoint Presentation File Show
This is a bar graph ppt powerpoint presentation file show. This is a four stage process. The stages in this process are business, marketing, graph, growth, finance.

Bar Graph Ppt Powerpoint Presentation File Graphics
This is a bar graph ppt powerpoint presentation file graphics. This is a three stage process. The stages in this process are product, graph, management, business, marketing.

Bar Graph Ppt PowerPoint Presentation Show Inspiration
This is a bar graph ppt powerpoint presentation show inspiration. This is a six stage process. The stages in this process are business, marketing, bar, graph, success.

Bar Graph Ppt Powerpoint Presentation Outline Shapes
This is a bar graph ppt powerpoint presentation outline shapes. This is a four stage process. The stages in this process are product, graph, finance, marketing, business.

Bar Graph Ppt PowerPoint Presentation Layouts Professional
This is a bar graph ppt powerpoint presentation layouts professional. This is a five stage process. The stages in this process are product, business, marketing, finance, graph.

Bar Graph Ppt PowerPoint Presentation File Tips
This is a bar graph ppt powerpoint presentation file tips. This is a twelve stage process. The stages in this process are business, marketing, finance, graph, strategy.

Bar Graph Ppt PowerPoint Presentation Show Guidelines
This is a bar graph ppt powerpoint presentation show guidelines. This is a four stage process. The stages in this process are product, growth, business, finance, bar graph.

Bar Graph Ppt PowerPoint Presentation Styles Show
This is a bar graph ppt powerpoint presentation styles show. This is a one stage process. The stages in this process are bar graph, finance, marketing, investment, business.

Bar Graph Ppt PowerPoint Presentation Layouts Portrait
This is a bar graph ppt powerpoint presentation layouts portrait. This is a three stage process. The stages in this process are bar graph, finance, marketing, strategy, business.

Bar Graph Ppt PowerPoint Presentation File Display
This is a bar graph ppt powerpoint presentation file display. This is a four stage process. The stages in this process are bar graph, marketing, strategy, finance, analysis.

Bar Graph Ppt PowerPoint Presentation Professional Background
This is a bar graph ppt powerpoint presentation professional background. This is a two stage process. The stages in this process are bar graph, finance, marketing, strategy, business.

Bar Graph Ppt PowerPoint Presentation Layouts Backgrounds
This is a bar graph ppt powerpoint presentation layouts backgrounds. This is a one stage process. The stages in this process are business, marketing, finance, bar graph, strategy.

Bar Graph Ppt PowerPoint Presentation Portfolio Example
This is a bar graph ppt powerpoint presentation portfolio example. This is a three stage process. The stages in this process are sales in percentage, year, business, product, business, graph.

Bar Graph Ppt PowerPoint Presentation File Slides
This is a bar graph ppt powerpoint presentation file slides. This is a three stage process. The stages in this process are product, sales in percentage, bar graph, growth, success.

Bar Graph Ppt PowerPoint Presentation Summary Format
This is a bar graph ppt powerpoint presentation summary format. This is a three stage process. The stages in this process are bar graph, business, marketing, years, percentage, finance.

Bar Graph Ppt PowerPoint Presentation Layouts Influencers
This is a bar graph ppt powerpoint presentation layouts influencers. This is a two stage process. The stages in this process are business, marketing, in bar graph, sales in percentage, finance.

Bar Graph Ppt PowerPoint Presentation Styles Skills
This is a bar graph ppt powerpoint presentation styles skills. This is a two stage process. The stages in this process are bar graph, product, in year, in percentage, business.

Bar Graph Ppt PowerPoint Presentation Pictures Picture
This is a bar graph ppt powerpoint presentation pictures picture. This is a three stage process. The stages in this process are business, marketing, strategy, planning, finance.

Bar Graph Ppt PowerPoint Presentation Slides Slideshow
This is a bar graph ppt powerpoint presentation slides slideshow. This is a three stage process. The stages in this process are business, finance, marketing, strategy, planning.

Competitor Analysis Graph Ppt PowerPoint Presentation Styles
This is a competitor analysis graph ppt powerpoint presentation styles. This is a five stage process. The stages in this process are graph, business, marketing, competitor.

Bar Graph Ppt PowerPoint Presentation Sample
This is a bar graph ppt powerpoint presentation sample. This is a four stage process. The stages in this process are bar graph, finance, marketing, strategy, analysis, business.

Competitor Analysis Graph Ppt PowerPoint Presentation Outline
This is a competitor analysis graph ppt powerpoint presentation outline. This is a five stage process. The stages in this process are bar graph, marketing, strategy, analysis, business.

Bar Graph Ppt PowerPoint Presentation Gallery Good
This is a bar graph ppt powerpoint presentation gallery good. This is a seven stage process. The stages in this process are graph, finance, business, marketing.

Bar Graph Ppt PowerPoint Presentation Layouts Graphics
This is a bar graph ppt powerpoint presentation layouts graphics. This is a four stage process. The stages in this process are bar graph, finance, marketing, strategy, business.

Bar Graph Ppt PowerPoint Presentation Professional Templates
This is a bar graph ppt powerpoint presentation professional templates. This is a four stage process. The stages in this process are bar graph, finance, marketing, analysis, business.

Bar Graph Ppt PowerPoint Presentation Professional Clipart
This is a bar graph ppt powerpoint presentation professional clipart. This is a six stage process. The stages in this process are bar graph, finance, marketing, strategy, business.

Bar Graph Ppt PowerPoint Presentation Styles Influencers
This is a bar graph ppt powerpoint presentation styles influencers. This is a four stage process. The stages in this process are bar, graph, business, marketing, finance.

Bar Graph Ppt PowerPoint Presentation Summary Infographics
This is a bar graph ppt powerpoint presentation summary infographics. This is a two stage process. The stages in this process are Bar Graph, Finance, Marketing, Management, Investment.

Bar Graph Ppt PowerPoint Presentation Model Clipart
This is a bar graph ppt powerpoint presentation model clipart. This is a six stage process. The stages in this process are sales in percentage, product, bar graph, business, marketing.

Bar Graph Ppt PowerPoint Presentation Outline Layout
This is a bar graph ppt powerpoint presentation outline layout. This is a four stage process. The stages in this process are sales in percentage, product, bar graph, business, marketing.

Bar Graph Ppt PowerPoint Presentation Styles Model
This is a bar graph ppt powerpoint presentation styles model. This is a four stage process. The stages in this process are bar graph, finance, marketing, analysis, investment, business.

Bar Graph Ppt PowerPoint Presentation File Portfolio
This is a bar graph ppt powerpoint presentation file portfolio. This is a twelve stage process. The stages in this process are financial, marketing, management, business, strategy.

Bar Graph Ppt PowerPoint Presentation Inspiration
This is a bar graph ppt powerpoint presentation inspiration. This is a five stage process. The stages in this process are bar graph, finance, marketing, strategy, investment, analysis, business, success.

Bar Graph Ppt PowerPoint Presentation Show Topics
This is a bar graph ppt powerpoint presentation show topics. This is a nine stage process. The stages in this process are business, finance, marketing, strategy, bar graph, growth.

Bar Graph Ppt PowerPoint Presentation Portfolio Outline
This is a bar graph ppt powerpoint presentation portfolio outline. This is a three stage process. The stages in this process are bar graph, finance, marketing, strategy, investment, business.

Bar Graph Ppt PowerPoint Presentation Pictures Tips
This is a bar graph ppt powerpoint presentation pictures tips. This is a five stage process. The stages in this process are bar graph, finance, marketing, strategy, analysis, business.

Bar Graph Ppt PowerPoint Presentation File Picture
This is a bar graph ppt powerpoint presentation file picture. This is a six stage process. The stages in this process are management, planning, marketing, business, strategy.

Money Need Assessment Analysis Graph Ppt Examples
This is a money need assessment analysis graph ppt examples. This is a two stage process. The stages in this process are production, marketing, need, money, finance.

Portfolio Evaluation Bar Graph Ppt Slides
This is a portfolio evaluation bar graph ppt slides. This is a five stage process. The stages in this process are business, finance, marketing.

Product Development Analysis Bar Graph Powerpoint Themes
This is a product development analysis bar graph powerpoint themes. This is a five stage process. The stages in this process are business, growth, strategy, management, pretention.

Band Engagement Analysis Bar Graph Powerpoint Ideas
This is a band engagement analysis bar graph powerpoint ideas. This is a four stage process. The stages in this process are engagement, brand, monthly, weekly.

Competitor Analysis Graph Ppt PowerPoint Presentation Graphics
This is a competitor analysis graph ppt powerpoint presentation graphics. This is a five stage process. The stages in this process are competitor, business, marketing.

Bar Graph Ppt PowerPoint Presentation Layouts Gridlines
This is a bar graph ppt powerpoint presentation layouts gridlines. this is a three stage process. The stages in this process are product, percentage, business, marketing, management.

Bar Graph Ppt PowerPoint Presentation Gallery Inspiration
This is a bar graph ppt powerpoint presentation gallery inspiration. This is a three stage process. The stages in this process are product, sales in percentage, finance, success.

Bar Graph Ppt PowerPoint Presentation Outline Structure
This is a bar graph ppt powerpoint presentation outline structure. This is a three stage process. The stages in this process are product, percentage, finance, business.

Bar Graph Ppt PowerPoint Presentation Icon
This is a bar graph ppt powerpoint presentation icon. This is a three stage process. The stages in this process are business, finance, marketing, strategy, analysis.

Bar Graph Ppt PowerPoint Presentation Show Slides
This is a bar graph ppt powerpoint presentation show slides. This is a two stage process. The stages in this process are finance, marketing, management, investment, analysis.

Clustered Column Graph Ppt PowerPoint Presentation Layouts
This is a clustered column graph ppt powerpoint presentation layouts. This is a two stage process. The stages in this process are finance, marketing, management, investment, analysis.
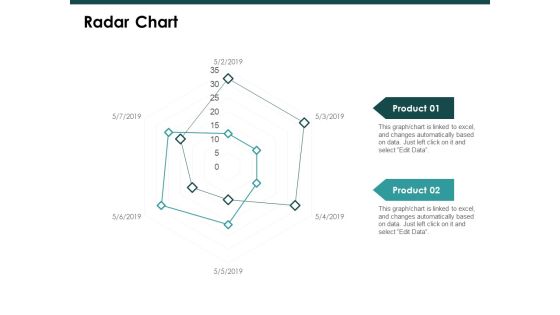
Radar Chart Graph Ppt PowerPoint Presentation Slide
This is a radar chart graph ppt powerpoint presentation slide. This is a two stage process. The stages in this process are finance, marketing, management, investment, analysis.

Clustered Bar Graph Ppt PowerPoint Presentation Templates
This is a clustered bar graph ppt powerpoint presentation templates. This is a three stage process. The stages in this process are finance, marketing, management, investment, analysis.
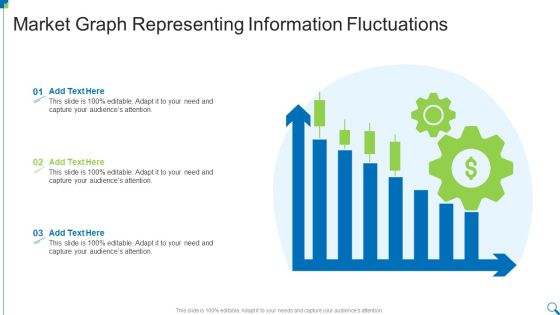
Market Graph Representing Information Fluctuations Diagrams PDF
Presenting Market Graph Representing Information Fluctuations Diagrams PDF to dispense important information. This template comprises three stages. It also presents valuable insights into the topics including Market Graph, Representing, Information Fluctuations This is a completely customizable PowerPoint theme that can be put to use immediately. So, download it and address the topic impactfully.
Investment Portfolio Advantages Graph Icon Rules PDF
Presenting Investment Portfolio Advantages Graph Icon Rules PDF to dispense important information. This template comprises three stages. It also presents valuable insights into the topics including Investment Portfolio, Advantages Graph Icon. This is a completely customizable PowerPoint theme that can be put to use immediately. So, download it and address the topic impactfully.

Bar Graph Ppt PowerPoint Presentation Gallery Grid
This is a bar graph ppt powerpoint presentation gallery grid. This is a three stage process. The stages in this process are sales in percentage, product, finance, business, marketing.
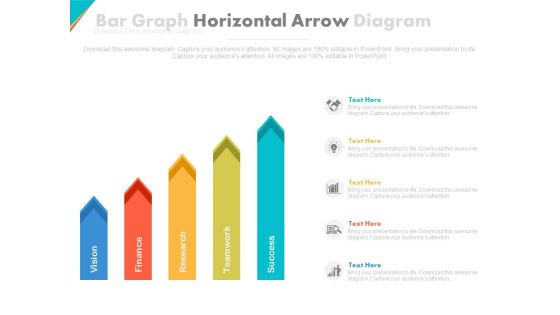
Five Horizontal Arrows Bar Graph Powerpoint Slides
This PowerPoint template contains five horizontal arrows bra graph. You may download this PPT slide design to display steps of strategic planning. You can easily customize this template to make it more unique as per your need.
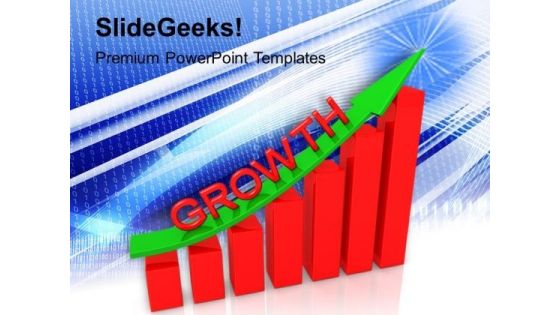
Business Graph Up PowerPoint Templates And PowerPoint Themes 1012
Business Graph Up PowerPoint Templates And PowerPoint Themes 1012-This PowerPoint Template shows the Bar Graph with increasing percentage which signifies the Financial Growth. The Template signifies the concept of Team Work, Team Leader etc. The structure of our templates allows you to effectively highlight the key issues concerning the growth of your business.-Business Graph Up PowerPoint Templates And PowerPoint Themes 1012-This PowerPoint template can be used for presentations relating to-Business graph, success, arrows, business, signs, shapes

Growth Graph Moving Up PowerPoint Templates And PowerPoint Themes 1012
Growth Graph Moving Up PowerPoint Templates And PowerPoint Themes 1012-This PowerPoint Template shows the Bar Graph with increasing percentage which signifies the Financial Growth. The Template signifies the concept of Team Work, Team Leader etc. The structure of our templates allows you to effectively highlight the key issues concerning the growth of your business.-Growth Graph Moving Up PowerPoint Templates And PowerPoint Themes 1012-This PowerPoint template can be used for presentations relating to-Business graph with rising arrow, success, business, arrows, marketing, finance

Bar Graph For Future Planning Powerpoint Template
This business diagram display bar graph for years 2015 and 2016. You may use this slide to display statistical analysis. This diagram provides an effective way of displaying information you can edit text, color, shade and style as per you need.
Arrow Graph Success PowerPoint Templates And PowerPoint Themes 1012
Arrow Graph Success PowerPoint Templates And PowerPoint Themes 1012-This PowerPoint Template shows arrow graph with increase. This image signifies the Financial or Business Growth. The Template assumes business concept. Use this template for Global Business. The structure of our templates allows you to effectively highlight the key issues concerning the growth of your business.-Arrow Graph Success PowerPoint Templates And PowerPoint Themes 1012-This PowerPoint template can be used for presentations relating to-Arrow to success, business, marketing, finance, arrows, success

Profit Growth Graph With Gears Powerpoint Template
This business slide contains profit growth graph with gears. This PowerPoint template helps to display outline of business plan. Use this diagram to impart more clarity to data and to create more sound impact on viewers.

Bar Graph Business PowerPoint Template 1110
Abstract vector background with bar graphs and dollar sign

Organizational Development And Promotional Plan Our Financial Highlights Ideas PDF
In this slide we have provided multiple graphs that give an overview of major financial highlights over the year. Such as revenue , gross profit m net profit and earning per share. Deliver an awe inspiring pitch with this creative organizational development and promotional plan our financial highlights ideas pdf bundle. Topics like revenue, gross profit, net profit can be discussed with this completely editable template. It is available for immediate download depending on the needs and requirements of the user.
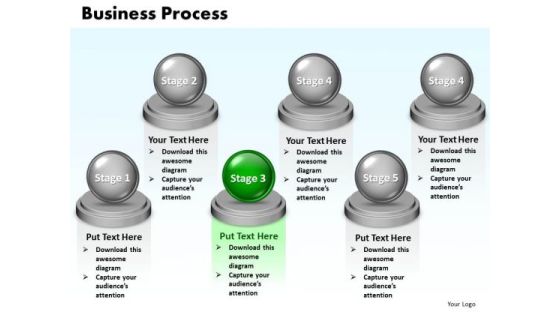
Ppt Steps Of Financial Process 6 Stages Presentation PowerPoint Tips 0812 Templates
PPT steps of financial process 6 stages presentation powerpoint tips 0812 Templates-Forward thinking is the way to go. Use our Diagrams to emphasize your views. Create captivating presentations to deliver comparative and weighted arguments.-PPT steps of financial process 6 stages presentation powerpoint tips 0812 Templates-achievement, aspirations, blank, blue, business, chart, competition, consultant, control, copy, diagram, drawing, expertise, finance, financial, future, graph, growth, hand, improvement, increase, investment, isolated, leadership, line, manager, market, progress, selling, shares, space, stock, success

Other Operational And Financial Kpis Inspiration PDF
The slide provides five years graphs of major KPIs key performance indicators, which might help the company to track its performance. Covered KPIs include revenue, total passengers, operating income, customer satisfaction rate etc.Deliver an awe-inspiring pitch with this creative other operational and financial KPIs inspiration pdf. bundle. Topics like total passengers, operating income, revenue, 2017 to 2021 can be discussed with this completely editable template. It is available for immediate download depending on the needs and requirements of the user.

Other Operational And Financial Kpis Information PDF
The slide provides five years graphs of major KPIs key performance indicators, which might help the company to track its performance. Covered KPIs include revenue, total passengers, operating income, customer satisfaction rate etc. Deliver an awe inspiring pitch with this creative other operational and financial kpis information pdf bundle. Topics like revenue, operating income, customer satisfaction can be discussed with this completely editable template. It is available for immediate download depending on the needs and requirements of the user.
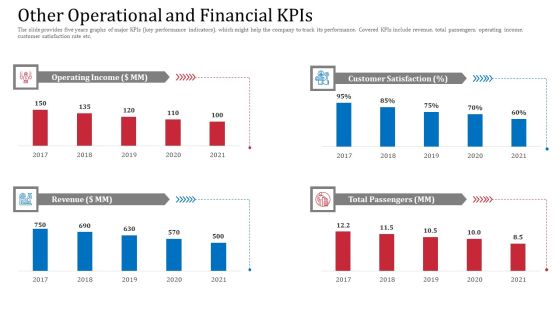
Other Operational And Financial Kpis Demonstration PDF
The slide provides five years graphs of major KPIs key performance indicators, which might help the company to track its performance. Covered KPIs include revenue, total passengers, operating income, customer satisfaction rate etc.Deliver and pitch your topic in the best possible manner with this other operational and financial kpis demonstration pdf. Use them to share invaluable insights on customer satisfaction, operating income, total passengers and impress your audience. This template can be altered and modified as per your expectations. So, grab it now.
Graph With Money PowerPoint Icon C
3D colored graph with paper currency.High quality render
Graph With Money PowerPoint Icon S
3D colored graph with paper currency.High quality render

Business People Vector Templates Download Graph PowerPoint
We present our business people vector templates download graph PowerPoint.Download our Computer PowerPoint Templates because You have the co-ordinates for your destination of success. Let our PowerPoint Templates and Slides map out your journey. Download and present our Business PowerPoint Templates because Our PowerPoint Templates and Slides will give good value for money. They also have respect for the value of your time. Use our People PowerPoint Templates because Watching this your Audience will Grab their eyeballs, they wont even blink. Use our Technology PowerPoint Templates because You canTake a leap off the starting blocks with our PowerPoint Templates and Slides. They will put you ahead of the competition in quick time. Use our Circle Charts PowerPoint Templates because They will Put your wonderful verbal artistry on display. Our PowerPoint Templates and Slides will provide you the necessary glam and glitter.Use these PowerPoint slides for presentations relating to 3d, abstract, action, background, business, businessman, career, carpet, cartoon,challenge, color, communication, company, competition, concept, corporate,design, finance, graph, graphic,growth, high, human, idea, illustration,individual, isolated, leader, man, motion, occupation, organization, people, person,red, render, shape, stair, step, success, symbol, top, up, white, winner, work,workforce. The prominent colors used in the PowerPoint template are Pink, Green, Yellow.

Profit Graph Business PowerPoint Presentation Slides C
Microsoft PowerPoint Slides and Background with colorful upward profit graph with blue background
Profit Graph Business PowerPoint Presentation Slides Cc
Microsoft PowerPoint Slides and Background with colorful upward profit graph with blue background

Profit Graph Business PowerPoint Presentation Slides F
Microsoft PowerPoint Slides and Background with colorful upward profit graph with blue background
Profit Graph Business PowerPoint Presentation Slides R
Microsoft PowerPoint Slides and Background with colorful upward profit graph with blue background
Profit Graph Business PowerPoint Presentation Slides S
Microsoft PowerPoint Slides and Background with colorful upward profit graph with blue background
Coin Graph Finance PowerPoint Presentation Slides C
Microsoft PowerPoint Slides and Backgrounds with bar graph made of gold coins
Coin Graph Finance PowerPoint Presentation Slides Cc
Microsoft PowerPoint Slides and Backgrounds with bar graph made of gold coins
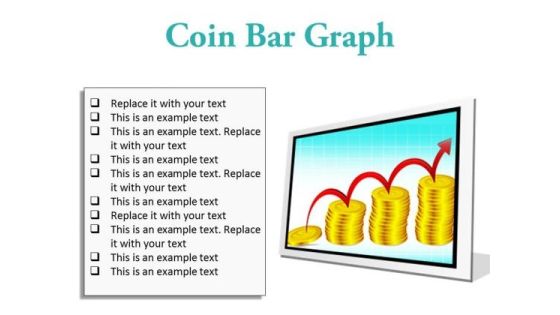
Coin Graph Finance PowerPoint Presentation Slides F
Microsoft PowerPoint Slides and Backgrounds with bar graph made of gold coins

Coin Graph Finance PowerPoint Presentation Slides R
Microsoft PowerPoint Slides and Backgrounds with bar graph made of gold coins

Coin Graph Finance PowerPoint Presentation Slides S
Microsoft PowerPoint Slides and Backgrounds with bar graph made of gold coins

Product Portfolio Graph Diagram Powerpoint Slides
This is a product portfolio graph diagram powerpoint slides. This is a eight stage process. The stages in this process are revenue, launch, growth, maturity, decline.
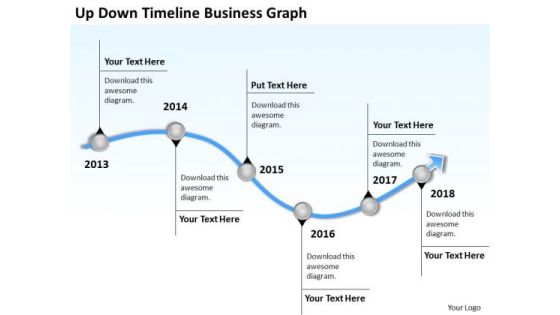
Business Analysis Diagrams PowerPoint Presentations Graph Templates
We present our business analysis diagrams powerpoint presentations graph templates.Download and present our Curves and Lines PowerPoint Templates because Your audience will believe you are the cats whiskers. Present our Business PowerPoint Templates because Our PowerPoint Templates and Slides will effectively help you save your valuable time. They are readymade to fit into any presentation structure. Present our Business PowerPoint Templates because Our PowerPoint Templates and Slides will give good value for money. They also have respect for the value of your time. Use our Arrows PowerPoint Templates because It will get your audience in sync. Present our Process and Flows PowerPoint Templates because It can Conjure up grand ideas with our magical PowerPoint Templates and Slides. Leave everyone awestruck by the end of your presentation.Use these PowerPoint slides for presentations relating to 3d, account, accounting, annual, balance, business, chart, commerce, crisis, data,earnings, economics, economy, exchange, figures, finance, financial, graph,graphic, growth, illustration, index, information, investment, list, line,management,market, marketing, money, monitoring, numbers, office, paperwork, plan, price,printout, report, research, sale, statistical, statistics, stock, success, tax, trade,work. The prominent colors used in the PowerPoint template are Blue light, Gray, White.
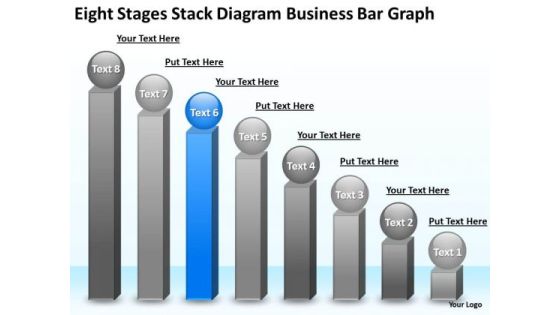
Business PowerPoint Presentations Bar Graph Plan Slides
We present our business powerpoint presentations bar graph plan Slides.Present our Business PowerPoint Templates because It will Raise the bar of your Thoughts. They are programmed to take you to the next level. Download our Spheres PowerPoint Templates because You can Channelise the thoughts of your team with our PowerPoint Templates and Slides. Urge them to focus on the goals you have set. Download our Competition PowerPoint Templates because Our PowerPoint Templates and Slides will let you Leave a lasting impression to your audiences. They possess an inherent longstanding recall factor. Present our Shapes PowerPoint Templates because It will get your audience in sync. Use our Success PowerPoint Templates because Our PowerPoint Templates and Slides will let you Leave a lasting impression to your audiences. They possess an inherent longstanding recall factor.Use these PowerPoint slides for presentations relating to bar, graph, statistics, economy, render, success, representation, diagram, graphic, achievment, obstruction, chevron, accounting, finances, energy eco, steps, figure, tall, barrier, strategy, ladder, up, planning, high, climb, stripes, growth, maintenance, profit, successful, repair, return, gradient, sustainability, financial, construction, upwards, increasing. The prominent colors used in the PowerPoint template are Blue, Gray, White.
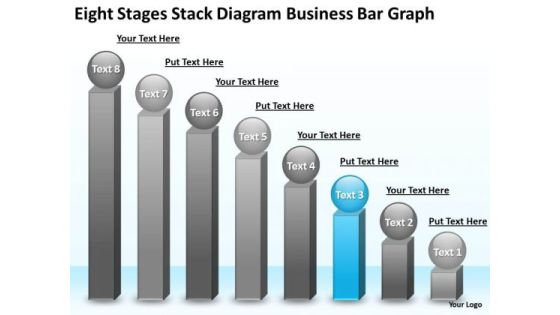
PowerPoint Presentations Bar Graph Business Plan Templates
We present our powerpoint presentations bar graph business plan templates.Use our Finance PowerPoint Templates because Our PowerPoint Templates and Slides are created by a hardworking bunch of busybees. Always flitting around with solutions gauranteed to please. Download our Leadership PowerPoint Templates because Our PowerPoint Templates and Slides are endowed to endure. Ideas conveyed through them will pass the test of time. Use our Business PowerPoint Templates because Your ideas provide food for thought. Our PowerPoint Templates and Slides will help you create a dish to tickle the most discerning palate. Use our Success PowerPoint Templates because Our PowerPoint Templates and Slides will provide you a launch platform. Give a lift off to your ideas and send them into orbit. Use our Spheres PowerPoint Templates because You can Bait your audience with our PowerPoint Templates and Slides. They will bite the hook of your ideas in large numbers.Use these PowerPoint slides for presentations relating to Concepts, Leadership, Success, Human, Achievement, Wink, Business, Ball, Three-Dimensional, Sign, Template, Diagram, Change, Character, Graphic, Stock, Development, Shape, Graph, Finances, Steps, Chart, Sphere, Examining, Up, Nice, Planning, Face, Growth, Person, Progress, Increases, Improvement, Image, Mimicry, Financial, Staircase. The prominent colors used in the PowerPoint template are Blue, Gray, Black.

Business Capital Investors Graph Powerpoint Presentation
This is a business capital investors graph powerpoint presentation. This is a five stage process. The stages in this process are public, venture capital, seed capital, angles, grants f and f$.

Implementing Client Onboarding Process Financial Topics PDF
Whether you have daily or monthly meetings, a brilliant presentation is necessary. Implementing Client Onboarding Process Financial Topics PDF can be your best option for delivering a presentation. Represent everything in detail using Implementing Client Onboarding Process Financial Topics PDF and make yourself stand out in meetings. The template is versatile and follows a structure that will cater to your requirements. All the templates prepared by Slidegeeks are easy to download and edit. Our research experts have taken care of the corporate themes as well. So, give it a try and see the results.

Financial Budgeting And Assessment Dashboard With Revenue Variance Designs PDF
This slide shows the dashboard representing financial analysis and planning of an organization. It highlights the set revenue targets and actual revenue with the help of graphs. Showcasing this set of slides titled Financial Budgeting And Assessment Dashboard With Revenue Variance Designs PDF. The topics addressed in these templates are YTD Revenue, Revenue Delta, Revenue Variance. All the content presented in this PPT design is completely editable. Download it and make adjustments in color, background, font etc. as per your unique business setting.

Bar Graph For Statistical Analysis Powerpoint Template
Our above PPT slide contains computer screen on a desk displaying bar graph. This PowerPoint template may be used to display statistical analysis. This template is designed to attract the attention of your audience.
Dollar Graph Business PowerPoint Template 0610
Business Diagram it is isolated on a white background

Spain Map With Growth Graph Powerpoint Slides
This PowerPoint template displays Spain map with growth graph. This PPT template can be used in business presentations to depict economic growth of country. This slide can also be used by school students for educational projects.

Taxi Aggregator Financial Highlights Summary PDF
This slide provides the glimpse about the financial highlights which focuses on sales, gross margin, net profit, etc. Deliver an awe inspiring pitch with this creative taxi aggregator financial highlights summary pdf bundle. Topics like financial highlights can be discussed with this completely editable template. It is available for immediate download depending on the needs and requirements of the user.

Six Years Financial Business Forecast Infographics PDF
This slide shows business financial plan with six years for further planning and budgeting. It include revenue and expenditure from royalty fees, commission, rent, etc. Showcasing this set of slides titled Six Years Financial Business Forecast Infographics PDF. The topics addressed in these templates are Six Years Financial, Business Forecast. All the content presented in this PPT design is completely editable. Download it and make adjustments in color, background, font etc. as per your unique business setting.
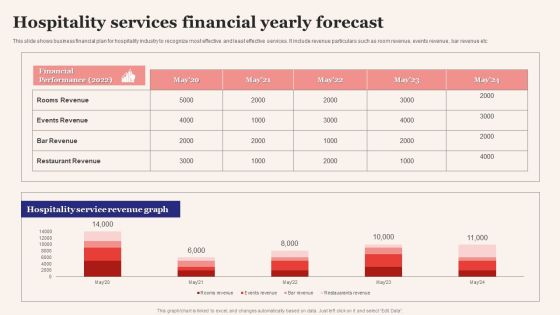
Hospitality Services Financial Yearly Forecast Elements PDF
This slide shows business financial plan for hospitality industry to recognize most effective and least effective services. It include revenue particulars such as room revenue, events revenue, bar revenue etc. Showcasing this set of slides titled Hospitality Services Financial Yearly Forecast Elements PDF. The topics addressed in these templates are Hospitality Services, Financial Yearly Forecast. All the content presented in this PPT design is completely editable. Download it and make adjustments in color, background, font etc. as per your unique business setting.

Deal Assessment Financial Ppt Professional Outline PDF
Deliver and pitch your topic in the best possible manner with this deal assessment financial ppt professional outline pdf. Use them to share invaluable insights on financial and impress your audience. This template can be altered and modified as per your expectations. So, grab it now.
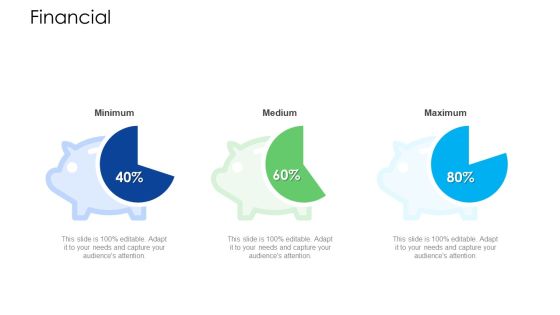
Logistics Management Services Financial Microsoft PDF
Deliver an awe inspiring pitch with this creative logistics management services financial microsoft pdf bundle. Topics like financial can be discussed with this completely editable template. It is available for immediate download depending on the needs and requirements of the user.

Financial Performance Comparison With Competitors Rules PDF
This slide provides the companys financials comparison with competitors based on total deposit, disbursement, advances, and current and saving accounts. Deliver an awe-inspiring pitch with this creative financial performance comparison with competitors rules pdf. bundle. Topics like financial performance comparison with competitors can be discussed with this completely editable template. It is available for immediate download depending on the needs and requirements of the user.

Chief Executive Dashboards With Financial Topics PDF
This slide represents the dashboard for the CEO to track the global financial performance of the organization. It includes key performance indicators such as revenue, quick ratio, short term assets etc. Showcasing this set of slides titled Chief Executive Dashboards With Financial Topics PDF. The topics addressed in these templates are Short Term Assets, Global Financial Performance, Debt Equity. All the content presented in this PPT design is completely editable. Download it and make adjustments in color, background, font etc. as per your unique business setting.

Enterprise Consumer Technology Management Financial Overview Fy 18 Demonstration PDF
The purpose of the following slide is to analyze the financial performance of the organization. The provided graph highlight the revenues, Gross profit and net profit margin of the organization for the year 2016,17,18 and 19. Take your projects to the next level with our ultimate collection of Enterprise Consumer Technology Management Financial Overview Fy 18 Demonstration PDF. Slidegeeks has designed a range of layouts that are perfect for representing task or activity duration, keeping track of all your deadlines at a glance. Tailor these designs to your exact needs and give them a truly corporate look with your own brand colors they will make your projects stand out from the rest.

Annual Financial Budget Result Evaluation Brochure PDF
This slide signifies yearly financial budget result comparison on expense and income. It includes company revenue generated through sales, investment return and cost like electricity bills, employees etc.Showcasing this set of slides titled Annual Financial Budget Result Evaluation Brochure PDF. The topics addressed in these templates are Interest Commission, Return Investment, Advertising Promotion. All the content presented in this PPT design is completely editable. Download it and make adjustments in color, background, font etc. as per your unique business setting.

Quarterly Financial Performance Evaluation Report Template PDF
This slide showcase quarterly financial performance measurement and analysis summary charts. It highlights the revenue chart, gross profit chart, profit before tax chart, and net profit chart. Showcasing this set of slides titled Quarterly Financial Performance Evaluation Report Template PDF. The topics addressed in these templates are Revenue, Gross Profit, Profit Before Tax . All the content presented in this PPT design is completely editable. Download it and make adjustments in color, background, font etc. as per your unique business setting.
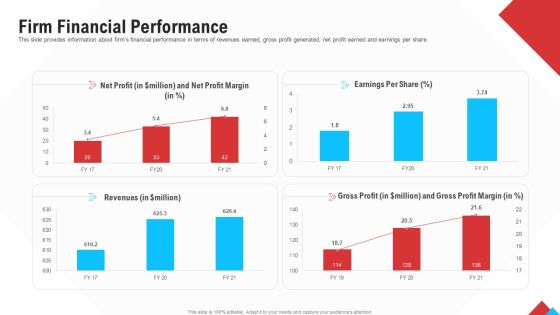
Reform Endgame Firm Financial Performance Microsoft PDF
This slide provides information about firms financial performance in terms of revenues earned, gross profit generated, net profit earned and earnings per share. Deliver an awe inspiring pitch with this creative reform endgame firm financial performance microsoft pdf bundle. Topics like net profit, revenues, earnings per share, gross profit can be discussed with this completely editable template. It is available for immediate download depending on the needs and requirements of the user.

Annual Business Financial Summary Dashboard Themes PDF
This slide shows annual financial report dashboard of company to monitor yearly business performance. It includes various indicators such as revenue, net profits, costs and breakdown of cost. Showcasing this set of slides titled Annual Business Financial Summary Dashboard Themes PDF. The topics addressed in these templates are Revenue, Costs, Net Profit. All the content presented in this PPT design is completely editable. Download it and make adjustments in color, background, font etc. as per your unique business setting.
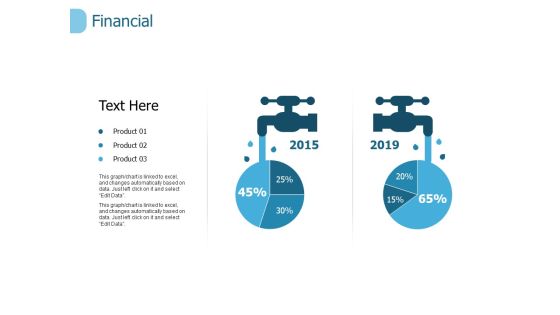
Financial Management Ppt PowerPoint Presentation Portfolio Templates
This is a financial management ppt powerpoint presentation portfolio templates. The topics discussed in this diagram are finance, marketing, analysis, investment, management. This is a completely editable PowerPoint presentation, and is available for immediate download.
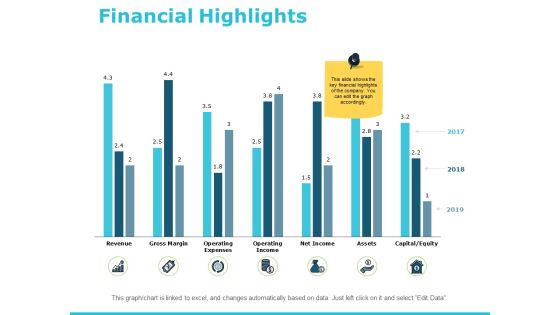
Financial Highlights Ppt PowerPoint Presentation Layouts Deck
This is a financial highlights ppt powerpoint presentation layouts deck. The topics discussed in this diagram are finance, marketing, management, investment, analysis. This is a completely editable PowerPoint presentation, and is available for immediate download.
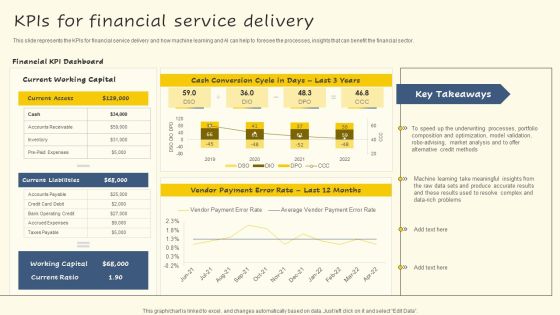
Kpis For Financial Service Delivery Background PDF
This slide represents the KPIs for financial service delivery and how machine learning and AI can help to foresee the processes, insights that can benefit the financial sector. If you are looking for a format to display your unique thoughts, then the professionally designed Kpis For Financial Service Delivery Background PDF is the one for you. You can use it as a Google Slides template or a PowerPoint template. Incorporate impressive visuals, symbols, images, and other charts. Modify or reorganize the text boxes as you desire. Experiment with shade schemes and font pairings. Alter, share or cooperate with other people on your work. Download Kpis For Financial Service Delivery Background PDF and find out how to give a successful presentation. Present a perfect display to your team and make your presentation unforgettable.
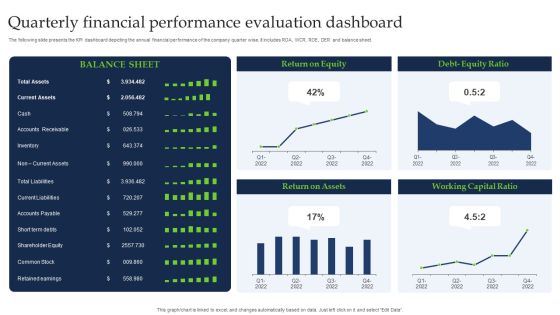
Quarterly Financial Performance Evaluation Dashboard Guidelines PDF
The following slide presents the KPI dashboard depicting the annual financial performance of the company quarter wise. It includes ROA, WCR, ROE, DER and balance sheet. Pitch your topic with ease and precision using this Quarterly Financial Performance Evaluation Dashboard Guidelines PDF. This layout presents information on Current Assets, Shareholder Equity, Common Stock. It is also available for immediate download and adjustment. So, changes can be made in the color, design, graphics or any other component to create a unique layout.

Corporate Financial Performance Tracking Dashboard Diagrams PDF
This slide provides information regarding dashboard utilized by firm to monitor financial performance. The performance is tracked through revenues generated, vendors associated, profit generated, etc. If you are looking for a format to display your unique thoughts, then the professionally designed Corporate Financial Performance Tracking Dashboard Diagrams PDF is the one for you. You can use it as a Google Slides template or a PowerPoint template. Incorporate impressive visuals, symbols, images, and other charts. Modify or reorganize the text boxes as you desire. Experiment with shade schemes and font pairings. Alter, share or cooperate with other people on your work. Download Corporate Financial Performance Tracking Dashboard Diagrams PDF and find out how to give a successful presentation. Present a perfect display to your team and make your presentation unforgettable.

Corporate Financial Performance Tracking Dashboard Elements PDF
This slide provides information regarding dashboard utilized by firm to monitor financial performance. The performance is tracked through revenues generated, vendors associated, profit generated, etc. Whether you have daily or monthly meetings, a brilliant presentation is necessary. Corporate Financial Performance Tracking Dashboard Elements PDF can be your best option for delivering a presentation. Represent everything in detail using Corporate Financial Performance Tracking Dashboard Elements PDF and make yourself stand out in meetings. The template is versatile and follows a structure that will cater to your requirements. All the templates prepared by Slidegeeks are easy to download and edit. Our research experts have taken care of the corporate themes as well. So, give it a try and see the results.

Business Executive Financial Performance Report Download PDF
This slide showcase the executive financial summary report which includes the last four quarters EBITDA calculation and major expense budget variance. It includes elements such as cost of services, operating expenses, depreciation, advertisement, marketing etc.depreciation, advertisement, marketing etc. Showcasing this set of slides titled Business Executive Financial Performance Report Download PDF. The topics addressed in these templates are Revenue, Cost Services, Operating Expenses. All the content presented in this PPT design is completely editable. Download it and make adjustments in color, background, font etc. as per your unique business setting.
Monthly Financial Performance Outcome Reporting Icons PDF
This slide showcases a report showing monthly results financial performance to ensure constant revenue growth. It includes key components such as gross profit margin, operating expenses ratio, operating profit margin, net profit margin, earning before interest and taxes, etc. Showcasing this set of slides titled Monthly Financial Performance Outcome Reporting Icons PDF. The topics addressed in these templates are Operating Expenses, Income Statement, Operating Expenses Ratio. All the content presented in this PPT design is completely editable. Download it and make adjustments in color, background, font etc. as per your unique business setting.

Financial Business Application Development Playbook Pictures PDF
If you are looking for a format to display your unique thoughts, then the professionally designed Financial Business Application Development Playbook Pictures PDF is the one for you. You can use it as a Google Slides template or a PowerPoint template. Incorporate impressive visuals, symbols, images, and other charts. Modify or reorganize the text boxes as you desire. Experiment with shade schemes and font pairings. Alter, share or cooperate with other people on your work. Download Financial Business Application Development Playbook Pictures PDF and find out how to give a successful presentation. Present a perfect display to your team and make your presentation unforgettable.
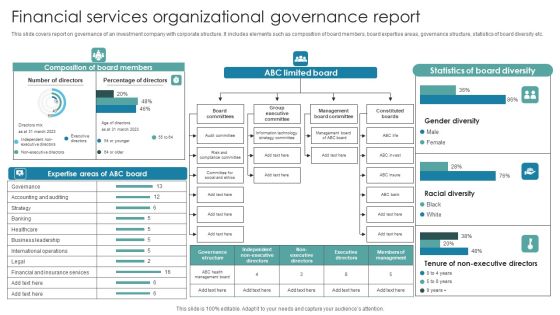
Financial Services Organizational Governance Report Summary PDF
This slide covers report on governance of an investment company with corporate structure. It includes elements such as composition of board members, board expertise areas, governance structure, statistics of board diversity etc. Pitch your topic with ease and precision using this Financial Services Organizational Governance Report Summary PDF. This layout presents information on Strategy, Business Leadership, Financial. It is also available for immediate download and adjustment. So, changes can be made in the color, design, graphics or any other component to create a unique layout.
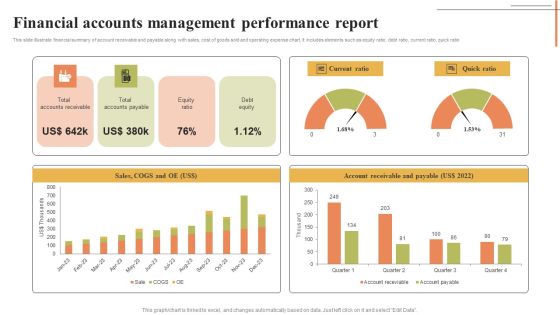
Financial Accounts Management Performance Report Mockup PDF
This slide illustrate financial summary of account receivable and payable along with sales, cost of goods sold and operating expense chart. It includes elements such as equity ratio, debt ratio, current ratio, quick ratio. Showcasing this set of slides titled Financial Accounts Management Performance Report Mockup PDF. The topics addressed in these templates are Current Ratio, Quick Ratio, Account Receivable Payable. All the content presented in this PPT design is completely editable. Download it and make adjustments in color, background, font etc. as per your unique business setting.
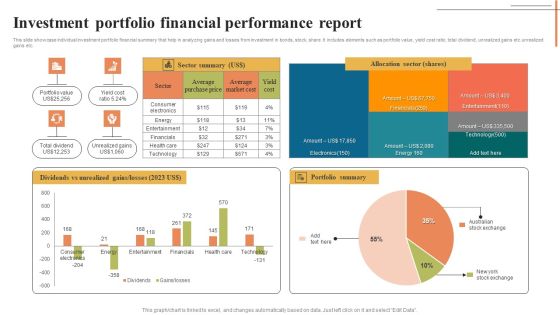
Investment Portfolio Financial Performance Report Pictures PDF
This slide showcase individual investment portfolio financial summary that help in analyzing gains and losses from investment in bonds, stock, share. It includes elements such as portfolio value, yield cost ratio, total dividend, unrealized gains etc.unrealized gains etc. Showcasing this set of slides titled Investment Portfolio Financial Performance Report Pictures PDF. The topics addressed in these templates are Allocation Sector, Portfolio Summary, Dividends. All the content presented in this PPT design is completely editable. Download it and make adjustments in color, background, font etc. as per your unique business setting.
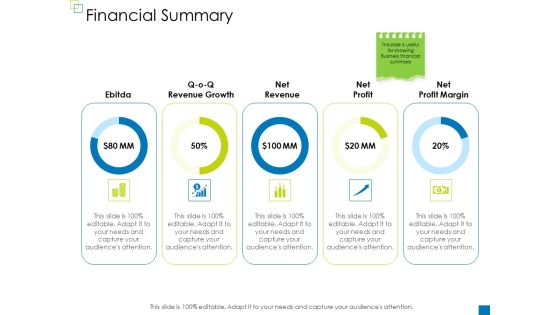
Enterprise Management Financial Summary Formats PDF
Deliver and pitch your topic in the best possible manner with this enterprise management financial summary formats pdf. Use them to share invaluable insights on revenue growth, net revenue, net profit, net profit margin and impress your audience. This template can be altered and modified as per your expectations. So, grab it now.

Enterprise Governance Financial Summary Demonstration PDF
Deliver an awe-inspiring pitch with this creative enterprise governance financial summary demonstration pdf bundle. Topics like revenue growth, net revenue, net profit, net profit margin can be discussed with this completely editable template. It is available for immediate download depending on the needs and requirements of the user.

Business Functions Administration Financial Summary Guidelines PDF
Deliver an awe-inspiring pitch with this creative business functions administration financial summary guidelines pdf. bundle. Topics like revenue growth, net revenue, net profit, net profit margin can be discussed with this completely editable template. It is available for immediate download depending on the needs and requirements of the user.

Enterprise Governance Financial Planning Template Topics PDF
Deliver and pitch your topic in the best possible manner with this enterprise governance financial planning template topics pdf. Use them to share invaluable insights on expenses, planning, gross profit, revenues, services and impress your audience. This template can be altered and modified as per your expectations. So, grab it now.

Operational And Financial Overview Brochure PDF
The slide provides a brief overview of the companys operations introduction, mission and vision statement and financials Revenue, EBIT, Net income and Non to Performing Assets. Deliver and pitch your topic in the best possible manner with this operational and financial overview brochure pdf. Use them to share invaluable insights on quality, services, customer and impress your audience. This template can be altered and modified as per your expectations. So, grab it now.
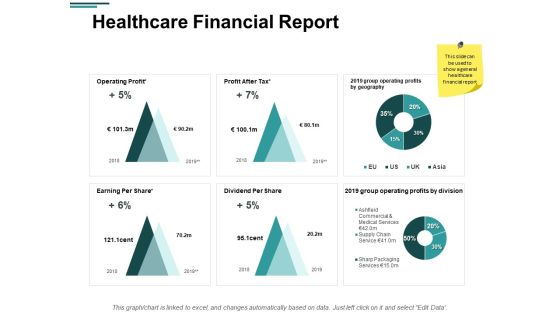
Healthcare Financial Report Ppt PowerPoint Presentation Template
Presenting this set of slides with name healthcare financial report ppt powerpoint presentation template. The topics discussed in these slides are finance, marketing, management, investment, analysis. This is a completely editable PowerPoint presentation and is available for immediate download. Download now and impress your audience.
Financial Highlights Ppt PowerPoint Presentation Icon Templates
Presenting this set of slides with name financial highlights ppt powerpoint presentation icon templates. The topics discussed in these slides are profit, loss. This is a completely editable PowerPoint presentation and is available for immediate download. Download now and impress your audience.

Audit For Financial Investment 10 Template PDF
Deliver and pitch your topic in the best possible manner with this audit for financial investment 10 template pdf. Use them to share invaluable insights on return on assets, return on investment, return on equity and impress your audience. This template can be altered and modified as per your expectations. So, grab it now.

 Home
Home