Financial Graphs
Icon Of BCWP Graph For Project Management Topics PDF
Persuade your audience using this Icon Of BCWP Graph For Project Management Topics PDF This PPT design covers one stage, thus making it a great tool to use. It also caters to a variety of topics including Icon BCWP, Graph Project, Management Download this PPT design now to present a convincing pitch that not only emphasizes the topic but also showcases your presentation skills.

Doughnut Graph Icon Highlighting IT Team Structure Structure PDF
Presenting Doughnut Graph Icon Highlighting IT Team Structure Structure PDF to dispense important information. This template comprises four stages. It also presents valuable insights into the topics including Doughnut Graph, Icon Highlighting, IT Team Structure. This is a completely customizable PowerPoint theme that can be put to use immediately. So, download it and address the topic impactfully.

Doughnut Graph Icon With Dollar Symbol Topics PDF
Persuade your audience using this Doughnut Graph Icon With Dollar Symbol Topics PDF. This PPT design covers four stages, thus making it a great tool to use. It also caters to a variety of topics including Doughnut Graph, Icon, Dollar Symbol. Download this PPT design now to present a convincing pitch that not only emphasizes the topic but also showcases your presentation skills.

Cost For Quality Graph Ppt PowerPoint Presentation Ideas Files
This is a cost for quality graph ppt powerpoint presentation ideas files. This is a four stage process. The stages in this process are external failure, internal failure, prevention, appraisal, quality improvement.

Bar Graph For Business Growth Steps Powerpoint Slides
This PowerPoint template contains design of bar graph with icons. You may download this slide to display strategy steps for business growth. You can easily customize this template to make it more unique as per your need.

Bar Graph With Line Chart For Analysis Powerpoint Slides
This PowerPoint template contains design of bar graph with line chart. You may download this slide to display strategy steps for business growth. You can easily customize this template to make it more unique as per your need.

Bar Graph With Yearly Statistical Analysis Powerpoint Slides
This PowerPoint template contains diagram of bar graph with yearly percentage ratios. You may download this slide to display statistical analysis. You can easily customize this template to make it more unique as per your need.
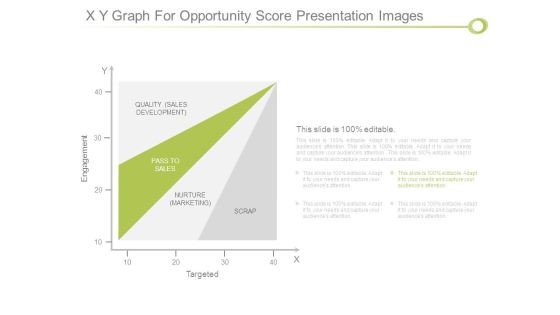
X Y Graph For Opportunity Score Presentation Images
This is a x y graph for opportunity score presentation images. This is a one stage process. The stages in this process are engagement, quality sales development, pass to sales, nurture marketing, scrap, targeted.

Clustered Column Graph Finance Investment Ppt PowerPoint Presentation Outline Icons
This is a clustered column graph finance investment ppt powerpoint presentation outline icons. This is a three stage process. The stages in this process are finance, investment, business, marketing, analysis.

Clustered Bar Graph Ppt PowerPoint Presentation Pictures Example File
This is a clustered bar graph ppt powerpoint presentation pictures example file. This is a two stage process. The stages in this process are finance, marketing, management, investment, analysis.

Bar Graph Finance Ppt PowerPoint Presentation Infographics Designs Download
This is a bar graph finance ppt powerpoint presentation infographics designs download. This is a three stage process. The stages in this process are finance, marketing, management, investment, analysis.

Bar Graph Employee Value Proposition Ppt PowerPoint Presentation File Layout
This is a bar graph employee value proposition ppt powerpoint presentation file layout. This is a three stage process. The stages in this process are business, management, strategy, analysis, marketing.

Commodities Exchange Basics Ppt Powerpoint Presentation Diagram Graph Charts
This is a commodities exchange basics ppt powerpoint presentation diagram graph charts. This is a four stage process. The stages in this process are finance, marketing, management, investment, analysis.

Bar Graph Marketing Process Ppt PowerPoint Presentation Ideas Example Introduction
This is a bar graph marketing process ppt powerpoint presentation ideas example introduction. This is a three stage process. The stages in this process are finance, management, strategy, analysis, marketing.

Column Chart And Graph Ppt PowerPoint Presentation File Introduction
This is a column chart and graph ppt powerpoint presentation file introduction. This is a three stage process. The stages in this process are finance, marketing, management, investment, analysis.

Scatter Bubble Chart Graph Ppt PowerPoint Presentation Infographic Template Maker
This is a scatter bubble chart graph ppt powerpoint presentation infographic template maker. This is a two stage process. The stages in this process are finance, marketing, management, investment, analysis.

Donut Pie Chart Graph Ppt PowerPoint Presentation File Styles
This is a donut pie chart graph ppt powerpoint presentation file styles. This is a three stage process. The stages in this process are finance, marketing, management, investment, analysis.

Stacked Bar Graph Ppt PowerPoint Presentation Portfolio Slide Portrait
This is a stacked bar graph ppt powerpoint presentation portfolio slide portrait. This is a three stage process. The stages in this process are finance, marketing, management, investment, analysis.

Clustered Bar Graph Ppt PowerPoint Presentation Model Background Designs
This is a clustered bar graph ppt powerpoint presentation model background designs. This is a three stage process. The stages in this process are finance, marketing, management, investment, analysis.

Donut Pie Chart Graph Ppt PowerPoint Presentation Ideas Guidelines
This is a donut pie chart graph ppt powerpoint presentation ideas guidelines. This is a three stage process. The stages in this process are finance, marketing, management, investment, analysis.

Clustered Column Line Graph Ppt PowerPoint Presentation File Clipart
This is a clustered column line graph ppt powerpoint presentation file clipart. This is a three stage process. The stages in this process are finance, marketing, management, investment, analysis.

Combo Chart Graph Ppt PowerPoint Presentation Infographic Template Layout Ideas
This is a combo chart graph ppt powerpoint presentation infographic template layout ideas. This is a three stage process. The stages in this process are finance, marketing, analysis, investment, million.

Clustered Column Line Graph Ppt PowerPoint Presentation Inspiration Deck
This is a clustered column line graph ppt powerpoint presentation inspiration deck. This is a three stage process. The stages in this process are finance, marketing, analysis, investment, million.
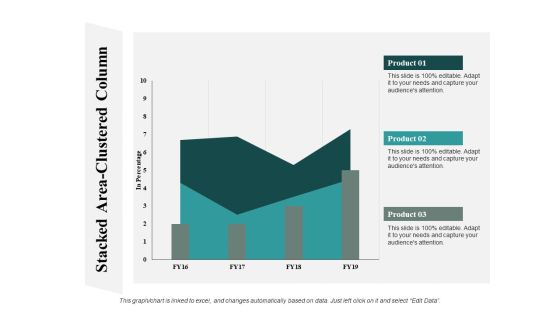
Stacked Area Clustered Column Graph Ppt PowerPoint Presentation Summary Guide
This is a stacked area clustered column graph ppt powerpoint presentation summary guide. This is a three stage process. The stages in this process are finance, marketing, analysis, investment, million.

Combo Chart Graph Ppt PowerPoint Presentation Gallery Designs Download
This is a combo chart graph ppt powerpoint presentation gallery designs download. This is a three stage process. The stages in this process are finance, marketing, analysis, investment, million.

Area Chart Graph Ppt PowerPoint Presentation Professional Format Ideas
This is a column chart graph ppt powerpoint presentation slides file formats. This is a stage three process. The stages in this process are finance, marketing, analysis, investment, million.
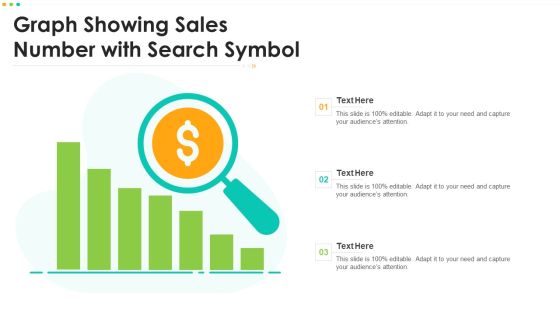
Graph Showing Sales Number With Search Symbol Professional PDF
Persuade your audience using this Graph Showing Sales Number With Search Symbol Professional PDF. This PPT design covers three stages, thus making it a great tool to use. It also caters to a variety of topics including Graph Showing Sales Number With Search Symbol. Download this PPT design now to present a convincing pitch that not only emphasizes the topic but also showcases your presentation skills.
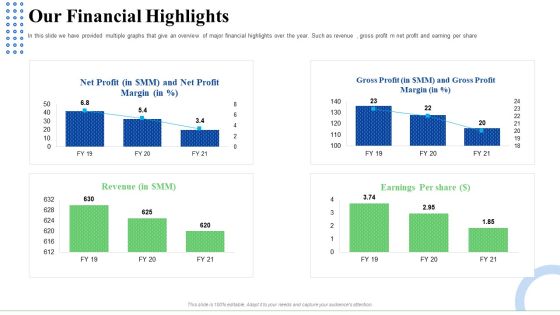
Strategic Plan For Business Expansion And Growth Our Financial Highlights Mockup PDF
In this slide we have provided multiple graphs that give an overview of major financial highlights over the year. Such as revenue , gross profit m net profit and earning per share. Deliver an awe inspiring pitch with this creative strategic plan for business expansion and growth our financial highlights mockup pdf bundle. Topics like revenue, gross profit, net profit can be discussed with this completely editable template. It is available for immediate download depending on the needs and requirements of the user.

Tactical Planning For Marketing And Commercial Advancement Our Financial Highlights Download PDF
In this slide we have provided multiple graphs that give an overview of major financial highlights over the year. Such as revenue , gross profit m net profit and earning per share. Deliver an awe inspiring pitch with this creative tactical planning for marketing and commercial advancement our financial highlights download pdf bundle. Topics like revenue, gross profit, net profit can be discussed with this completely editable template. It is available for immediate download depending on the needs and requirements of the user.
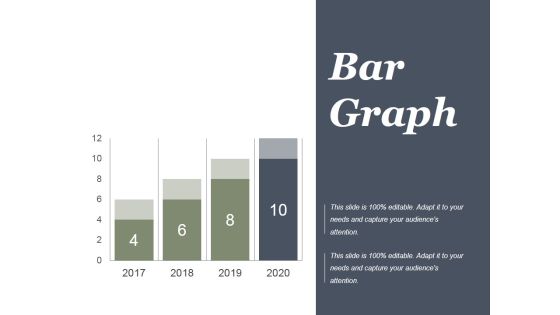
Project Performance Bar Graph Ppt PowerPoint Presentation Outline
This is a project performance bar graph ppt powerpoint presentation outline. This is a four stage process. The stages in this process are finance, year, business, marketing, future, marketing.

Column Chart Graph Ppt PowerPoint Presentation Slides File Formats
This is a combo chart bar ppt powerpoint presentation slides portfolio. This is a three stage process. The stages in this process are finance, marketing, analysis, investment, million.

Growth Arrow On Bar Graph Infographics Powerpoint Template
This PowerPoint template has been designed with growth arrow on bar graph. You may download this diagram slide to display growth and progress concepts. Illustrate your plans to your listeners with this impressive template.

Images Of Business People 3d Men With Bar Graph Making Effort PowerPoint Templates
We present our images of business people 3d men with bar graph making effort PowerPoint templates.Use our People PowerPoint Templates because You canTake a leap off the starting blocks with our PowerPoint Templates and Slides. They will put you ahead of the competition in quick time. Present our Business PowerPoint Templates because our PowerPoint Templates and Slides are the string of your bow. Fire of your ideas and conquer the podium. Use our Marketing PowerPoint Templates because They will Put the wind in your sails. Skim smoothly over the choppy waters of the market. Use our Teamwork PowerPoint Templates because Our PowerPoint Templates and Slides will steer your racing mind. Hit the right buttons and spur on your audience. Download and present our Shapes PowerPoint Templates because Our PowerPoint Templates and Slides will let you Hit the target. Go the full distance with ease and elan.Use these PowerPoint slides for presentations relating to 3d, abstract, accounting, achievement, bar graph, business, cartoon, concept, financial, goal, gold, golden, graph, growth, help, icon, lifting, bar, market, meeting, men, partnership, people, presentation, profits, progress, report, strength, team, teamwork. The prominent colors used in the PowerPoint template are Green, Blue, White.
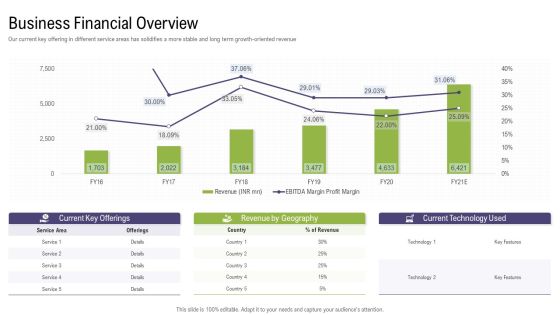
Mergers And Acquisitions Synergy Business Financial Overview Template PDF
Deliver an awe-inspiring pitch with this creative mergers and acquisitions synergy business financial overview template pdf. bundle. Topics like current key offerings, current key offerings, current technology used can be discussed with this completely editable template. It is available for immediate download depending on the needs and requirements of the user.
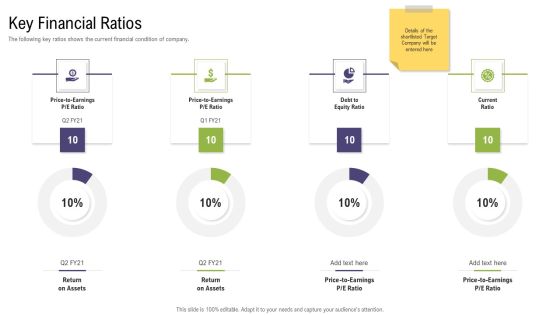
Mergers And Acquisitions Synergy Key Financial Ratios Designs PDF
Deliver and pitch your topic in the best possible manner with this mergers and acquisitions synergy key financial ratios designs pdf. Use them to share invaluable insights on Price to earnings p or e ratio debt to, equity ratio, current ratio, return on assets, return on assets and impress your audience. This template can be altered and modified as per your expectations. So, grab it now.

Financial Growth Business PowerPoint Templates And PowerPoint Backgrounds 0711
Microsoft PowerPoint Template and Background with finance graph depicting growth

Annual Financial Data Insights Dashboard Icon Introduction PDF
Showcasing this set of slides titled Annual Financial Data Insights Dashboard Icon Introduction PDF. The topics addressed in these templates are Annual Financial, Data Insights, Dashboard. All the content presented in this PPT design is completely editable. Download it and make adjustments in color, background, font etc. as per your unique business setting.

Annual Financial Data With KPI Insights Dashboard Structure PDF
The following slides highlights the financial kpas in summarized form to evaluate companys annual operating performance. It includes metrics such as gross, operating and net profit margin, income statement, target versus actual EBIT etc. Pitch your topic with ease and precision using this Annual Financial Data With KPI Insights Dashboard Structure PDF. This layout presents information on Gross Profit Margin, Operating Profit Margin, Net Profit Margin. It is also available for immediate download and adjustment. So, changes can be made in the color, design, graphics or any other component to create a unique layout.
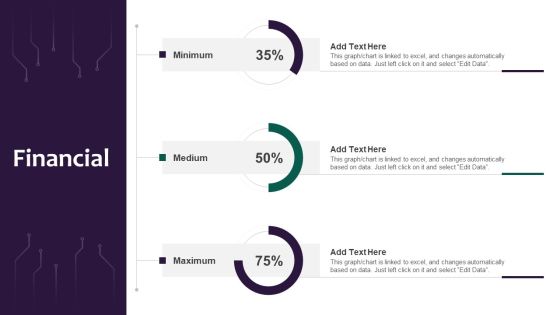
Information Systems Security And Risk Management Plan Financial Professional PDF
Crafting an eye catching presentation has never been more straightforward. Let your presentation shine with this tasteful yet straightforward Information Systems Security And Risk Management Plan Financial Professional PDF template. It offers a minimalistic and classy look that is great for making a statement. The colors have been employed intelligently to add a bit of playfulness while still remaining professional. Construct the ideal Information Systems Security And Risk Management Plan Financial Professional PDF that effortlessly grabs the attention of your audience Begin now and be certain to wow your customers.

Post Implementation Other Operation And Financial Kpis Summary PDF
The slide provides five years graphs 2022F to 2026F forecasted number of major KPIs key performance indicators, that might help to track the performance of ABC Railway. Covered KPIs include Revenue, Total Passengers, operating income, customer satisfaction rate etc.Deliver and pitch your topic in the best possible manner with this post implementation other operation and financial KPIs summary pdf. Use them to share invaluable insights on total passengers, operating income, revenue, 2022 to 2026 and impress your audience. This template can be altered and modified as per your expectations. So, grab it now.

Post Implementation Other Operation And Financial Kpis Inspiration PDF
The slide provides five years graphs 2022F-2026F forecasted number of major KPIs key performance indicators, that might help to track the performance of ABC Railway. Covered KPIs include Revenue, Total Passengers, operating income, customer satisfaction rate etc. Deliver and pitch your topic in the best possible manner with this post implementation other operation and financial kpis inspiration pdf. Use them to share invaluable insights on revenue, operating income, customer satisfaction and impress your audience. This template can be altered and modified as per your expectations. So, grab it now.
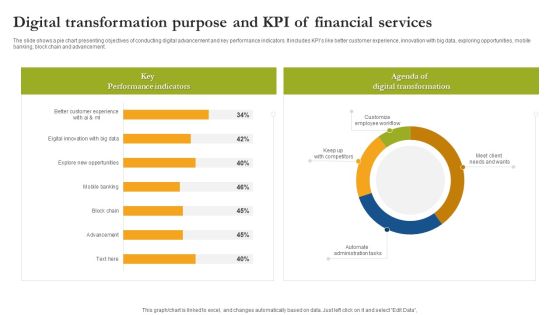
Digital Transformation Purpose And Kpi Of Financial Services Guidelines PDF
The slide shows a pie chart presenting objectives of conducting digital advancement and key performance indicators. It includes KPIs like better customer experience, innovation with big data, exploring opportunities, mobile banking, block chain and advancement. Showcasing this set of slides titled Digital Transformation Purpose And Kpi Of Financial Services Guidelines PDF. The topics addressed in these templates are Key Performance Indicators Digital Transformation, Customize Employee Workflow. All the content presented in this PPT design is completely editable. Download it and make adjustments in color, background, font etc. as per your unique business setting.

Graph Depicting Sales Representative Contribution To Revenue Growth Graphics PDF
Showcasing this set of slides titled Graph Depicting Sales Representative Contribution To Revenue Growth Graphics PDF. The topics addressed in these templates are Graph Depicting Sales, Revenue Growth. All the content presented in this PPT design is completely editable. Download it and make adjustments in color, background, font etc. as per your unique business setting.

Graph Representing Revenue Growth In B2b Sales Background PDF
Pitch your topic with ease and precision using this Graph Representing Revenue Growth In B2b Sales Background PDF. This layout presents information on Graph Representing, Revenue Growth, Sales. It is also available for immediate download and adjustment. So, changes can be made in the color, design, graphics or any other component to create a unique layout.
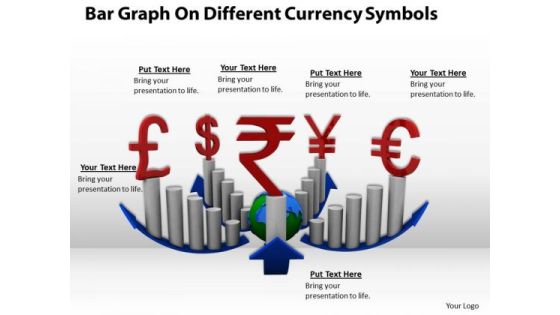
Stock Photo Bar Graph For Currency And Finance PowerPoint Slide
This image slide displays bar graphs with different currency symbols. This image has been designed with graphic of bar graphs, blue colored growth arrow and symbols of different currencies. Use this image slide, in your presentations to express views on finance, growth and achievements. This image slide may also be used to exhibit finance accounts in your presentations. This image slide will enhance the quality of your presentations.
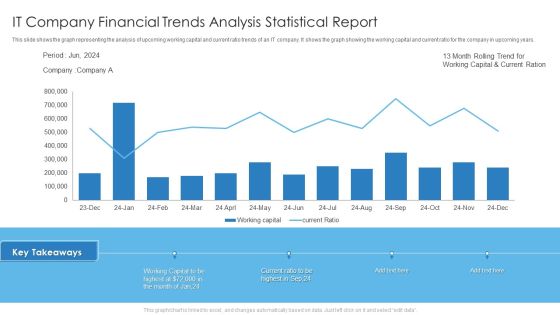
IT Company Financial Trends Analysis Statistical Report Slides PDF
This slide shows the graph representing the analysis of upcoming working capital and current ratio trends of an IT company. It shows the graph showing the working capital and current ratio for the company in upcoming years. Deliver and pitch your topic in the best possible manner with this IT Company Financial Trends Analysis Statistical Report Slides PDF. Use them to share invaluable insights on It Company Financial, Trends Analysis Statistical Report and impress your audience. This template can be altered and modified as per your expectations. So, grab it now.

Inventory Turnover Financial Ratios Chart Conversion Portrait PDF
This slide illustrates graph for inventory turnover ratio that can help company to analyze efficiency of inventory management. It showcases ratio graph comparison of 4 companies for a period of last 6 years Pitch your topic with ease and precision using this inventory turnover financial ratios chart conversion portrait pdf. This layout presents information on inventory turnover financial ratios chart conversion. It is also available for immediate download and adjustment. So, changes can be made in the color, design, graphics or any other component to create a unique layout.

Business Financial Highlights For Planning And Forecasting Background PDF
The slide shows bar graph showing actual and forecasted revenue, expenses and net profit of a company for various financial years. It is done to effectively conduct financial and investment planning for business growth and sustainability. Pitch your topic with ease and precision using this Business Financial Highlights For Planning And Forecasting Background PDF. This layout presents information on Revenue, Expenses And Costs, Net Profit. It is also available for immediate download and adjustment. So, changes can be made in the color, design, graphics or any other component to create a unique layout.

Fixed Asset Turnover Financial Ratios Comparison Chart Structure PDF
This slide showcases graph for fixed asset turnover ratio that can help to identify how efficiently a company is a generating sales with its machinery and equipment. It showcases comparison of ratio of three companies for a period of 5 financial years Showcasing this set of slides titled fixed asset turnover financial ratios comparison chart structure pdf. The topics addressed in these templates are fixed asset turnover financial ratios comparison chart. All the content presented in this PPT design is completely editable. Download it and make adjustments in color, background, font etc. as per your unique business setting.

Brand Revenue Comparative Analysis Graph With Key Insights Inspiration PDF
This slide illustrates graphical representation of sales revenue of three brands. It includes insights and facts and figures of these brands.Showcasing this set of slides titled Brand Revenue Comparative Analysis Graph With Key Insights Inspiration PDF. The topics addressed in these templates are Brand Revenue Comparative Analysis Graph With Key Insights. All the content presented in this PPT design is completely editable. Download it and make adjustments in color, background, font etc. as per your unique business setting.

Analytical Incrementalism Monthly Financial Analysis Of Our Company Slides PDF
The graph provides a glimpse of the companys revenue, operating profit and productivity for 12 months. Deliver an awe-inspiring pitch with this creative analytical incrementalism monthly financial analysis of our company slides pdf bundle. Topics like operating profit, productivity, revenue can be discussed with this completely editable template. It is available for immediate download depending on the needs and requirements of the user.

Annual Graph For Human Resource Recruitment Trends Summary PDF
The slide shows the HR recruitment trend graph from year 2018 to 2022. It includes number of employees hired per year along with key takeaways. Pitch your topic with ease and precision using this Annual Graph For Human Resource Recruitment Trends Summary PDF. This layout presents information on Employee Recruitment, Rise Employee, Economic Reforms. It is also available for immediate download and adjustment. So, changes can be made in the color, design, graphics or any other component to create a unique layout.
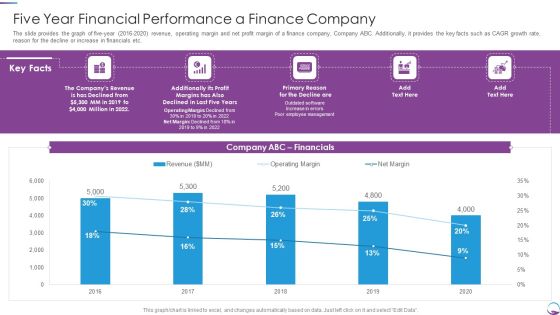
Five Year Financial Performance A Finance Company Slides PDF
The slide provides the graph of five year 2016 to 2020 revenue, operating margin and net profit margin of a finance company, Company ABC. Additionally, it provides the key facts such as CAGR growth rate, reason for the decline or increase in financials etc. Deliver and pitch your topic in the best possible manner with this Five Year Financial Performance A Finance Company Slides PDF. Use them to share invaluable insights on Five Year Financial Performance A Finance Company and impress your audience. This template can be altered and modified as per your expectations. So, grab it now.

Bioprocessing Company Venture Capitalist Presentation Addressing Financial Projections Infographics PDF
This slide caters details about financial projections of biotech platform in terms of total test performed, total revenues, total royalties, along with financial assumptions.Deliver and pitch your topic in the best possible manner with this bioprocessing company venture capitalist presentation addressing financial projections infographics pdf Use them to share invaluable insights on addressing financial projections of biotech platform and impress your audience. This template can be altered and modified as per your expectations. So, grab it now.
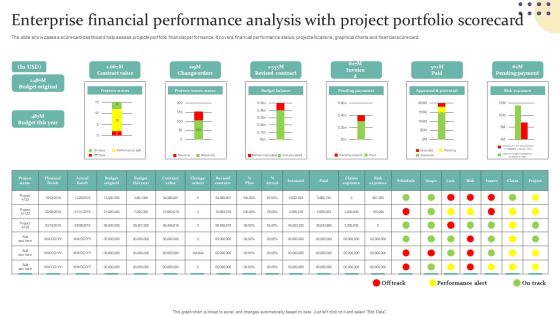
Enterprise Financial Performance Analysis With Project Portfolio Scorecard Guidelines PDF
The slide showcases a scorecard dashboard help assess projects portfolio financial performance. It covers financial performance status, projects locations, graphical charts and financial scorecard. Showcasing this set of slides titled Enterprise Financial Performance Analysis With Project Portfolio Scorecard Guidelines PDF. The topics addressed in these templates are Projects Status, Projects Issues Status, Budget Balance. All the content presented in this PPT design is completely editable. Download it and make adjustments in color, background, font etc. as per your unique business setting.
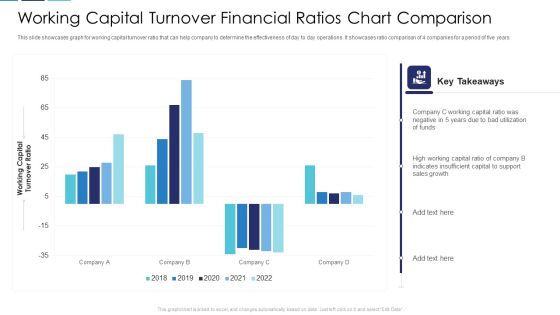
Working Capital Turnover Financial Ratios Chart Comparison Clipart PDF
This slide showcases graph for working capital turnover ratio that can help company to determine the effectiveness of day to day operations. It showcases ratio comparison of 4 companies for a period of five years Pitch your topic with ease and precision using this working capital turnover financial ratios chart comparison clipart pdf. This layout presents information on working capital turnover financial ratios chart comparison. It is also available for immediate download and adjustment. So, changes can be made in the color, design, graphics or any other component to create a unique layout.

Cab Aggregator Services Investor Capital Funding Financial Highlights Introduction PDF
This slide provides the glimpse about the financial highlights which focuses on sales, gross margin, net profit, etc. Deliver an awe inspiring pitch with this creative cab aggregator services investor capital funding financial highlights introduction pdf bundle. Topics like financial highlights can be discussed with this completely editable template. It is available for immediate download depending on the needs and requirements of the user.

Cab Aggregator Venture Capital Funding Financial Highlights Elements PDF
This slide provides the glimpse about the financial highlights which focuses on sales, gross margin, net profit, etc. Deliver an awe inspiring pitch with this creative cab aggregator venture capital funding financial highlights elements pdf bundle. Topics like financial highlights can be discussed with this completely editable template. It is available for immediate download depending on the needs and requirements of the user.
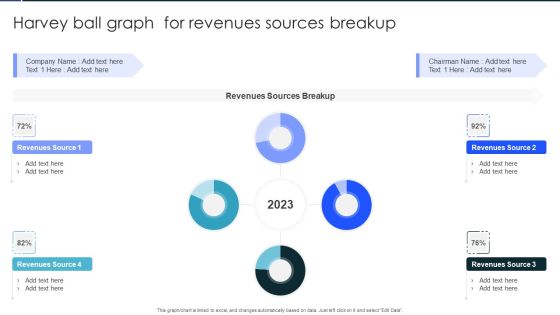
Harvey Ball Graph For Revenues Sources Breakup Infographics PDF
Showcasing this set of slides titled Harvey Ball Graph For Revenues Sources Breakup Infographics PDF. The topics addressed in these templates are Revenues Sources Breakup, Revenues, Sources Breakup. All the content presented in this PPT design is completely editable. Download it and make adjustments in color, background, font etc. as per your unique business setting.

Product Performance Comparison Graph Showing Revenue Growth Portrait PDF
Showcasing this set of slides titled Product Performance Comparison Graph Showing Revenue Growth Portrait PDF. The topics addressed in these templates are Sales Revenue, Product. All the content presented in this PPT design is completely editable. Download it and make adjustments in color, background, font etc. as per your unique business setting.

 Home
Home