Financial Graphs
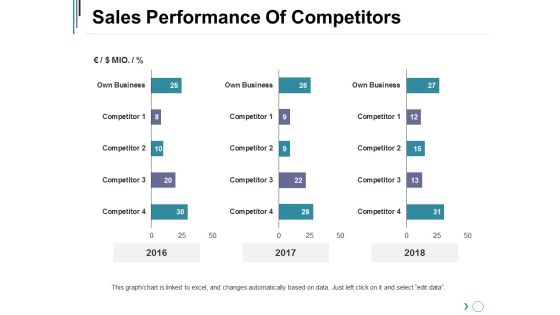
Sales Performance Of Competitors Ppt PowerPoint Presentation Inspiration Slideshow
This is a sales performance of competitors ppt powerpoint presentation inspiration slideshow. This is a three stage process. The stages in this process are business, marketing, graph, finance, years.

Sales Performance Of Competitors Ppt PowerPoint Presentation Portfolio Templates
This is a sales performance of competitors ppt powerpoint presentation portfolio templates. This is a three stage process. The stages in this process are business, marketing, percentage, graph, finance.

Sales Performance Of Competitors Ppt PowerPoint Presentation Layouts Elements
This is a sales performance of competitors ppt powerpoint presentation layouts elements. This is a three stage process. The stages in this process are years, bar graph, finance, business, marketing.

Area Chart Ppt PowerPoint Presentation Summary Information
This is a area chart ppt powerpoint presentation summary information. This is a two stage process. The stages in this process are business, sales in percentage, percentage, marketing, graph.

Clustered Column Line Ppt PowerPoint Presentation Pictures Objects
This is a clustered column line ppt powerpoint presentation pictures objects. This is a three stage process. The stages in this process are in percentage, business, marketing, graph, finance.

Clustered Column Line Ppt PowerPoint Presentation Pictures Model
This is a clustered column line ppt powerpoint presentation pictures model. This is a three stage process. The stages in this process are bar graph, finance, marketing, strategy, business.

Activity Ratios Template 1 Ppt PowerPoint Presentation Portfolio Graphics
This is a activity ratios template 1 ppt powerpoint presentation portfolio graphics. This is a two stage process. The stages in this process are finance, chart graph, marketing, planning, analysis.

Activity Ratios Template 4 Ppt PowerPoint Presentation Portfolio Backgrounds
This is a activity ratios template 4 ppt powerpoint presentation portfolio backgrounds. This is a two stage process. The stages in this process are finance, chart graph, marketing, planning, analysis.

Liquidity Ratios Template Ppt PowerPoint Presentation Outline Elements
This is a liquidity ratios template ppt powerpoint presentation outline elements. This is a two stage process. The stages in this process are finance, chart graph, marketing, planning, analysis.

Area Chart Ppt PowerPoint Presentation Portfolio Graphics Design
This is a area chart ppt powerpoint presentation portfolio graphics design. This is a two stage process. The stages in this process are business, marketing, in percentage, graph, finance.

Clustered Bar Ppt PowerPoint Presentation Portfolio Graphic Images
This is a clustered bar ppt powerpoint presentation portfolio graphic images. This is a three stage process. The stages in this process are business, unit count, finance, marketing, graph.

Stacked Area Clustered Column Ppt PowerPoint Presentation Gallery Images
This is a stacked area clustered column ppt powerpoint presentation gallery images. This is a three stage process. The stages in this process are business, in percentage, marketing, strategy, graph.
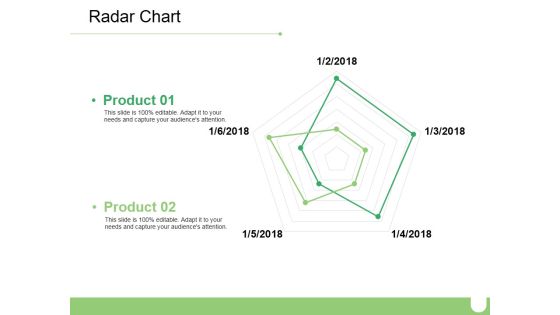
Radar Chart Ppt PowerPoint Presentation Slides Designs Download
This is a radar chart ppt powerpoint presentation slides designs download. This is a two stage process. The stages in this process are business, radar chart, marketing, graph, strategy.

Cycle Time By Month Ppt PowerPoint Presentation Slides Ideas
This is a cycle time by month ppt powerpoint presentation slides ideas. This is a two stage process. The stages in this process are business, marketing, cycle time by month, finance, graph.

Data Collection Scatter Diagram Ppt PowerPoint Presentation Professional Smartart
This is a data collection scatter diagram ppt powerpoint presentation professional smartart. This is a three stage process. The stages in this process are business, marketing, finance, graph, strategy.
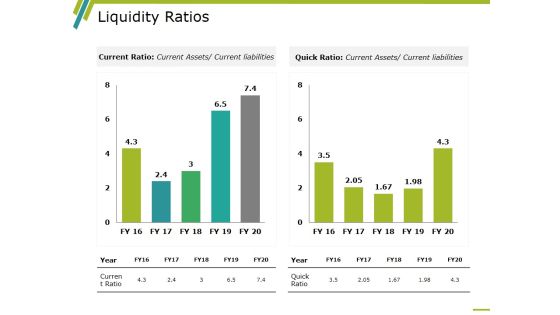
Liquidity Ratios Template 1 Ppt PowerPoint Presentation Styles Outline
This is a liquidity ratios template 1 ppt powerpoint presentation styles outline. This is a two stage process. The stages in this process are business, marketing, graph, year, current ratio, quick ratio.

Liquidity Ratios Template 2 Ppt PowerPoint Presentation Ideas Microsoft
This is a liquidity ratios template 2 ppt powerpoint presentation ideas microsoft. This is a two stage process. The stages in this process are business, marketing, graph, year, current ratio, quick ratio.

Profitability Ratios Template 1 Ppt PowerPoint Presentation Ideas Master Slide
This is a profitability ratios template 1 ppt powerpoint presentation ideas master slide. This is a two stage process. The stages in this process are business, net profit ratio, gross profit ratio, marketing, graph.

Profitability Ratios Template 2 Ppt PowerPoint Presentation Show Portfolio
This is a profitability ratios template 2 ppt powerpoint presentation show portfolio. This is a two stage process. The stages in this process are business, marketing, graph, net profit ratio, gross profit ratio, year.
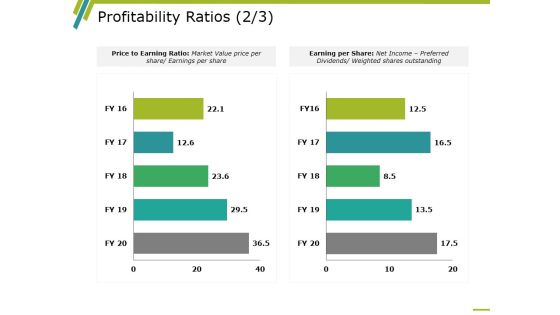
Profitability Ratios Template 3 Ppt PowerPoint Presentation Inspiration Backgrounds
This is a profitability ratios template 3 ppt powerpoint presentation inspiration backgrounds. This is a two stage process. The stages in this process are business, marketing, graph, price to earning ratio, earning per share.
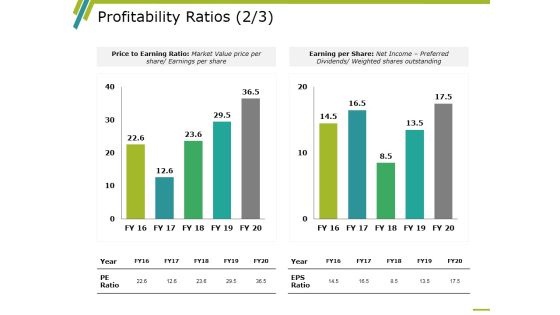
Profitability Ratios Template 4 Ppt PowerPoint Presentation Infographics Rules
This is a profitability ratios template 4 ppt powerpoint presentation infographics rules. This is a two stage process. The stages in this process are business, marketing, graph, price to earning ratio, earning per share.

Profitability Ratios Template 5 Ppt PowerPoint Presentation Infographic Template Clipart Images
This is a profitability ratios template 5 ppt powerpoint presentation infographic template clipart images. This is a two stage process. The stages in this process are business, marketing, graph, roce, roa.
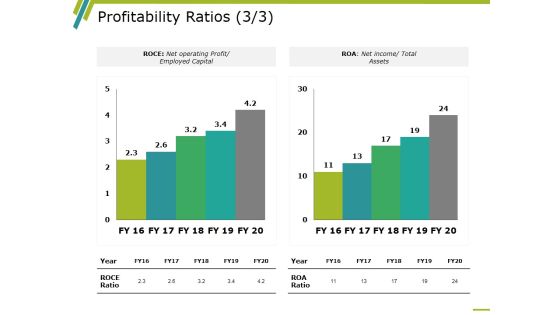
Profitability Ratios Template 6 Ppt PowerPoint Presentation Design Ideas
This is a profitability ratios template 6 ppt powerpoint presentation design ideas. This is a two stage process. The stages in this process are business, marketing, graph, roce, roa.
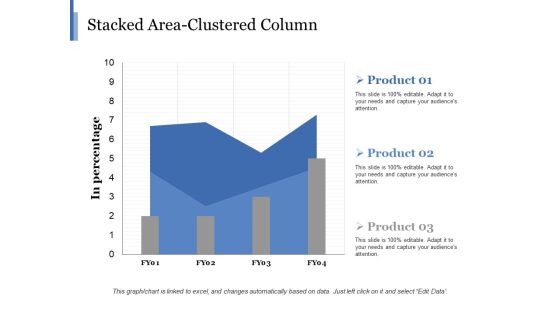
Stacked Area Clustered Column Ppt PowerPoint Presentation Show Elements
This is a stacked area clustered column ppt powerpoint presentation show elements. This is a three stage process. The stages in this process are business, in percentage, marketing, finance, graph.
Stacked Bar Template 1 Ppt PowerPoint Presentation Icon Portfolio
This is a stacked bar template 1 ppt powerpoint presentation icon portfolio. This is a two stage process. The stages in this process are business, marketing, finance, graph, strategy.
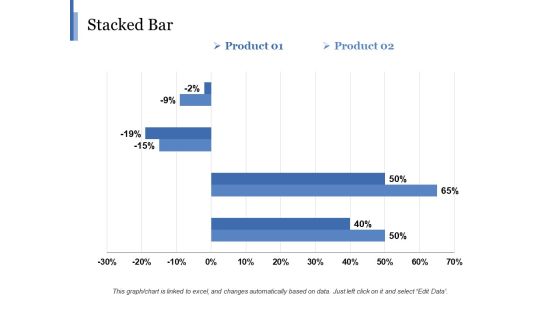
Stacked Bar Template 2 Ppt PowerPoint Presentation Gallery Background
This is a stacked bar template 2 ppt powerpoint presentation gallery background. This is a two stage process. The stages in this process are business, marketing, finance, graph, strategy, percentage.

Area Chart Ppt PowerPoint Presentation File Visuals
This is a area chart ppt powerpoint presentation file visuals. This is a two stage process. The stages in this process are business, sales in percentage, marketing, graph, strategy, finance.

Line Chart Ppt PowerPoint Presentation Professional Portfolio
This is a line chart ppt powerpoint presentation professional portfolio. This is a two stage process. The stages in this process are business, marketing, profit, percentage, graph, strategy, finance.
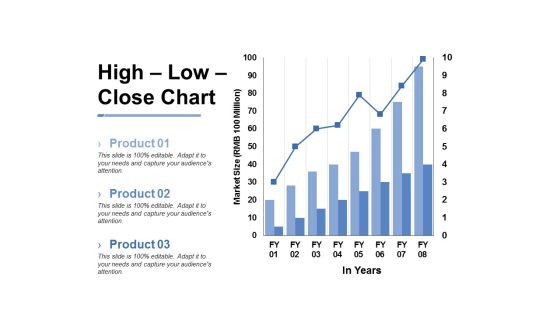
High Low Close Chart Ppt PowerPoint Presentation Inspiration Slide
This is a high low close chart ppt powerpoint presentation inspiration slide. This is a three stage process. The stages in this process are business, marketing, market size, in years, graph.
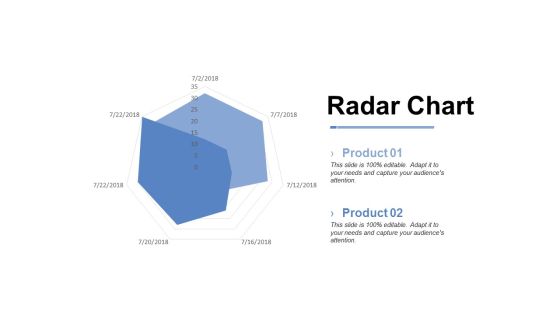
Radar Chart Ppt PowerPoint Presentation Pictures Layout Ideas
This is a radar chart ppt powerpoint presentation pictures layout ideas. This is a two stage process. The stages in this process are business, marketing, radar chart, finance, strategy, graph.

Area Chart Ppt PowerPoint Presentation Pictures Vector
This is a area chart ppt powerpoint presentation pictures vector. This is a two stage process. The stages in this process are sales in percentage, business, marketing, graph, percentage.

Column Chart Ppt PowerPoint Presentation Layouts Graphic Images
This is a column chart ppt powerpoint presentation layouts graphic images. This is a two stage process. The stages in this process are business, finance, years, graph, expenditure in, marketing.

Bar Chart Ppt PowerPoint Presentation Model Sample
This is a bar chart ppt powerpoint presentation model sample. This is a two stage process. The stages in this process are sales in percentage, business, marketing, graph, percentage, year.

Balance Sheet Kpis Ppt PowerPoint Presentation Infographic Template Designs
This is a balance sheet kpis ppt powerpoint presentation infographic template designs. This is a four stage process. The stages in this process are business, marketing, finance, graph, strategy.
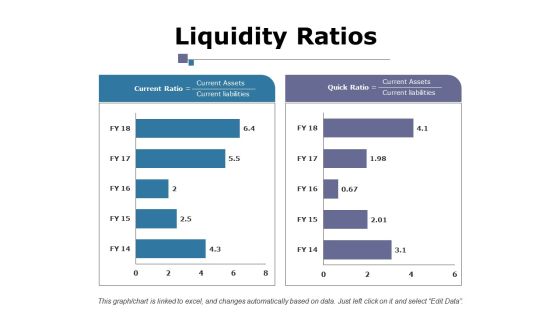
Liquidity Ratios Ppt PowerPoint Presentation Layouts Example File
This is a liquidity ratios ppt powerpoint presentation layouts example file. This is a two stage process. The stages in this process are business, current ratio, quick ratio, marketing, finance, graph.
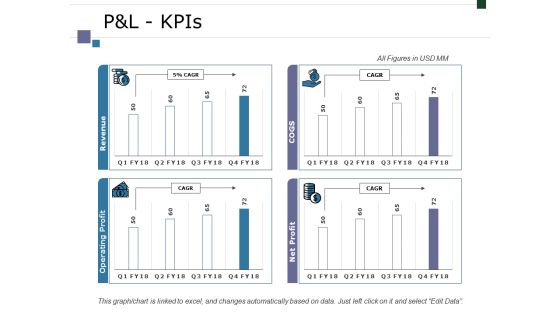
Pandl Kpis Ppt PowerPoint Presentation Infographic Template Graphics Tutorials
This is a pandl kpis ppt powerpoint presentation infographic template graphics tutorials. This is a four stage process. The stages in this process are business, marketing, finance, graph, strategy.

Clustered Bar Ppt PowerPoint Presentation Styles Graphics
This is a clustered bar ppt powerpoint presentation styles graphics. This is a three stage process. The stages in this process are business, marketing, finance, graph, strategy, unit count.
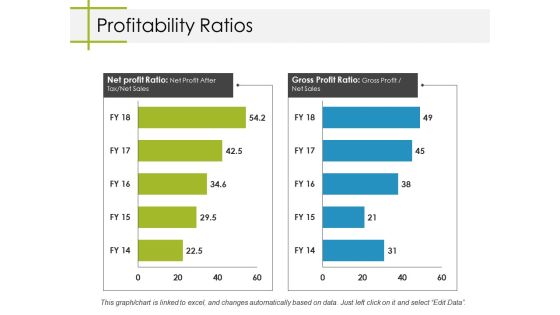
Profitability Ratios Ppt PowerPoint Presentation Inspiration Information
This is a profitability ratios ppt powerpoint presentation inspiration information. This is a two stage process. The stages in this process are business, net profit ratio, gross profit ratio, marketing, graph.
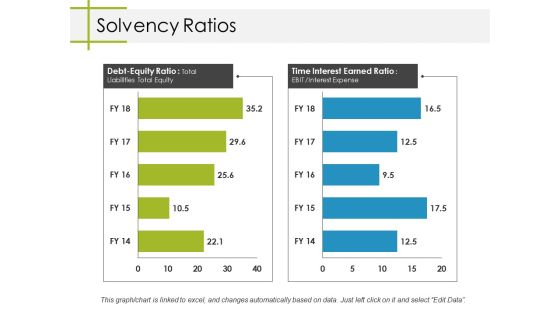
Solvency Ratios Ppt PowerPoint Presentation Professional Rules
This is a solvency ratios ppt powerpoint presentation professional rules. This is a two stage process. The stages in this process are business, marketing, debt equity ratio, time interest earned ratio, graph.

Cash Flow Statement Kpis Ppt PowerPoint Presentation Pictures Graphics
This is a cash flow statement kpis ppt powerpoint presentation pictures graphics. This is a four stage process. The stages in this process are business, marketing, graph, finance, strategy.

Clustered Bar Ppt PowerPoint Presentation Pictures Clipart Images
This is a clustered bar ppt powerpoint presentation pictures clipart images. This is a three stage process. The stages in this process are business, marketing, graph, finance, strategy, unit count.

Profitability Ratios Ppt PowerPoint Presentation Summary Outline
This is a profitability ratios ppt powerpoint presentation summary outline. This is a two stage process. The stages in this process are business, net profit ratio, gross profit ratio, marketing, graph.

Stacked Line With Markers Ppt PowerPoint Presentation Pictures Design Templates
This is a stacked line with markers ppt powerpoint presentation pictures design templates. This is a one stage process. The stages in this process are business, marketing, finance, in million, graph.

P And L Kpis Tabular Form Ppt PowerPoint Presentation Pictures Gallery
This is a p and l kpis tabular form ppt powerpoint presentation pictures gallery. This is a four stage process. The stages in this process are business, marketing, graph, strategy, finance.

Area Chart Ppt PowerPoint Presentation Infographics Graphics Pictures
This is a area chart ppt powerpoint presentation infographics graphics pictures. This is a two stage process. The stages in this process are business, sales in percentage, area chart, marketing, graph.

Balance Sheet Kpis Template 1 Ppt PowerPoint Presentation Show Inspiration
This is a balance sheet kpis template 1 ppt powerpoint presentation show inspiration. This is a four stage process. The stages in this process are business, marketing, graph, current liabilities, total liabilities.

Balance Sheet Kpis Template 2 Ppt PowerPoint Presentation Gallery Example
This is a balance sheet kpis template 2 ppt powerpoint presentation gallery example. This is a four stage process. The stages in this process are business, marketing, graph, current liabilities, total liabilities.

Competitor Comparison Template 1 Ppt PowerPoint Presentation Infographic Template Mockup
This is a competitor comparison template 1 ppt powerpoint presentation infographic template mockup. This is a five stage process. The stages in this process are business, marketing, graph, finance, strategy.

Competitor Comparison Template 2 Ppt PowerPoint Presentation Infographics Objects
This is a competitor comparison template 2 ppt powerpoint presentation infographics objects. This is a five stage process. The stages in this process are business, marketing, graph, finance, strategy.

Competitor Comparison Template 1 Ppt PowerPoint Presentation Layouts Slide Portrait
This is a competitor comparison template 1 ppt powerpoint presentation layouts slide portrait. This is a four stage process. The stages in this process are business, marketing, graph, finance, strategy.

Competitor Comparison Template 2 Ppt PowerPoint Presentation Inspiration Images
This is a competitor comparison template 2 ppt powerpoint presentation inspiration images. This is a five stage process. The stages in this process are business, marketing, graph, finance, strategy.

Radar Chart Ppt PowerPoint Presentation Show Graphic Images
This is a radar chart ppt powerpoint presentation show graphic images. This is a two stage process. The stages in this process are business, radar chart, marketing, graph, strategy.

Clustered Column Ppt PowerPoint Presentation Inspiration Introduction
This is a clustered column ppt powerpoint presentation inspiration introduction. This is a two stage process. The stages in this process are business, marketing, in percentage, finance, graph, strategy.

Area Chart Ppt PowerPoint Presentation Layouts Graphic Images
This is a area chart ppt powerpoint presentation layouts graphic images. This is a three stage process. The stages in this process are business, in years, marketing, in percentage, finance, graph.
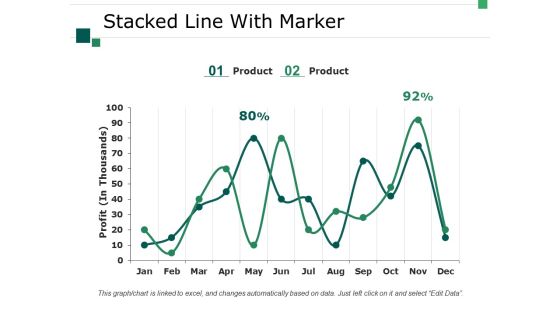
Stacked Line With Marker Ppt PowerPoint Presentation Professional Designs Download
This is a stacked line with marker ppt powerpoint presentation professional designs download. This is a two stage process. The stages in this process are business, marketing, strategy, graph, profit.

Volume High Low Close Chart Ppt PowerPoint Presentation Visual Aids Slides
This is a volume high low close chart ppt powerpoint presentation visual aids slides. This is a two stage process. The stages in this process are bar graph, marketing, strategy, finance, planning.

Clustered Column Line Ppt PowerPoint Presentation Model Graphics Tutorials
This is a clustered column line ppt powerpoint presentation model graphics tutorials. This is a three stage process. The stages in this process are business, marketing, in percentage, finance, graph.
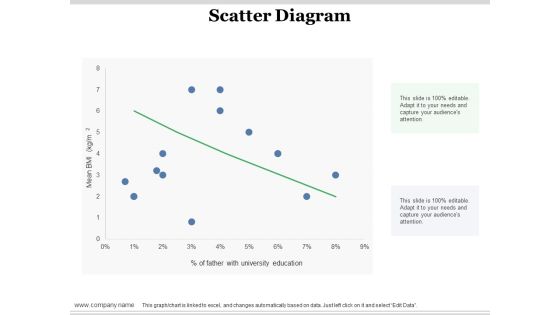
Scatter Diagram Ppt PowerPoint Presentation Infographic Template Design Ideas
This is a scatter diagram ppt powerpoint presentation infographic template design ideas. This is a one stage process. The stages in this process are scatter diagram, finance, in percentage, business, bar graph.
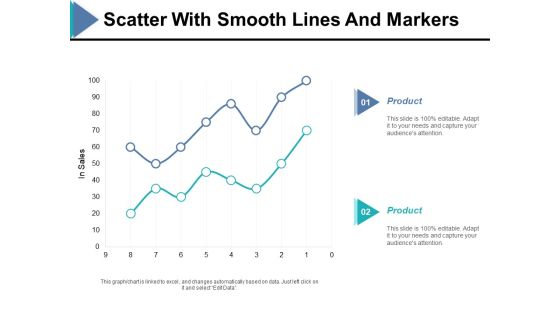
Scatter With Smooth Lines And Markers Ppt PowerPoint Presentation Ideas Example
This is a scatter with smooth lines and markers ppt powerpoint presentation ideas example. This is a two stage process. The stages in this process are in sales, finance, bar graph, product, business.
Scatter Bubble Chart Ppt PowerPoint Presentation Model Icon
This is a scatter bubble chart ppt powerpoint presentation model icon. This is a three stage process. The stages in this process are finance, business, management, marketing, chart and graph.

Buy Side Advisory Services In M And A Other Sectors Top Clients And Total Revenue Brochure PDF
The slide identifies a list of companys clients in various other sectors manufacturing, construction, financials services, energy. Mining, automobile etc. along with the total revenue from each sector for the year 2021.Get a simple yet stunning designed Buy Side Advisory Services In M And A Other Sectors Top Clients And Total Revenue Brochure PDF. It is the best one to establish the tone in your meetings. It is an excellent way to make your presentations highly effective. So, download this PPT today from Slidegeeks and see the positive impacts. Our easy-to-edit Buy Side Advisory Services In M And A Other Sectors Top Clients And Total Revenue Brochure PDF can be your go-to option for all upcoming conferences and meetings. So, what are you waiting for Grab this template today.
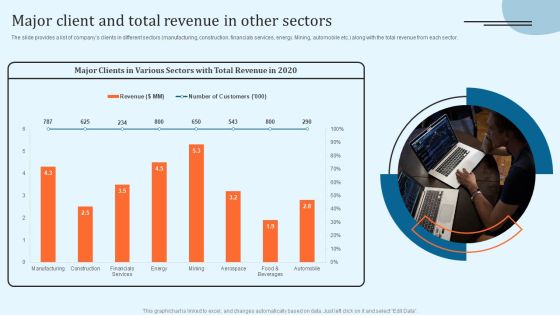
Equity Debt And Convertible Bond Investment Banking Pitch Book Major Client And Total Revenue In Other Sectors Microsoft PDF
The slide provides a list of companys clients in different sectors manufacturing, construction, financials services, energy. Mining, automobile etc. along with the total revenue from each sector. Do you know about Slidesgeeks Equity Debt And Convertible Bond Investment Banking Pitch Book Major Client And Total Revenue In Other Sectors Microsoft PDF These are perfect for delivering any kind od presentation. Using it, create PowerPoint presentations that communicate your ideas and engage audiences. Save time and effort by using our pre designed presentation templates that are perfect for a wide range of topic. Our vast selection of designs covers a range of styles, from creative to business, and are all highly customizable and easy to edit. Download as a PowerPoint template or use them as Google Slides themes.

Self Care Products Company Outline Earning Per Share And Market Capitalization Themes PDF
This slide highlights the Dabur company financials for the last five years 2017 to 2022. It includes the earning per share EPS and market capitalization. Find highly impressive Self Care Products Company Outline Earning Per Share And Market Capitalization Themes PDF on Slidegeeks to deliver a meaningful presentation. You can save an ample amount of time using these presentation templates. No need to worry to prepare everything from scratch because Slidegeeks experts have already done a huge research and work for you. You need to download Self Care Products Company Outline Earning Per Share And Market Capitalization Themes PDF for your upcoming presentation. All the presentation templates are 100 percent editable and you can change the color and personalize the content accordingly. Download now.
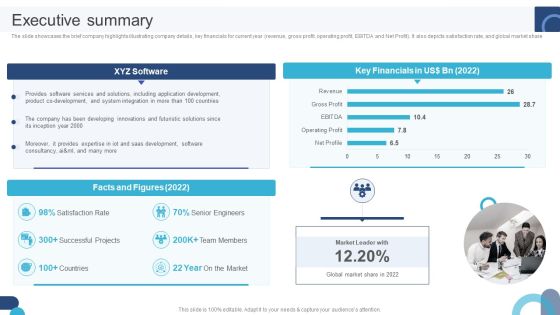
Digital Application Software Development Business Profile Executive Summary Structure PDF
The slide showcases the brief company highlights illustrating company details, key financials for current year revenue, gross profit, operating profit, EBITDA and Net Profit. It also depicts satisfaction rate, and global market share. If you are looking for a format to display your unique thoughts, then the professionally designed Digital Application Software Development Business Profile Executive Summary Structure PDF is the one for you. You can use it as a Google Slides template or a PowerPoint template. Incorporate impressive visuals, symbols, images, and other charts. Modify or reorganize the text boxes as you desire. Experiment with shade schemes and font pairings. Alter, share or cooperate with other people on your work. Download Digital Application Software Development Business Profile Executive Summary Structure PDF and find out how to give a successful presentation. Present a perfect display to your team and make your presentation unforgettable.

Digital Products Company Outline Executive Summary Designs PDF
The slide showcases the brief company highlights illustrating company details, key financials for current year revenue, gross profit, operating profit, EBITDA and Net Profit. It also depicts satisfaction rate, and global market share. Do you know about Slidesgeeks Digital Products Company Outline Executive Summary Designs PDF These are perfect for delivering any kind od presentation. Using it, create PowerPoint presentations that communicate your ideas and engage audiences. Save time and effort by using our pre designed presentation templates that are perfect for a wide range of topic. Our vast selection of designs covers a range of styles, from creative to business, and are all highly customizable and easy to edit. Download as a PowerPoint template or use them as Google Slides themes.
Radar Chart Ppt PowerPoint Presentation Icon Show
This is a radar chart ppt powerpoint presentation icon show. This is a two stage process. The stages in this process are business, financials, marketing, chart, strategy.

Business Overview Of The Target Company AMM Company Investment Banking And Deal Pitchbook Topics PDF
The slide provides the business overview of the target company the purchasing company.Business overview includes business introduction, mission and vision statement, financials highlights and non-performing assets for five years.If you are looking for a format to display your unique thoughts, then the professionally designed Business Overview Of The Target Company AMM Company Investment Banking And Deal Pitchbook Topics PDF is the one for you. You can use it as a Google Slides template or a PowerPoint template. Incorporate impressive visuals, symbols, images, and other charts. Modify or reorganize the text boxes as you desire. Experiment with shade schemes and font pairings. Alter, share or cooperate with other people on your work. Download Business Overview Of The Target Company AMM Company Investment Banking And Deal Pitchbook Topics PDF and find out how to give a successful presentation. Present a perfect display to your team and make your presentation unforgettable.

Sell Side M And A Pitchbook With Deal Overview Business Overview Of The Target Company AMM Company Graphics PDF
The slide provides the business overview of the target company the purchasing company.Business overview includes business introduction, mission and vision statement, financials highlights and non performing assets for five years. If you are looking for a format to display your unique thoughts, then the professionally designed Sell Side M And A Pitchbook With Deal Overview Business Overview Of The Target Company AMM Company Graphics PDF is the one for you. You can use it as a Google Slides template or a PowerPoint template. Incorporate impressive visuals, symbols, images, and other charts. Modify or reorganize the text boxes as you desire. Experiment with shade schemes and font pairings. Alter, share or cooperate with other people on your work. Download Sell Side M And A Pitchbook With Deal Overview Business Overview Of The Target Company AMM Company Graphics PDF and find out how to give a successful presentation. Present a perfect display to your team and make your presentation unforgettable.

Target Consumers And Market Valuation Overview Business Overview Of The Target Company Information PDF
The slide provides the business overview of the target company the purchasing company.Business overview includes business introduction, mission and vision statement, financials highlights and non-performing assets for five years. Are you in need of a template that can accommodate all of your creative concepts This one is crafted professionally and can be altered to fit any style. Use it with Google Slides or PowerPoint. Include striking photographs, symbols, depictions, and other visuals. Fill, move around, or remove text boxes as desired. Test out color palettes and font mixtures. Edit and save your work, or work with colleagues. Download Target Consumers And Market Valuation Overview Business Overview Of The Target Company Information PDF and observe how to make your presentation outstanding. Give an impeccable presentation to your group and make your presentation unforgettable.

Budgeting Planned Actual Comparison Ppt PowerPoint Presentation Gallery Graphic Tips
This is a budgeting planned actual comparison ppt powerpoint presentation gallery graphic tips. This is a three stage process. The stages in this process are planned cost, actual cost, value difference.

Sales Revenue Product Ppt PowerPoint Presentation Infographic Template Backgrounds
This is a sales revenue product ppt powerpoint presentation infographic template backgrounds. This is a three stage process. The stages in this process are product wise revenue, profit percent of total revenue, total income product.
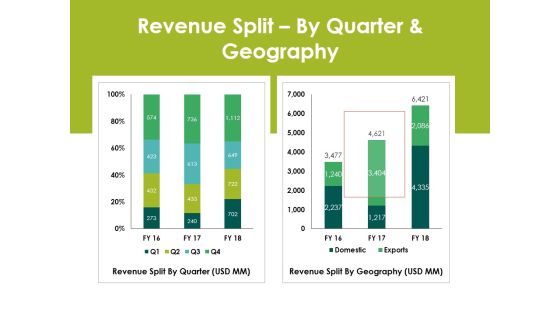
Revenue Splitby Quarter And Geography Ppt PowerPoint Presentation Layout
This is a revenue splitby quarter and geography ppt powerpoint presentation layout. This is a two stage process. The stages in this process are revenue split by quarter, revenue split by geography.

Sales Revenue Product Ppt PowerPoint Presentation Outline Portfolio
This is a sales revenue product ppt powerpoint presentation outline portfolio. This is a three stage process. The stages in this process are total income product, total revenue, product wise revenue, sales, business.
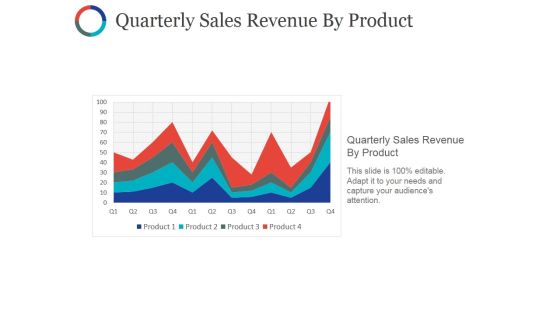
Quarterly Sales Revenue By Product Ppt PowerPoint Presentation Styles Slides
This is a quarterly sales revenue by product ppt powerpoint presentation styles slides. This is a four stage process. The stages in this process are quarterly sales revenue by product, charts, sales, business, success.

Competitor Revenue And Profit Ppt PowerPoint Presentation Icon Slide Download
This is a competitor revenue and profit ppt powerpoint presentation icon slide download. This is a five stage process. The stages in this process are revenue, profit, finance, marketing, strategy, analysis, business.

Competitor Revenue And Profit Ppt PowerPoint Presentation Inspiration Slide Portrait
This is a competitor revenue and profit ppt powerpoint presentation inspiration slide portrait. This is a five stage process. The stages in this process are business, finance, analysis, growth, investment.

Revenue Split By Product Segment Ppt PowerPoint Presentation Styles Elements
This is a revenue split by product segment ppt powerpoint presentation styles elements. This is a four stage process. The stages in this process are business, marketing, planning, finance, strategy.

Revenue Splitby Product And Segment Ppt PowerPoint Presentation Styles Example File
This is a revenue splitby product and segment ppt powerpoint presentation styles example file. This is a two stage process. The stages in this process are revenue by product, revenue by segment, finance, strategy, business.
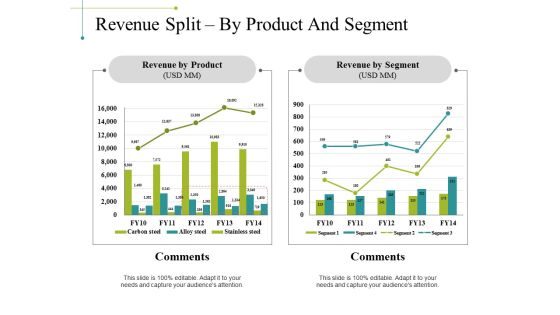
Revenue Split By Product And Segment Ppt PowerPoint Presentation Model Format Ideas
This is a revenue split by product and segment ppt powerpoint presentation model format ideas. This is a two stage process. The stages in this process are business, revenue by product, revenue by segment, comments, marketing.

Revenue Split By Quarter And Geography Ppt PowerPoint Presentation Slides Picture
This is a revenue split by quarter and geography ppt powerpoint presentation slides picture. This is a two stage process. The stages in this process are business, marketing, revenue split by quarter, revenue split by geography, comments.
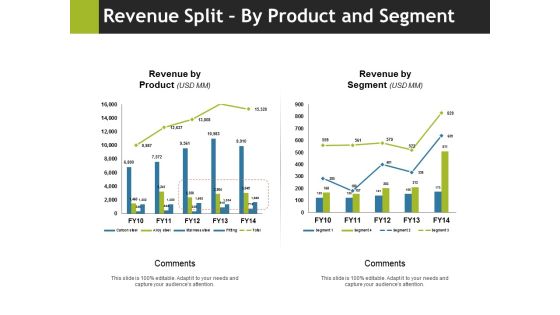
Revenue Split By Product And Segment Ppt PowerPoint Presentation Gallery Example
This is a revenue split by product and segment ppt powerpoint presentation gallery example. This is a two stage process. The stages in this process are comments, revenue by product, revenue by segment, business, marketing.
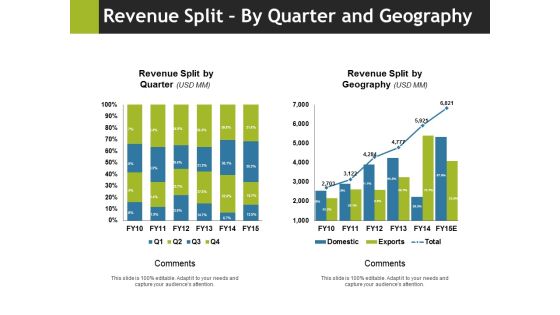
Revenue Split By Quarter And Geography Ppt PowerPoint Presentation Slides Vector
This is a revenue split by quarter and geography ppt powerpoint presentation slides vector. This is a two stage process. The stages in this process are revenue split by quarter, comments, revenue split by geography, business, marketing.

Current State Analysis Revenue Versus Target Ppt PowerPoint Presentation Background Designs
This is a current state analysis revenue versus target ppt powerpoint presentation background designs. This is a six stage process. The stages in this process are actual, target, actual vs target value.

Competitor Revenue And Profit Template 1 Ppt PowerPoint Presentation Professional Example File
This is a competitor revenue and profit template 1 ppt powerpoint presentation professional example file. This is a five stage process. The stages in this process are business, finance, marketing, strategy, analysis, growth.

Competitor Market Share And Sales Revenues Ppt PowerPoint Presentation Model Graphics Example
This is a competitor market share and sales revenues ppt powerpoint presentation model graphics example. This is a four stage process. The stages in this process are business, marketing, strategy, finance, planning.
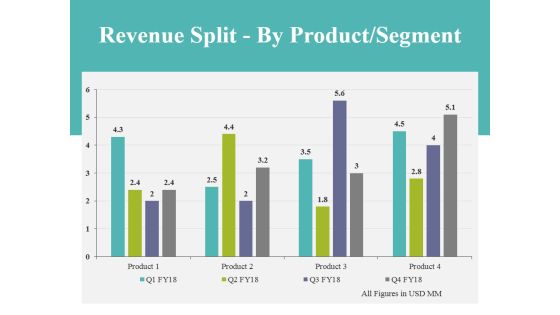
Revenue Split By Product Segment Template 2 Ppt PowerPoint Presentation Styles Guidelines
This is a revenue split by product segment template 2 ppt powerpoint presentation styles guidelines. This is a four stage process. The stages in this process are business, finance, analysis, marketing, strategy.

Revenue Split By Product And Segment Ppt PowerPoint Presentation Summary Portfolio
This is a revenue split by product and segment ppt powerpoint presentation summary portfolio. This is a two stage process. The stages in this process are business, marketing, strategy, planning, finance.
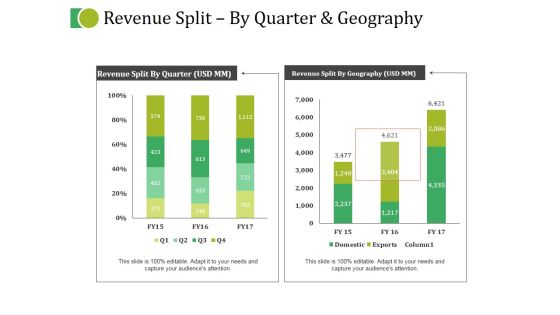
Revenue Split By Quarter And Geography Ppt PowerPoint Presentation Layouts Templates
This is a revenue split by quarter and geography ppt powerpoint presentation layouts templates. This is a two stage process. The stages in this process are business, marketing, strategy, planning, finance.

Competitor Market Share And Sales Revenues Ppt PowerPoint Presentation Gallery Gridlines
This is a competitor market share and sales revenues ppt powerpoint presentation gallery gridlines. This is a three stage process. The stages in this process are line, marketing, strategy, planning, finance.

Competitor Market Share And Sales Revenues Ppt PowerPoint Presentation Portfolio Summary
This is a competitor market share and sales revenues ppt powerpoint presentation portfolio summary. This is a four stage process. The stages in this process are business, marketing, strategy, planning, finance.

Competitor Market Share And Sales Revenues Ppt PowerPoint Presentation File Demonstration
This is a competitor market share and sales revenues ppt powerpoint presentation file demonstration. This is a six stage process. The stages in this process are business, marketing, finance, your figures, development.
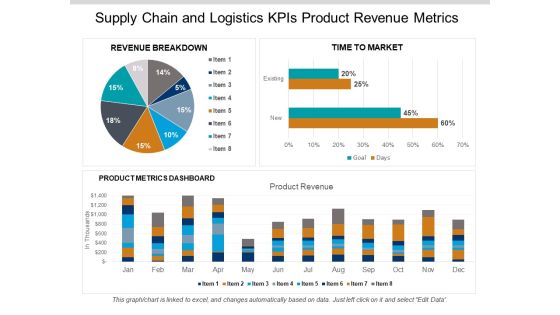
Supply Chain And Logistics Kpis Product Revenue Metrics Ppt PowerPoint Presentation Gallery Aids
This is a supply chain and logistics kpis product revenue metrics ppt powerpoint presentation gallery aids. This is a three stage process. The stages in this process are logistics performance, logistics dashboard, logistics kpis.

Retail KPI Dashboard Showing Revenue Vs Units Sold Ppt PowerPoint Presentation Professional Smartart
This is a retail kpi dashboard showing revenue vs units sold ppt powerpoint presentation professional smartart. This is a four stage process. The stages in this process are finance, analysis, business, investment, marketing.

Retail KPI Dashboard Showing Sales Revenue Customers Ppt PowerPoint Presentation Show Background Designs
This is a retail kpi dashboard showing sales revenue customers ppt powerpoint presentation show background designs. This is a six stage process. The stages in this process are finance, analysis, business, investment, marketing.
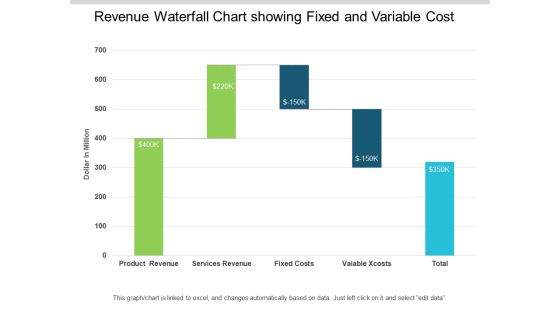
Revenue Waterfall Chart Showing Fixed And Variable Cost Ppt PowerPoint Presentation Infographic Template Images
This is a revenue waterfall chart showing fixed and variable cost ppt powerpoint presentation infographic template images. This is a five stage process. The stages in this process are sales waterfall, waterfall chart, business.

Waterfall Chart With Merchandising Sales Cost And Net Revenue Ppt PowerPoint Presentation Summary Show
This is a waterfall chart with merchandising sales cost and net revenue ppt powerpoint presentation summary show. This is a three stage process. The stages in this process are sales waterfall, waterfall chart, business.
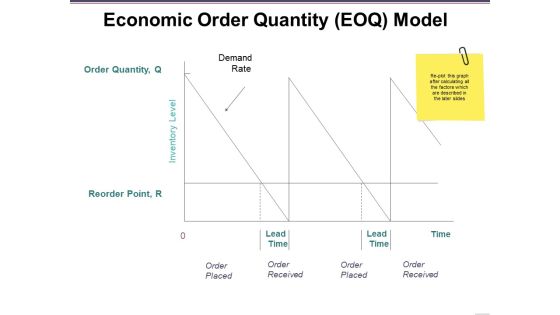
Economic Order Quantity Eoq Model Ppt PowerPoint Presentation Ideas Deck
This is a economic order quantity eoq model ppt powerpoint presentation ideas deck. This is a three stage process. The stages in this process are demand rate, order placed, order received, lead time, time, inventory level.
Economic Order Quantity Eoq Model Ppt PowerPoint Presentation Icon Deck
This is a economic order quantity eoq model ppt powerpoint presentation icon deck. This is a two stage process. The stages in this process are order quantity, reorder point.

Budgeting Template 2 Ppt PowerPoint Presentation Pictures Model
This is a budgeting template 2 ppt powerpoint presentation pictures model. This is a five stage process. The stages in this process are cost item, year, budgeting template, cost, total.

Budgeting Template 3 Ppt PowerPoint Presentation Ideas Graphics Tutorials
This is a budgeting template 3 ppt powerpoint presentation ideas graphics tutorials. This is a five stage process. The stages in this process are cost item, year, total, type, budgeting template.
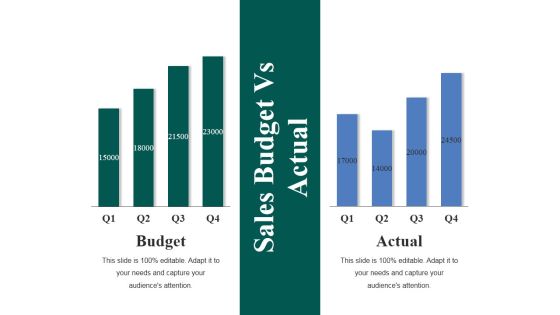
Sales Budget Vs Actual Ppt PowerPoint Presentation Show Master Slide
This is a sales budget vs actual ppt powerpoint presentation show master slide. This is a two stage process. The stages in this process are business, finance, management, analysis, budget, actual.

Budgeting Template 2 Ppt PowerPoint Presentation File Inspiration
This is a budgeting template 2 ppt powerpoint presentation file inspiration. This is a five stage process. The stages in this process are business, marketing, strategy, planning, finance.

Budgeting Template Ppt PowerPoint Presentation Gallery Design Inspiration
This is a budgeting template ppt powerpoint presentation gallery design inspiration. This is a five stage process. The stages in this process are product, percentage, business, management, marketing.

Budgeting Planned Actual Comparison Ppt PowerPoint Presentation Portfolio Information
This is a budgeting planned actual comparison ppt powerpoint presentation portfolio information. This is a three stage process. The stages in this process are planned cost, actual cost, deviation.

Budgeting Planned Actual Comparison Ppt PowerPoint Presentation Portfolio Display
This is a budgeting planned actual comparison ppt powerpoint presentation portfolio display. This is a three stage process. The stages in this process are type of cost, planned cost, actual cost, deviation, value difference.

Budgeting Planned Actual Comparison Ppt PowerPoint Presentation Show Background Image
This is a budgeting planned actual comparison ppt powerpoint presentation show background image. This is a three stage process. The stages in this process are planned cost, actual cost, value difference, deviation.

Budgeting Planned Actual Comparison Ppt PowerPoint Presentation Visual Aids Gallery
This is a budgeting planned actual comparison ppt powerpoint presentation visual aids gallery. This is a three stage process. The stages in this process are business, management, marketing, percentage, product.

Budgeting Planned Actual Comparison Ppt PowerPoint Presentation Portfolio Ideas
This is a budgeting planned actual comparison ppt powerpoint presentation portfolio ideas. This is a two stage process. The stages in this process are finance, analysis, business, investment, marketing.

Budgeting Planned Actual Comparison Ppt PowerPoint Presentation Styles File Formats
This is a budgeting planned actual comparison ppt powerpoint presentation styles file formats. This is a three stage process. The stages in this process are product, percentage, business, management, marketing.

Product Launch Budget Plan Ppt PowerPoint Presentation Outline Samples
This is a product launch budget plan ppt powerpoint presentation outline samples. This is a seven stage process. The stages in this process are business, management, marketing, percentage, product.

Budgeting Planned Actual Comparison Ppt PowerPoint Presentation Infographics Samples
This is a budgeting planned actual comparison ppt powerpoint presentation infographics samples. This is a two stage process. The stages in this process are deviation, planned cost, actual cost, value difference, planning.

Budgeting Planned Actual Comparison Ppt PowerPoint Presentation Icon Shapes
This is a budgeting planned actual comparison ppt powerpoint presentation icon shapes. This is a two stage process. The stages in this process are finance, marketing, management, investment, product, percentage.

Budgeting Planned Actual Comparison Ppt PowerPoint Presentation Inspiration Gallery
This is a budgeting planned actual comparison ppt powerpoint presentation inspiration gallery. This is a two stage process. The stages in this process are finance, analysis, business, investment, marketing.

Budgeting Planned Actual Comparison Ppt PowerPoint Presentation Inspiration Outline
This is a budgeting planned actual comparison ppt powerpoint presentation inspiration outline. This is a two stage process. The stages in this process are finance, analysis, business, investment, marketing.

Crm Dashboard Kpis Ppt PowerPoint Presentation Layouts
This is a crm dashboard kpis ppt powerpoint presentation layouts. This is a three stage process. The stages in this process are revenue, active subscribers, acquisition.

Competitor Analysis Ppt PowerPoint Presentation Infographic Template Elements
This is a competitor analysis ppt powerpoint presentation infographic template elements. This is a four stage process. The stages in this process are revenue, sales, business, marketing, finance.
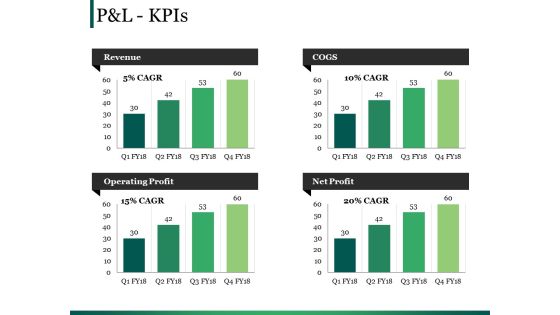
Pandl Kpis Ppt PowerPoint Presentation Outline Gallery
This is a pandl kpis ppt powerpoint presentation outline gallery. This is a four stage process. The stages in this process are revenue, cogs, operating profit, net profit.

Internet Marketing Objectives Ppt PowerPoint Presentation Layouts Smartart
This is a internet marketing objectives ppt powerpoint presentation layouts smartart. This is a six stage process. The stages in this process are sales leads, product types, sales revenue, profit margins, repeat sales, web visitors.
Pandl Kpis Tabular Form Ppt PowerPoint Presentation Gallery Icon
This is a pandl kpis tabular form ppt powerpoint presentation gallery icon. This is a four stage process. The stages in this process are revenue, cogs, operating profit, net profit.
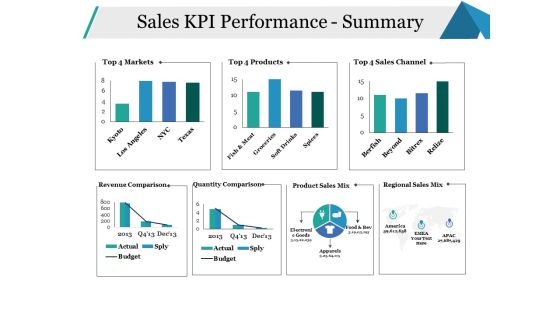
Sales KPI Performance Summary Ppt PowerPoint Presentation Infographics Model
This is a sales kpi performance summary ppt powerpoint presentation infographics model. This is a seven stage process. The stages in this process are sales channel, revenue comparison, quantity comparison, business, marketing.

 Home
Home