Financial Graphs

Clustered Column Ppt PowerPoint Presentation Ideas Format Ideas
This is a clustered column ppt powerpoint presentation ideas format ideas. This is a two stage process. The stages in this process are business, marketing, graph, finance, strategy.
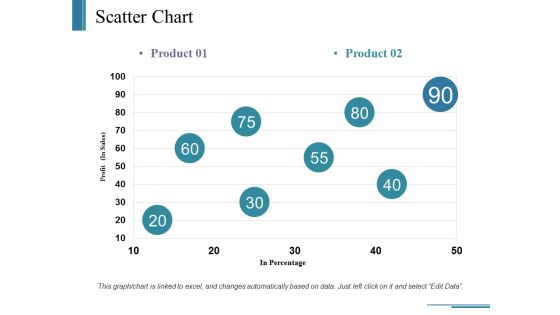
Scatter Chart Ppt PowerPoint Presentation Ideas Example
This is a scatter chart ppt powerpoint presentation ideas example. This is a two stage process. The stages in this process are business, in percentage, profit, marketing, graph.

Stacked Bar Ppt PowerPoint Presentation Gallery Summary
This is a stacked bar ppt powerpoint presentation gallery summary. This is a two stage process. The stages in this process are business, marketing, graph, unit count, finance.

Area Chart Ppt PowerPoint Presentation Outline Examples
This is a area chart ppt powerpoint presentation outline examples. This is a two stage process. The stages in this process are business, marketing, graph, finance, strategy.
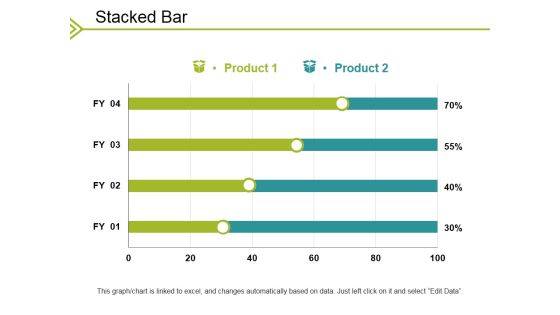
Stacked Bar Ppt PowerPoint Presentation File Outfit
This is a stacked bar ppt powerpoint presentation file outfit. This is a two stage process. The stages in this process are business, in percentage, marketing, strategy, graph.

Data Collection Histograms Ppt PowerPoint Presentation Show Topics
This is a data collection histograms ppt powerpoint presentation show topics. This is a seven stage process. The stages in this process are business, marketing, histogram, finance, graph.

Area Chart Ppt PowerPoint Presentation Outline Good
This is a area chart ppt powerpoint presentation outline good. This is a two stage process. The stages in this process are business, chart, marketing, finance, strategy, graph.

Column Chart Ppt PowerPoint Presentation Outline Deck
This is a column chart ppt powerpoint presentation outline deck. This is a two stage process. The stages in this process are business, marketing, expenditure in, years, graph.

Column Chart Ppt PowerPoint Presentation Ideas Deck
This is a column chart ppt powerpoint presentation ideas deck. This is a two stage process. The stages in this process are business, marketing, dollars, in years, graph.

Cash Flow Statement Kpis Ppt PowerPoint Presentation Clipart
This is a cash flow statement kpis ppt powerpoint presentation clipart. This is a four stage process. The stages in this process are business, marketing, finance, graph, strategy.

Balance Sheet Kpis Ppt PowerPoint Presentation File Picture
This is a balance sheet kpis ppt powerpoint presentation file picture. This is a four stage process. The stages in this process are business, marketing, finance, graph, cagr.

Competitive Analysis Ppt PowerPoint Presentation Summary Picture
This is a competitive analysis ppt powerpoint presentation summary picture. This is a one stage process. The stages in this process are business, marketing, competitive analysis, finance, graph.

Demand Statistics Ppt PowerPoint Presentation Pictures Format Ideas
This is a demand statistics ppt powerpoint presentation pictures format ideas. This is a four stage process. The stages in this process are business, marketing, finance, graph, years.

Radar Chart Ppt PowerPoint Presentation Styles Deck
This is a radar chart ppt powerpoint presentation styles deck. This is a two stage process. The stages in this process are business, radar chart, finance, strategy, graph.
Stacked Bar Ppt PowerPoint Presentation Icon Deck
This is a stacked bar ppt powerpoint presentation icon deck. This is a three stage process. The stages in this process are business, unit count, marketing, strategy, graph.

Clustered Bar Ppt PowerPoint Presentation Slides Deck
This is a clustered bar ppt powerpoint presentation slides deck. This is a two stage process. The stages in this process are product, profit, bar graph.

Sales Projections Ppt PowerPoint Presentation Model Examples
This is a sales projections ppt powerpoint presentation model examples. This is a five stage process. The stages in this process are on sales, in years, bar graph.
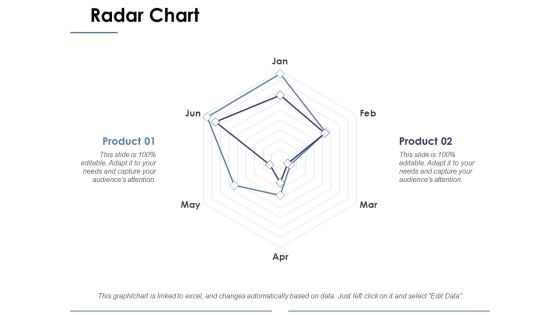
Radar Chart Ppt PowerPoint Presentation Portfolio Portrait
This is a radar chart ppt powerpoint presentation portfolio portrait. This is a two stage process. The stages in this process are business, radar chart, marketing, graph, strategy.

Clustered Column Ppt PowerPoint Presentation Styles Templates
This is a clustered column ppt powerpoint presentation styles templates. This is a two stage process. The stages in this process are product, profit, bar graph.

Stratification Ppt PowerPoint Presentation Infographic Template Rules
This is a stratification ppt powerpoint presentation infographic template rules. This is a three stage process. The stages in this process are stratification, reactor, purity, iron, chart graph.
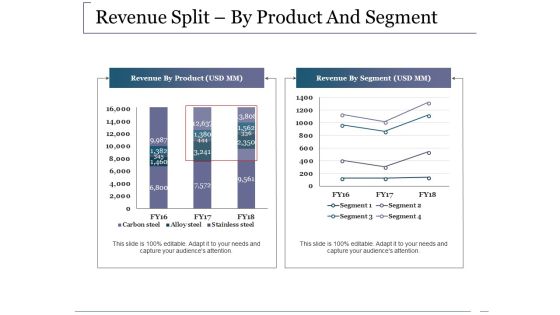
Revenue Split By Product And Segment Ppt PowerPoint Presentation Outline Shapes
This is a revenue split by product and segment ppt powerpoint presentation outline shapes. This is a two stage process. The stages in this process are business, revenue by product, revenue by segment, marketing, graph.

Revenue Split By Quarter And Geography Ppt PowerPoint Presentation Gallery Deck
This is a revenue split by quarter and geography ppt powerpoint presentation gallery deck. This is a two stage process. The stages in this process are business, marketing, graph, revenue split by quarter, revenue split by geography.

Revenue Split By Product Segment Template 2 Ppt PowerPoint Presentation Gallery Example File
This is a revenue split by product segment template 2 ppt powerpoint presentation gallery example file. This is a four stage process. The stages in this process are business, marketing, graph, finance, revenue split.

Competitor Revenue And Profit Template Ppt PowerPoint Presentation Model Design Inspiration
This is a competitor revenue and profit template ppt powerpoint presentation model design inspiration. This is a five stage process. The stages in this process are business, marketing, graph, success, growth.

Competitor Revenue And Profit Template 1 Ppt PowerPoint Presentation Layouts Display
This is a competitor revenue and profit template 1 ppt powerpoint presentation layouts display. This is a five stage process. The stages in this process are business, bar graph, finance, marketing, analysis.
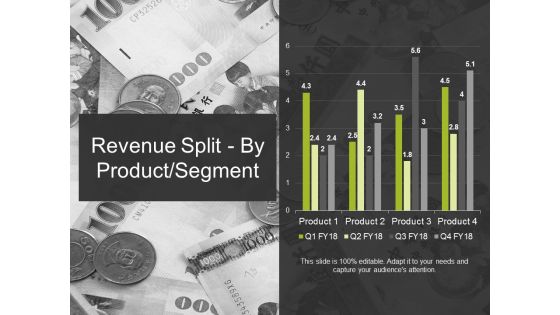
Revenue Split By Product Segment Template 2 Ppt PowerPoint Presentation Ideas Graphic Images
This is a revenue split by product segment template 2 ppt powerpoint presentation ideas graphic images. This is a four stage process. The stages in this process are business, marketing, finance, graph, strategy.

Competitor Market Share And Sales Revenues Ppt PowerPoint Presentation Professional Design Inspiration
This is a competitor market share and sales revenues ppt powerpoint presentation professional design inspiration. This is a four stage process. The stages in this process are your figures, development, business, marketing, graph.

Competitor Market Share And Sales Revenues Ppt PowerPoint Presentation Portfolio Pictures
This is a competitor market share and sales revenues ppt powerpoint presentation portfolio pictures. This is a four stage process. The stages in this process are business, your figures, development, marketing, graph.

Competitor Market Share And Sales Revenues Ppt PowerPoint Presentation Summary Influencers
This is a competitor market share and sales revenues ppt powerpoint presentation summary influencers. This is a four stage process. The stages in this process are business, marketing, graph, finance, strategy.

Revenue Split By Product Segment Template 2 Ppt PowerPoint Presentation Summary Good
This is a revenue split by product segment template 2 ppt powerpoint presentation summary good. This is a four stage process. The stages in this process are business, marketing, finance, strategy, graph.
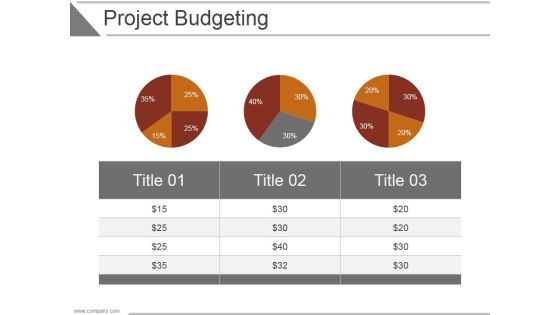
Project Budgeting Ppt PowerPoint Presentation Picture
This is a project budgeting ppt powerpoint presentation picture. This is a three stage process. The stages in this process are business, strategy, analysis, marketing, chart and graph, finance.

Budgeting Planned Actual Comparison Ppt PowerPoint Presentation Portfolio Background
This is a budgeting planned actual comparison ppt powerpoint presentation portfolio background. This is a three stage process. The stages in this process are planned cost, actual cost, value difference, deviation, bar graph.

Product Launch Budget Plan Ppt PowerPoint Presentation File Formats
This is a product launch budget plan ppt powerpoint presentation file formats. This is a seven stage process. The stages in this process are business, marketing, strategy, planning, bar graph.

Budgeting Template 3 Ppt PowerPoint Presentation Visual Aids Model
This is a budgeting template 3 ppt powerpoint presentation visual aids model. This is a five stage process. The stages in this process are bar graph, business, marketing, finance, planning.
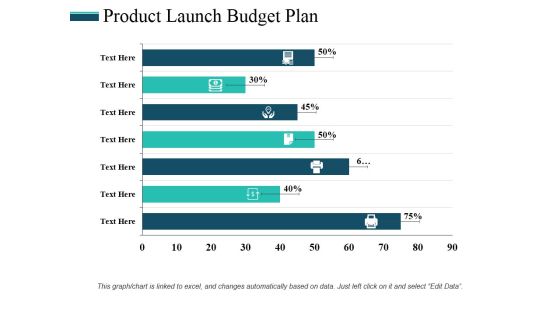
Product Launch Budget Plan Ppt PowerPoint Presentation Professional Rules
This is a product launch budget plan ppt powerpoint presentation professional rules. This is a seven stage process. The stages in this process are bar graph, finance, business, marketing, planning.

Competitor Analysis Template 1 Ppt PowerPoint Presentation File Grid
This is a competitor analysis template 1 ppt powerpoint presentation file grid. This is a four stage process. The stages in this process are finance, marketing, business, graph, analysis, revenue.

Stacked Line Ppt PowerPoint Presentation Professional Graphics Pictures
This is a stacked line ppt powerpoint presentation professional graphics pictures. This is a two stage process. The stages in this process are revenue in percentage, business, marketing, graph, finance.

Company Sales And Performance Dashboard Ppt PowerPoint Presentation Show Structure
This is a company sales and performance dashboard ppt powerpoint presentation show structure. This is a four stage process. The stages in this process are year product sales, month growth in revenue, profit margins graph, year profits.

Grow Capital Through Equity Debt Major Client And Total Revenue In Other Sectors Microsoft PDF
The slide provides a list of companys clients in different sectors manufacturing, construction, financials services, energy. Mining, automobile etc. along with the total revenue from each sector.Do you have an important presentation coming up Are you looking for something that will make your presentation stand out from the rest Look no further than Grow Capital Through Equity Debt Major Client And Total Revenue In Other Sectors Microsoft PDF. With our professional designs, you can trust that your presentation will pop and make delivering it a smooth process. And with Slidegeeks, you can trust that your presentation will be unique and memorable. So why wait Grab Grow Capital Through Equity Debt Major Client And Total Revenue In Other Sectors Microsoft PDF today and make your presentation stand out from the rest.

Grow Capital Through Equity Debt Brief Introduction With Revenue Split Background PDF
The slide provides the brief introduction about the company introducing IPO. key points included are business overview, mission, vision, five years financials revenue, operating net margin and revenue split by business operations.Retrieve professionally designed Grow Capital Through Equity Debt Brief Introduction With Revenue Split Background PDF to effectively convey your message and captivate your listeners. Save time by selecting pre-made slideshows that are appropriate for various topics, from business to educational purposes. These themes come in many different styles, from creative to corporate, and all of them are easily adjustable and can be edited quickly. Access them as PowerPoint templates or as Google Slides themes. You do not have to go on a hunt for the perfect presentation because Slidegeeks got you covered from everywhere.

Herbal Products Company Profile Revenue Operating Profit And PAT Clipart PDF
This slide highlights the Dabur company financials from 2017 to 22 which includes revenue from operations, operating profit and profit after tax. Slidegeeks is here to make your presentations a breeze with Herbal Products Company Profile Revenue Operating Profit And PAT Clipart PDF With our easy to use and customizable templates, you can focus on delivering your ideas rather than worrying about formatting. With a variety of designs to choose from, you are sure to find one that suits your needs. And with animations and unique photos, illustrations, and fonts, you can make your presentation pop. So whether you are giving a sales pitch or presenting to the board, make sure to check out Slidegeeks first.
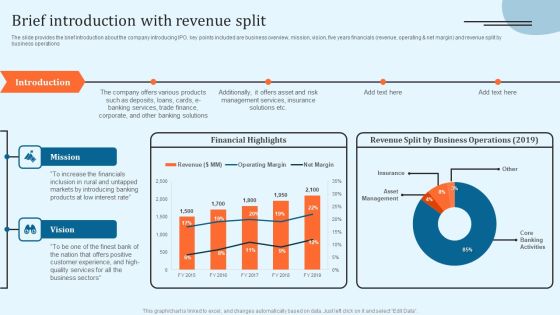
Equity Debt And Convertible Bond Investment Banking Pitch Book Brief Introduction With Revenue Split Structure PDF
The slide provides the brief introduction about the company introducing IPO. key points included are business overview, mission, vision, five years financials revenue, operating and net margin and revenue split by business operations, Presenting this PowerPoint presentation, titled Equity Debt And Convertible Bond Investment Banking Pitch Book Brief Introduction With Revenue Split Structure PDF, with topics curated by our researchers after extensive research. This editable presentation is available for immediate download and provides attractive features when used. Download now and captivate your audience. Presenting this Equity Debt And Convertible Bond Investment Banking Pitch Book Brief Introduction With Revenue Split Structure PDF. Our researchers have carefully researched and created these slides with all aspects taken into consideration. This is a completely customizable Equity Debt And Convertible Bond Investment Banking Pitch Book Brief Introduction With Revenue Split Structure PDF that is available for immediate downloading. Download now and make an impact on your audience. Highlight the attractive features available with our PPTs.

Strategy To Raise Funds Major Client And Total Revenue In Other Sectors Brochure PDF
The slide provides a list of companys clients in different sectors manufacturing, construction, financials services, energy. Mining, automobile etc. along with the total revenue from each sector. Formulating a presentation can take up a lot of effort and time, so the content and message should always be the primary focus. The visuals of the PowerPoint can enhance the presenters message, so our Strategy To Raise Funds Major Client And Total Revenue In Other Sectors Brochure PDF was created to help save time. Instead of worrying about the design, the presenter can concentrate on the message while our designers work on creating the ideal templates for whatever situation is needed. Slidegeeks has experts for everything from amazing designs to valuable content, we have put everything into Strategy To Raise Funds Major Client And Total Revenue In Other Sectors Brochure PDF.

Buy Side M And A Service Other Sectors Top Clients And Total Revenue Diagrams PDF
The slide identifies a list of companys clients in various other sectors manufacturing, construction, financials services, energy. Mining, automobile etc. along with the total revenue from each sector for the year 2021. Do you have to make sure that everyone on your team knows about any specific topic I yes, then you should give Buy Side M And A Service Other Sectors Top Clients And Total Revenue Diagrams PDF a try. Our experts have put a lot of knowledge and effort into creating this impeccable Buy Side M And A Service Other Sectors Top Clients And Total Revenue Diagrams PDF. You can use this template for your upcoming presentations, as the slides are perfect to represent even the tiniest detail. You can download these templates from the Slidegeeks website and these are easy to edit. So grab these today

Annual Customer Service Performance Review Example Of Ppt
This is a annual customer service performance review example of ppt. This is a twelve stage process. The stages in this process are bar graph, growth, data, customer, success.

Gross Margin Improvement Ppt PowerPoint Presentation Guidelines
This is a gross margin improvement ppt powerpoint presentation guidelines. This is a two stage process. The stages in this process are business, bar graph, investment, marketing, strategy, success.
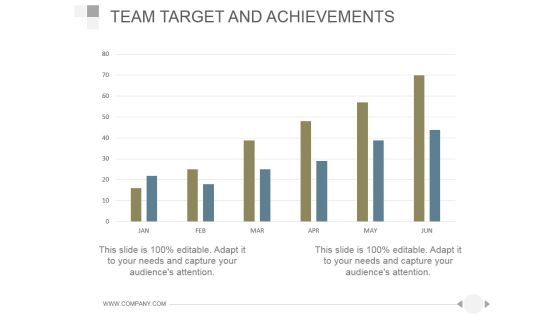
Team Target And Achievements Ppt PowerPoint Presentation Information
This is a team target and achievements ppt powerpoint presentation information. This is a six stage process. The stages in this process are chart graph, management, strategy, business, marketing.
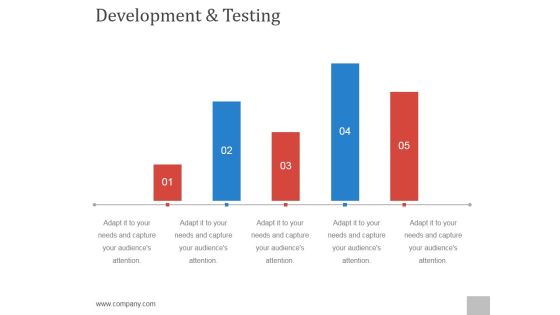
Development And Testing Ppt PowerPoint Presentation Background Designs
This is a development and testing ppt powerpoint presentation background designs. This is a five stage process. The stages in this process are step, business, growth, success, bar graph.

Us Vs The Competition Ppt PowerPoint Presentation Shapes
This is a us vs the competition ppt powerpoint presentation shapes. This is a three stage process. The stages in this process are chart graph, planning, business, marketing, strategy.
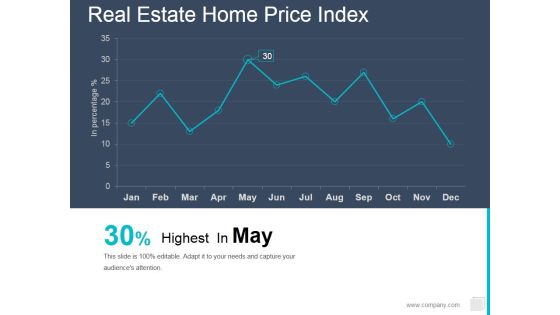
Real Estate Home Price Index Ppt PowerPoint Presentation Styles Influencers
This is a real estate home price index ppt powerpoint presentation styles influencers. This is a one stage process. The stages in this process are graph, growth, jan, feb, mar apr.
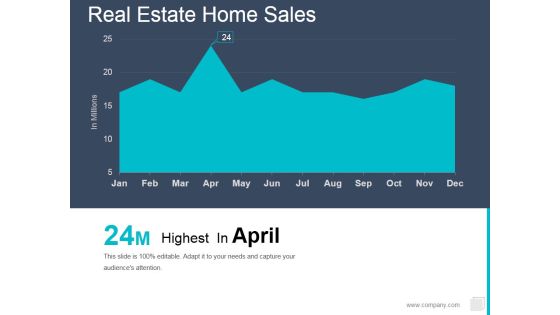
Real Estate Home Sales Ppt PowerPoint Presentation Professional Graphic Tips
This is a real estate home sales ppt powerpoint presentation professional graphic tips. This is a one stage process. The stages in this process are jan, feb, mar, apr, may, graph.

Our Channel Sales Numbers Ppt PowerPoint Presentation Ideas Inspiration
This is a our channel sales numbers ppt powerpoint presentation ideas inspiration. This is a four stage process. The stages in this process are graph, marketing, strategy, planning, success.

High Low Close Chart Ppt Powerpoint Presentation Gallery Slides
This is a high low close chart ppt powerpoint presentation gallery slides. This is a five stage process. The stages in this process are close, volume, high, low, graph.
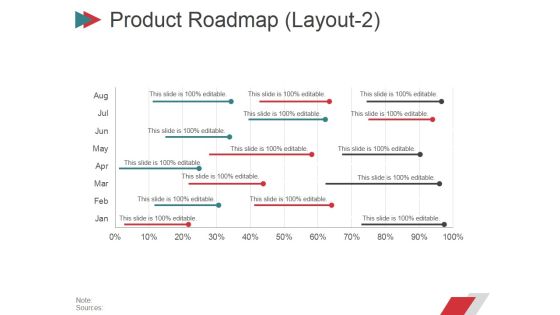
Product Roadmap Layout2 Ppt PowerPoint Presentation Infographic Template Clipart
This is a product roadmap layout2 ppt powerpoint presentation infographic template clipart. This is a five stage process. The stages in this process are business, marketing, graph, finance, planning.
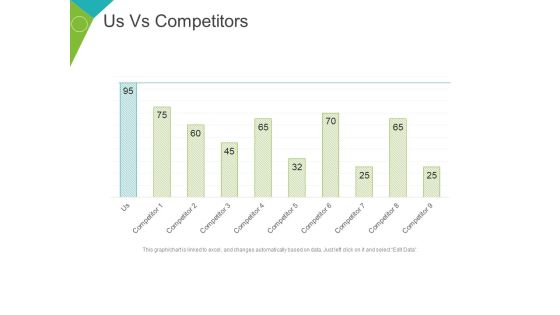
Us Vs Competitors Template 2 Ppt PowerPoint Presentation File Show
This is a us vs competitors template 2 ppt powerpoint presentation file show. This is a nine stage process. The stages in this process are competitor, graph, business, marketing, finance.

Gap Between Current And Required Staff Ppt PowerPoint Presentation Ideas Format Ideas
This is a gap between current and required staff ppt powerpoint presentation ideas format ideas. This is a five stage process. The stages in this process are number of staff, category, current, graph, finance.

Clustered Column Line Ppt PowerPoint Presentation Infographics Templates
This is a clustered column line ppt powerpoint presentation infographics templates. This is a three stage process. The stages in this process are in percentage, business, marketing, product, finance, graph.

Clustered Column Ppt PowerPoint Presentation Slides Ideas
This is a clustered column ppt powerpoint presentation slides ideas. This is a two stage process. The stages in this process are sales in percentage, business, marketing, finance, graph.

Stacked Column Ppt PowerPoint Presentation Infographics Samples
This is a stacked column ppt powerpoint presentation infographics samples. This is a two stage process. The stages in this process are product, sales in percentage, business, marketing, graph.

Sales Forecasting Template 2 Ppt PowerPoint Presentation Infographic Template Examples
This is a sales forecasting template 2 ppt powerpoint presentation infographic template examples. This is a two stage process. The stages in this process are forecasting, business, marketing, finance, graph.
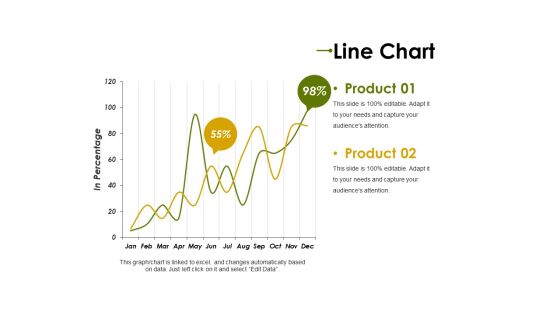
Line Chart Ppt PowerPoint Presentation Professional Clipart Images
This is a line chart ppt powerpoint presentation professional clipart images. This is a two stage process. The stages in this process are product, in percentage, graph, percentage, finance, business.
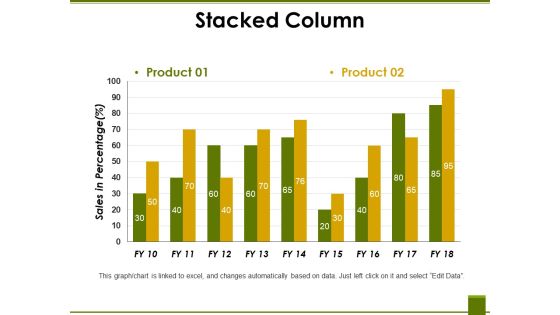
Stacked Column Ppt PowerPoint Presentation Professional Vector
This is a stacked column ppt powerpoint presentation professional vector. This is a two stage process. The stages in this process are product, sales in percentage, business, marketing, graph.

Bar Chart Ppt PowerPoint Presentation Layouts Pictures
This is a bar chart ppt powerpoint presentation layouts pictures. This is a three stage process. The stages in this process are bar graph, product, sales in percentage, business, marketing.

Area Chart Ppt PowerPoint Presentation Show Templates
This is a area chart ppt powerpoint presentation show templates. This is a two stage process. The stages in this process are product, in percentage, in years, finance, graph.

Bar Chart Ppt PowerPoint Presentation Outline Guidelines
This is a bar chart ppt powerpoint presentation outline guidelines. This is a four stage process. The stages in this process are product, unit count, in years, graph, finance, business.
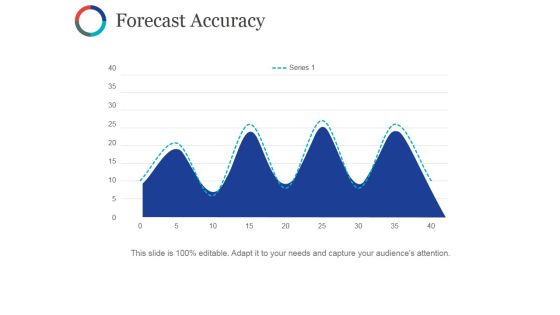
Forecast Accuracy Template Ppt PowerPoint Presentation Styles Format Ideas
This is a forecast accuracy template ppt powerpoint presentation styles format ideas. This is a four stage process. The stages in this process are business, marketing, strategy, graph, planning.
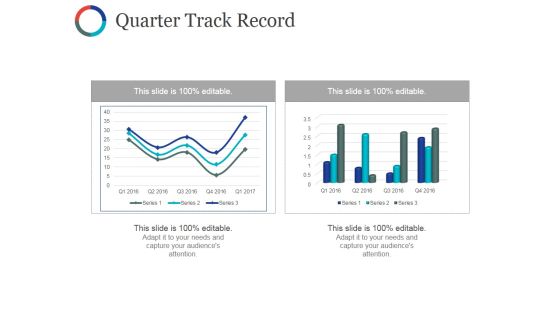
Quarter Track Record Ppt PowerPoint Presentation Professional Layout Ideas
This is a quarter track record ppt powerpoint presentation professional layout ideas. This is a two stage process. The stages in this process are business, marketing, finance, graph, plan.
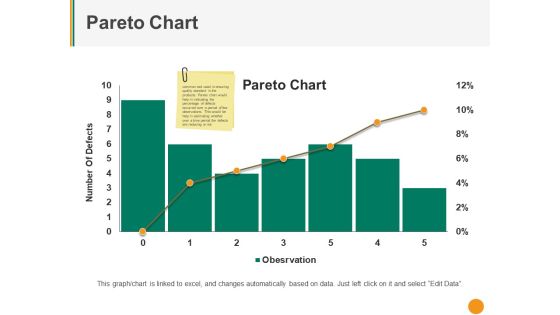
Pareto Chart Ppt PowerPoint Presentation Inspiration Master Slide
This is a pareto chart ppt powerpoint presentation inspiration master slide. This is a six stage process. The stages in this process are number of defects, pareto chart, finance, business, graph.

Clustered Bar Ppt PowerPoint Presentation Show Slide Portrait
This is a clustered bar ppt powerpoint presentation show slide portrait. This is a four stage process. The stages in this process are product, unit count, graph, business, marketing.

Clustered Column Ppt PowerPoint Presentation Professional Graphic Tips
This is a clustered column ppt powerpoint presentation professional graphic tips. This is a two stage process. The stages in this process are product, profit in percentage, graph, business, marketing.

Pareto Chart Ppt PowerPoint Presentation File Infographic Template
This is a pareto chart ppt powerpoint presentation file infographic template. This is a six stage process. The stages in this process are number of defects, business, marketing, graph.

Volume Open High Low Close Chart Ppt PowerPoint Presentation Ideas Graphics Example
This is a volume open high low close chart ppt powerpoint presentation ideas graphics example. This is a five stage process. The stages in this process are business, bar graph, stock, cost, market.

Clustered Column Ppt PowerPoint Presentation Inspiration Shapes
This is a clustered column ppt powerpoint presentation inspiration shapes. This is a two stage process. The stages in this process are profit in percentage, business, marketing, graph, finance.

Stock Chart Ppt PowerPoint Presentation Summary File Formats
This is a stock chart ppt powerpoint presentation summary file formats. This is a five stage process. The stages in this process are high, volume, low, business, graph, finance.

Stacked Area Clustered Column Ppt PowerPoint Presentation Ideas Show
This is a stacked area clustered column ppt powerpoint presentation ideas show. This is a three stage process. The stages in this process are in percentage, business, marketing, finance, graph.
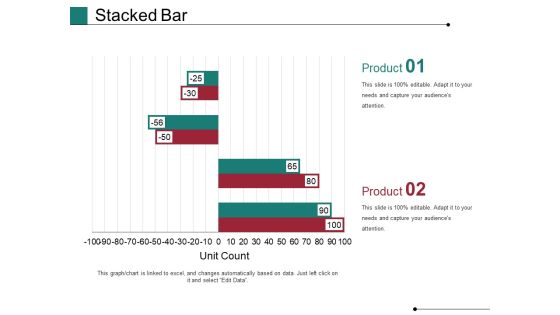
Stacked Bar Template 1 Ppt PowerPoint Presentation Show Slides
This is a stacked bar template 1 ppt powerpoint presentation show slides. This is a two stage process. The stages in this process are Unit Count, Business, Marketing, Graph, Finance.
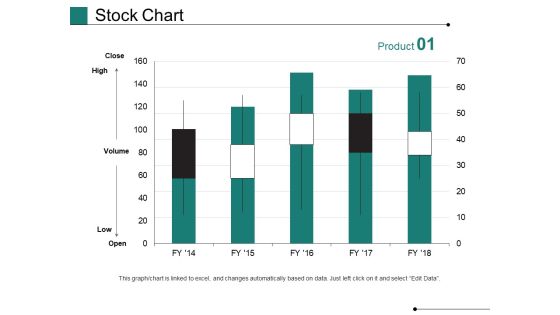
Stock Chart Ppt PowerPoint Presentation Pictures Graphics Design
This is a stock chart ppt powerpoint presentation pictures graphics design. This is a five stage process. The stages in this process are high, volume, low, business, marketing, graph.

Stacked Bar Ppt PowerPoint Presentation Infographic Template Infographic Template
This is a stacked bar ppt powerpoint presentation infographic template infographic template. This is a four stage process. The stages in this process are business, marketing, finance, slide bar, graph.
Stacked Area Clustered Column Ppt PowerPoint Presentation Icon Aids
This is a stacked area clustered column ppt powerpoint presentation icon aids. This is a three stage process. The stages in this process are business, marketing, finance, bar, graph.

Customer Acquisition Cost By Channel Template 1 Ppt PowerPoint Presentation Portfolio Mockup
This is a customer acquisition cost by channel template 1 ppt powerpoint presentation portfolio mockup. This is a five stage process. The stages in this process are finance, business, graph, online, marketing.
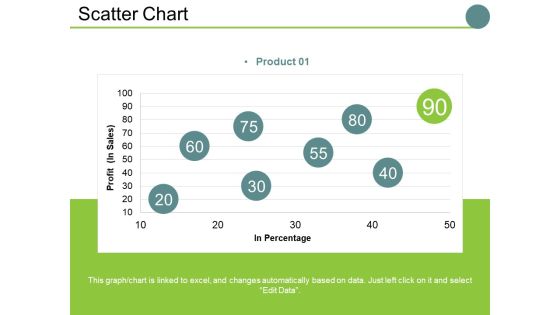
Scatter Chart Ppt PowerPoint Presentation Slides Examples
This is a scatter chart ppt powerpoint presentation slides examples. This is a one stage process. The stages in this process are profit , in percentage, business, marketing, finance, graph.
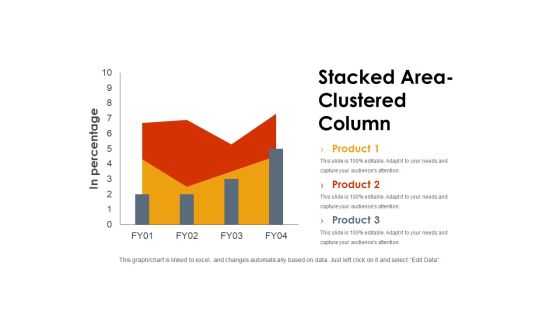
Stacked Area Clustered Column Ppt PowerPoint Presentation Styles Background Image
This is a stacked area clustered column ppt powerpoint presentation styles background image. This is a three stage process. The stages in this process are in percentage, graph, business, marketing, finance.
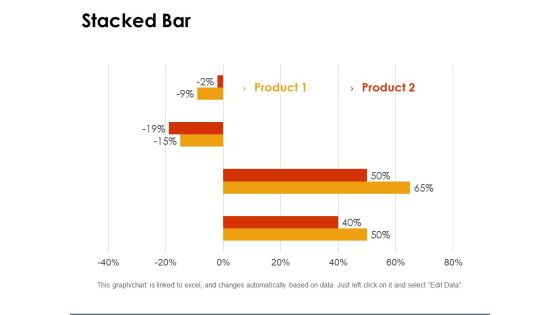
Stacked Bar Template 1 Ppt PowerPoint Presentation Gallery Clipart
This is a stacked bar template 1 ppt powerpoint presentation gallery clipart. This is a two stage process. The stages in this process are percentage, graph, business, marketing, finance.

Area Chart Ppt PowerPoint Presentation Professional Brochure
This is a area chart ppt powerpoint presentation professional brochure. This is a two stage process. The stages in this process are sales in percentage, business, marketing, finance, graph.

Bar Chart Ppt PowerPoint Presentation Portfolio Diagrams
This is a bar chart ppt powerpoint presentation portfolio diagrams. This is a three stage process. The stages in this process are sales in percentage, business, marketing, graph, finance.

Stacked Line With Markers Ppt PowerPoint Presentation Infographic Template Graphics Example
This is a stacked line with markers ppt powerpoint presentation infographic template graphics example. This is a one stage process. The stages in this process are in million, task, product, finance, line graph.

Stacked Bar Template Ppt PowerPoint Presentation Summary Visual Aids
This is a stacked bar template ppt powerpoint presentation summary visual aids. This is a three stage process. The stages in this process are unit count, business, marketing, finance, graph.
Scatter Chart Template 2 Ppt PowerPoint Presentation Slides Icons
This is a scatter chart template 2 ppt powerpoint presentation slides icons. This is a two stage process. The stages in this process are business, marketing, graph, in percentage, finance.
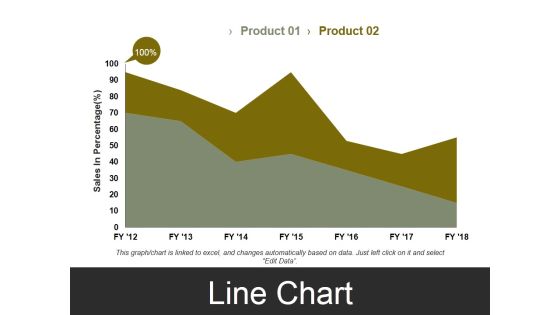
Line Chart Template 3 Ppt PowerPoint Presentation Styles Visual Aids
This is a line chart template 3 ppt powerpoint presentation styles visual aids. This is a two stage process. The stages in this process are sales in percentage, business, marketing, finance, graph.

Stacked Bar Ppt PowerPoint Presentation Styles Slide Portrait
This is a stacked bar ppt powerpoint presentation styles slide portrait. This is a three stage process. The stages in this process are unit count, business, marketing, strategy, graph, finance.
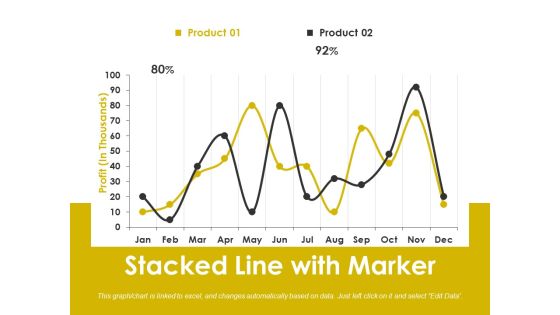
Stacked Line With Marker Ppt PowerPoint Presentation Slides File Formats
This is a stacked line with marker ppt powerpoint presentation slides file formats. This is a two stage process. The stages in this process are business, marketing, strategy, graph, finance, percentage.

Clustered Column Template 1 Ppt PowerPoint Presentation Outline File Formats
This is a clustered column template 1 ppt powerpoint presentation outline file formats. This is a two stage process. The stages in this process are product, bar graph, success, growth, finance.

clustered column line ppt powerpoint presentation ideas example
This is a clustered column line ppt powerpoint presentation ideas example. This is a three stage process. The stages in this process are sales in percentage, business, marketing, finance, graph.

Satisfaction With Word Of Mouth Marketing And Social Media Tactics Ppt PowerPoint Presentation Styles Examples
This is a satisfaction with word of mouth marketing and social media tactics ppt powerpoint presentation styles examples. This is a one stage process. The stages in this process are business, marketing, finance, strategy, graph.

Bar Chart Ppt PowerPoint Presentation Icon Introduction
This is a bar chart ppt powerpoint presentation icon introduction. This is a seven stage process. The stages in this process are in years, in percentage, business, marketing, graph.

Sales Performance Of Competitors Ppt PowerPoint Presentation Portfolio Sample
This is a sales performance of competitors ppt powerpoint presentation portfolio sample. This is a three stage process. The stages in this process are business, marketing, finance, graph, years.

Column Chart Ppt PowerPoint Presentation Model Background Images
This is a column chart ppt powerpoint presentation model background images. This is a six stage process. The stages in this process are bar graph, marketing, finance, strategy, planning.

Quarter Track Record Ppt PowerPoint Presentation Styles Master Slide
This is a quarter track record ppt powerpoint presentation styles master slide. This is a two stage process. The stages in this process are business, graph, marketing, finance, planning.
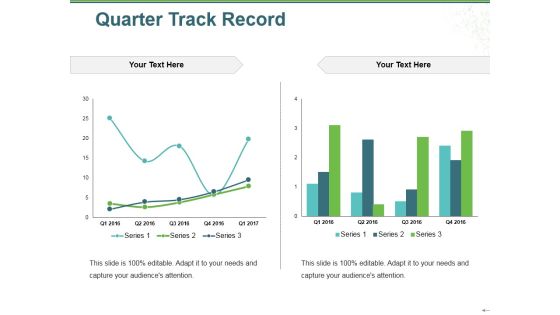
Quarter Track Record Ppt PowerPoint Presentation Gallery Images
This is a quarter track record ppt powerpoint presentation gallery images. This is a two stage process. The stages in this process are series, bar graph, growth, success, business.
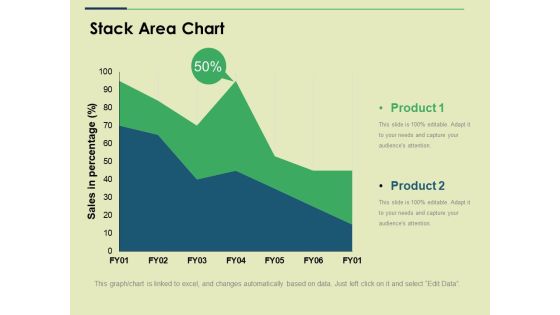
Stack Area Chart Ppt PowerPoint Presentation Show Slide
This is a stack area chart ppt powerpoint presentation show slide. This is a two stage process. The stages in this process are sales in percentage, business, marketing, strategy, graph.
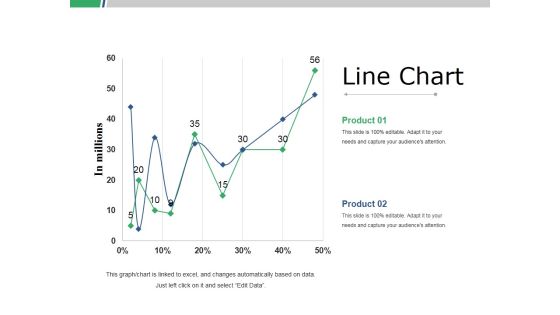
Line Chart Ppt PowerPoint Presentation Slides Graphics Template
This is a line chart ppt powerpoint presentation slides graphics template. This is a two stage process. The stages in this process are business, marketing, strategy, line graph, finance.

Stacked Line Ppt PowerPoint Presentation Layouts Sample
This is a stacked line ppt powerpoint presentation layouts sample. This is a three stage process. The stages in this process are in percentage, business, marketing, finance, graph, strategy.
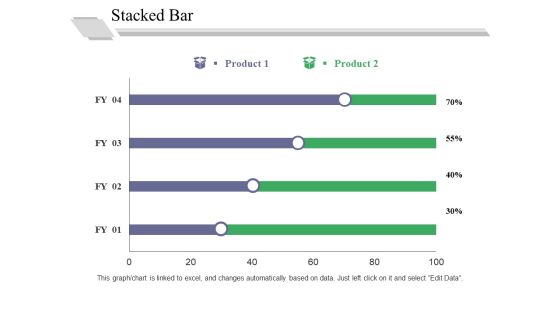
Stacked Bar Template 1 Ppt PowerPoint Presentation Outline Good
This is a stacked bar template 1 ppt powerpoint presentation outline good. This is a two stage process. The stages in this process are in percentage, business, marketing, graph, strategy.
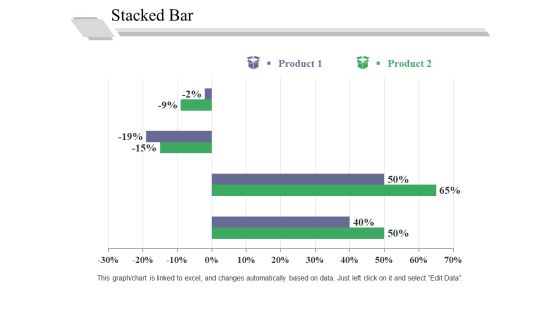
Stacked Bar Template 2 Ppt PowerPoint Presentation Professional Graphics Pictures
This is a stacked bar template 2 ppt powerpoint presentation professional graphics pictures. This is a two stage process. The stages in this process are in percentage, business, marketing, graph, strategy.
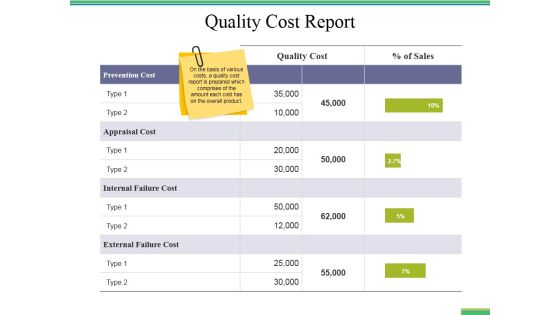
Quality Cost Report Ppt PowerPoint Presentation Styles Infographic Template
This is a quality cost report ppt powerpoint presentation styles infographic template. This is a five stage process. The stages in this process are business, finance, marketing, strategy, bar graph, analysis.
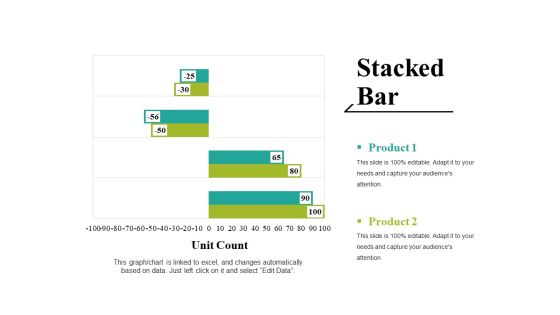
Stacked Bar Ppt PowerPoint Presentation Ideas Graphics Tutorials
This is a stacked bar ppt powerpoint presentation ideas graphics tutorials. This is a two stage process. The stages in this process are unit count, graph, business, marketing, strategy.
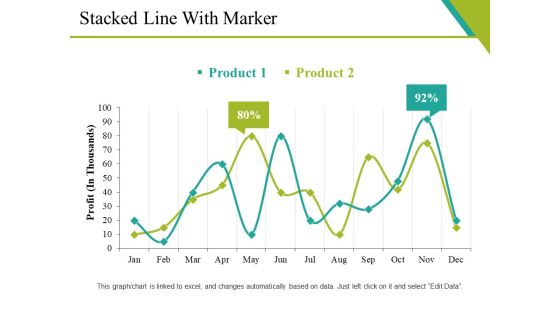
Stacked Line With Marker Ppt PowerPoint Presentation Gallery Diagrams
This is a stacked line with marker ppt powerpoint presentation gallery diagrams. This is a two stage process. The stages in this process are graph, business, marketing, strategy, profit.

Competitors Average Price Product Ppt PowerPoint Presentation Inspiration Templates
This is a competitors average price product ppt powerpoint presentation inspiration templates. This is a five stage process. The stages in this process are business, finance, analysis, growth, investment, bar graph.

Social Media Analysis Ppt PowerPoint Presentation Model Portfolio
This is a social media analysis ppt powerpoint presentation model portfolio. This is a four stage process. The stages in this process are bar graph, marketing, strategy, finance, planning.

Competitors Average Price Product Ppt PowerPoint Presentation Ideas Layouts
This is a competitors average price product ppt powerpoint presentation ideas layouts. This is a five stage process. The stages in this process are business, bar graph, finance, marketing, analysis.

Competitors Average Price Product Ppt PowerPoint Presentation Styles Ideas
This is a competitors average price product ppt powerpoint presentation styles ideas. This is a five stage process. The stages in this process are business, bar graph, finance, marketing, strategy, analysis.

Clustered Bar Ppt PowerPoint Presentation Outline Slide Download
This is a clustered bar ppt powerpoint presentation outline slide download. This is a three stage process. The stages in this process are unit count, finance, marketing, business, graph.

Competitor Analysis Template 3 Ppt PowerPoint Presentation Inspiration Visuals
This is a competitor analysis template 3 ppt powerpoint presentation inspiration visuals. This is a four stage process. The stages in this process are business, marketing, cost of goods sold, analysis, graph.

Competitor Analysis Template 4 Ppt PowerPoint Presentation Gallery Design Templates
This is a competitor analysis template 4 ppt powerpoint presentation gallery design templates. This is a four stage process. The stages in this process are business, marketing, analysis, graph, net profit margin.

Customer Service Benchmarking Template 1 Ppt PowerPoint Presentation Icon Design Inspiration
This is a customer service benchmarking template 1 ppt powerpoint presentation icon design inspiration. This is a six stage process. The stages in this process are business, marketing, graph, strategy, percentage.

Clustered Column Ppt PowerPoint Presentation Visual Aids Show
This is a clustered column ppt powerpoint presentation visual aids show. This is a two stage process. The stages in this process are product, profit, business, bar graph, finance.

Column Chart Ppt PowerPoint Presentation Icon Guide
This is a column chart ppt powerpoint presentation icon guide. This is a two stage process. The stages in this process are business, year, sales in percentage, marketing, graph.

Xx Is Targeting A Large Addressable Market Ppt PowerPoint Presentation Portfolio File Formats
This is a xx is targeting a large addressable market ppt powerpoint presentation portfolio file formats. This is a two stage process. The stages in this process are usd, business, marketing, finance, graph, strategy.

Shareholding Pattern Ppt PowerPoint Presentation Inspiration Outline
This is a shareholding pattern ppt powerpoint presentation inspiration outline. This is a six stage process. The stages in this process are business, marketing, graph, before funding, after funding, total shares, percentage.

Competitors Average Price Product Ppt PowerPoint Presentation Summary Deck
This is a competitors average price product ppt powerpoint presentation summary deck. This is a five stage process. The stages in this process are business, marketing, strategy, graph, finance.

 Home
Home