Financial Graphs

Assessing Debt And Equity Fundraising Alternatives For Business Growth Assessing Debt And Failure Rate Pictures PDF
This slide showcases graph that can help organization to evaluate failure rate of previously crowdfunded companies. It illustrated graph That shows failure rate at seed stage for a period of last 4 financial years. Here you can discover an assortment of the finest PowerPoint and Google Slides templates. With these templates, you can create presentations for a variety of purposes while simultaneously providing your audience with an eye catching visual experience. Download Assessing Debt And Equity Fundraising Alternatives For Business Growth Assessing Debt And Failure Rate Pictures PDF to deliver an impeccable presentation. These templates will make your job of preparing presentations much quicker, yet still, maintain a high level of quality. Slidegeeks has experienced researchers who prepare these templates and write high quality content for you. Later on, you can personalize the content by editing the Assessing Debt And Equity Fundraising Alternatives For Business Growth Assessing Debt And Failure Rate Pictures PDF.

Column Chart Analysis Ppt PowerPoint Presentation Pictures Sample
Presenting this set of slides with name column chart analysis ppt powerpoint presentation pictures sample. The topics discussed in these slides are column chart, product, financial year, sales, marketing. This is a completely editable PowerPoint presentation and is available for immediate download. Download now and impress your audience.

Combo Chart Finance Ppt PowerPoint Presentation Summary Images
Presenting this set of slides with name combo chart finance ppt powerpoint presentation summary images. The topics discussed in these slides are combo chart, product, growth rate, market size, financial year. This is a completely editable PowerPoint presentation and is available for immediate download. Download now and impress your audience.
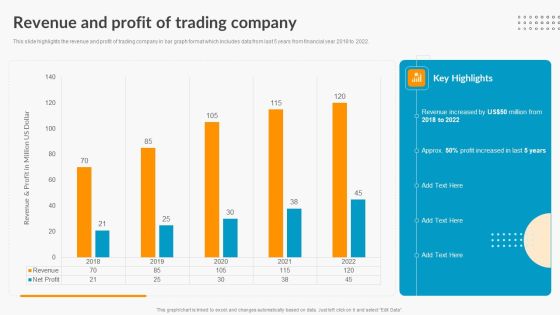
Revenue And Profit Of Trading Company Export Trade Business Profile Ideas PDF
This slide highlights the revenue and profit of trading company in bar graph format which includes data from last 5 years from financial year 2018 to 2022.Are you searching for a Revenue And Profit Of Trading Company Export Trade Business Profile Ideas PDF that is uncluttered, straightforward, and original Its easy to edit, and you can change the colors to suit your personal or business branding. For a presentation that expresses how much effort you ve put in, this template is ideal With all of its features, including tables, diagrams, statistics, and lists, its perfect for a business plan presentation. Make your ideas more appealing with these professional slides. Download Revenue And Profit Of Trading Company Export Trade Business Profile Ideas PDF from Slidegeeks today.
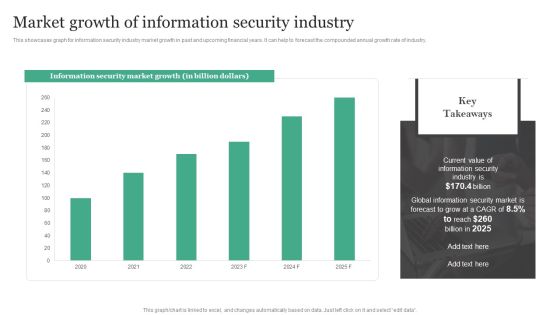
Market Growth Of Information Security Industry Information Security Risk Administration Rules PDF
This showcases graph for information security industry market growth in past and upcoming financial years. It can help to forecast the compounded annual growth rate of industry. This Market Growth Of Information Security Industry Information Security Risk Administration Rules PDF is perfect for any presentation, be it in front of clients or colleagues. It is a versatile and stylish solution for organizing your meetings. The Market Growth Of Information Security Industry Information Security Risk Administration Rules PDF features a modern design for your presentation meetings. The adjustable and customizable slides provide unlimited possibilities for acing up your presentation. Slidegeeks has done all the homework before launching the product for you. So, do not wait, grab the presentation templates today

Market Growth Of Information Security Industry Cybersecurity Risk Assessment Portrait PDF
This slide showcases graph for information security industry market growth in past and upcoming financial years. It can help to forecast the compounded annual growth rate of industry. Do you know about Slidesgeeks Market Growth Of Information Security Industry Cybersecurity Risk Assessment Portrait PDF These are perfect for delivering any kind od presentation. Using it, create PowerPoint presentations that communicate your ideas and engage audiences. Save time and effort by using our pre-designed presentation templates that are perfect for a wide range of topic. Our vast selection of designs covers a range of styles, from creative to business, and are all highly customizable and easy to edit. Download as a PowerPoint template or use them as Google Slides themes.
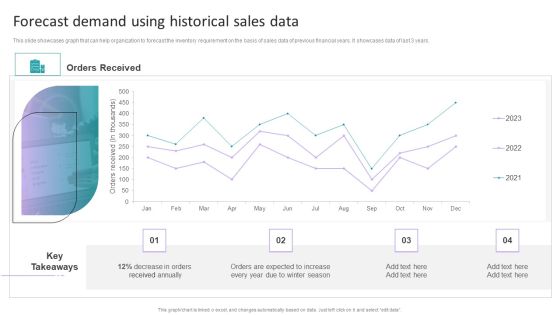
Stock Inventory Acquisition Forecast Demand Using Historical Sales Data Themes PDF
This slide showcases graph that can help organization to forecast the inventory requirement on the basis of sales data of previous financial years. It showcases data of last 3 years. This Stock Inventory Acquisition Forecast Demand Using Historical Sales Data Themes PDF from Slidegeeks makes it easy to present information on your topic with precision. It provides customization options, so you can make changes to the colors, design, graphics, or any other component to create a unique layout. It is also available for immediate download, so you can begin using it right away. Slidegeeks has done good research to ensure that you have everything you need to make your presentation stand out. Make a name out there for a brilliant performance.
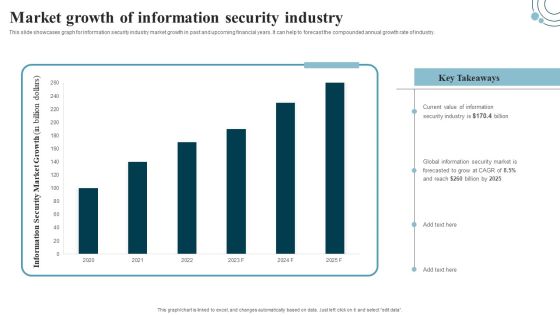
Developing IT Security Strategy Market Growth Of Information Security Industry Ideas PDF
This slide showcases graph for information security industry market growth in past and upcoming financial years. It can help to forecast the compounded annual growth rate of industry. Whether you have daily or monthly meetings, a brilliant presentation is necessary. Developing IT Security Strategy Market Growth Of Information Security Industry Ideas PDF can be your best option for delivering a presentation. Represent everything in detail using Developing IT Security Strategy Market Growth Of Information Security Industry Ideas PDF and make yourself stand out in meetings. The template is versatile and follows a structure that will cater to your requirements. All the templates prepared by Slidegeeks are easy to download and edit. Our research experts have taken care of the corporate themes as well. So, give it a try and see the results.

Retail Business Optimization Through Operational Excellence Strategy Retail Industry Growth Projections Professional PDF
This slide illustrates information about the growth projections of retail industry along with the emerging trends. Here the graph indicates that retail industry projections is estimated to hit 3.5 percent in financial year 2020. Get a simple yet stunning designed Retail Business Optimization Through Operational Excellence Strategy Retail Industry Growth Projections Professional PDF. It is the best one to establish the tone in your meetings. It is an excellent way to make your presentations highly effective. So, download this PPT today from Slidegeeks and see the positive impacts. Our easy to edit Retail Business Optimization Through Operational Excellence Strategy Retail Industry Growth Projections Professional PDF can be your go to option for all upcoming conferences and meetings. So, what are you waiting for Grab this template today.

Retail Business Operation Management To Optimize Customer Experience Retail Industry Growth Projections Elements PDF
This slide illustrates information about the growth projections of retail industry along with the emerging trends. Here the graph indicates that retail industry projections is estimated to hit 3.5 percent in financial year 2023. This Retail Business Operation Management To Optimize Customer Experience Retail Industry Growth Projections Elements PDF is perfect for any presentation, be it in front of clients or colleagues. It is a versatile and stylish solution for organizing your meetings. The Retail Business Operation Management To Optimize Customer Experience Retail Industry Growth Projections Elements PDF features a modern design for your presentation meetings. The adjustable and customizable slides provide unlimited possibilities for acing up your presentation. Slidegeeks has done all the homework before launching the product for you. So, do not wait, grab the presentation templates today
Enhancing Retail Process By Effective Inventory Management Retail Industry Growth Projections Emerging Slides PDF
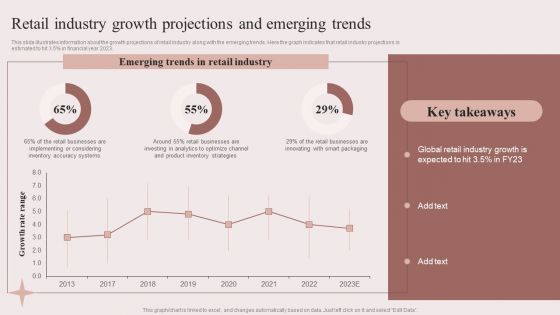
This slide illustrates information about the growth projections of retail industry along with the emerging trends. Here the graph indicates that retail industry projections is estimated to hit 3.5 percent in financial year 2023. This Enhancing Retail Process By Effective Inventory Management Retail Industry Growth Projections Emerging Slides PDF is perfect for any presentation, be it in front of clients or colleagues. It is a versatile and stylish solution for organizing your meetings. The Enhancing Retail Process By Effective Inventory Management Retail Industry Growth Projections Emerging Slides PDF features a modern design for your presentation meetings. The adjustable and customizable slides provide unlimited possibilities for acing up your presentation. Slidegeeks has done all the homework before launching the product for you. So, do not wait, grab the presentation templates today
Key Techniques To Enhance Cost Efficiency Impact Of Cost Efficiency Strategies On Business Expenses Summary PDF
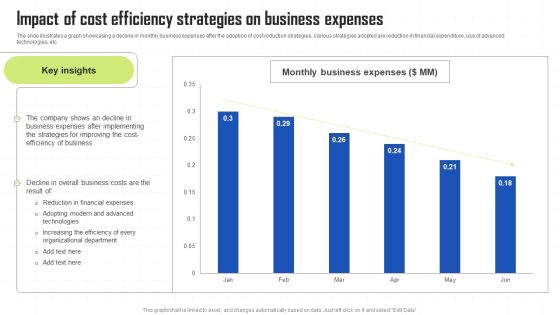
The slide illustrates a graph showcasing a decline in monthly business expenses after the adoption of cost reduction strategies. Various strategies adopted are reduction in financial expenditure, use of advanced technologies, etc. Explore a selection of the finest Key Techniques To Enhance Cost Efficiency Impact Of Cost Efficiency Strategies On Business Expenses Summary PDF here. With a plethora of professionally designed and pre made slide templates, you can quickly and easily find the right one for your upcoming presentation. You can use our Key Techniques To Enhance Cost Efficiency Impact Of Cost Efficiency Strategies On Business Expenses Summary PDF to effectively convey your message to a wider audience. Slidegeeks has done a lot of research before preparing these presentation templates. The content can be personalized and the slides are highly editable. Grab templates today from Slidegeeks.
Procurement Strategies For Reducing Stock Wastage Inventory Forecasting For Seasonal Ideas PDF
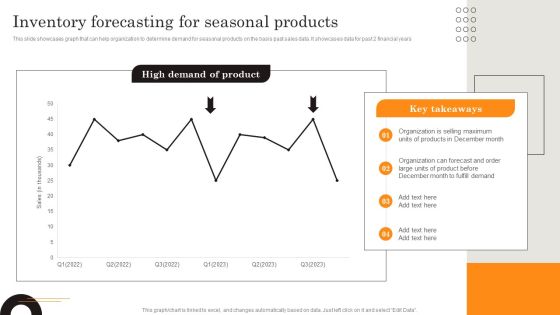
This slide showcases graph that can help organization to determine demand for seasonal products on the basis past sales data. It showcases data for past 2 financial years. Do you have to make sure that everyone on your team knows about any specific topic I yes, then you should give Procurement Strategies For Reducing Stock Wastage Inventory Forecasting For Seasonal Ideas PDF a try. Our experts have put a lot of knowledge and effort into creating this impeccable Procurement Strategies For Reducing Stock Wastage Inventory Forecasting For Seasonal Ideas PDF. You can use this template for your upcoming presentations, as the slides are perfect to represent even the tiniest detail. You can download these templates from the Slidegeeks website and these are easy to edit. So grab these today.
Strategies To Order And Manage Ideal Inventory Levels Forecast Demand Using Historical Template PDF
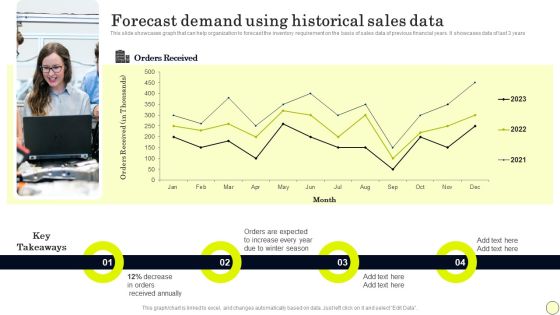
This slide showcases graph that can help organization to forecast the inventory requirement on the basis of sales data of previous financial years. It showcases data of last 3 years. Do you know about Slidesgeeks Strategies To Order And Manage Ideal Inventory Levels Forecast Demand Using Historical Template PDF These are perfect for delivering any kind od presentation. Using it, create PowerPoint presentations that communicate your ideas and engage audiences. Save time and effort by using our pre designed presentation templates that are perfect for a wide range of topic. Our vast selection of designs covers a range of styles, from creative to business, and are all highly customizable and easy to edit. Download as a PowerPoint template or use them as Google Slides themes.

Strategies To Order And Manage Ideal Inventory Levels Inventory Forecasting Elements PDF
This slide showcases graph that can help organization to determine demand for seasonal products on the basis past sales data. It showcases data for past 2 financial years. Do you have to make sure that everyone on your team knows about any specific topic I yes, then you should give Strategies To Order And Manage Ideal Inventory Levels Inventory Forecasting Elements PDF a try. Our experts have put a lot of knowledge and effort into creating this impeccable Strategies To Order And Manage Ideal Inventory Levels Inventory Forecasting Elements PDF. You can use this template for your upcoming presentations, as the slides are perfect to represent even the tiniest detail. You can download these templates from the Slidegeeks website and these are easy to edit. So grab these today.

Banking Solutions Company Overview Organization Structure Diagrams PDF
The slide highlights the company organization structure of financial bank. It showcases board of directors, audit committee of board, managing director, chief executive officer, assets laundering prevention committee, risk management committee, chief financial officer, HR director, etc. This is a Banking Solutions Company Overview Organization Structure Diagrams PDF template with various stages. Focus and dispense information on three stages using this creative set, that comes with editable features. It contains large content boxes to add your information on topics like Chief Financial Officer, Chief Executive Officer, Risk. You can also showcase facts, figures, and other relevant content using this PPT layout. Grab it now.

Forensic Fraud Accounting Unit Structure Ideas PDF
This slide covers organisation chart for a financial fraud investigation unit. It includes key stakeholders such as head of financial investigation unit, regional leaders, FIU team leaders, admin team leader and team of investigators. Persuade your audience using this Forensic Fraud Accounting Unit Structure Ideas PDF. This PPT design covers three stages, thus making it a great tool to use. It also caters to a variety of topics including Team Leader, Head Of Financial, Investigation Unit. Download this PPT design now to present a convincing pitch that not only emphasizes the topic but also showcases your presentation skills.
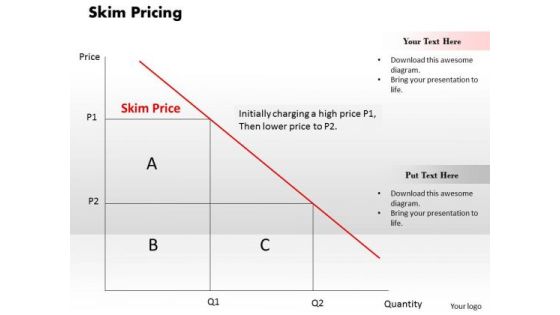
Business Framework Skim Pricing PowerPoint Presentation
This business framework power point template contains the graphic of graph. This PPT has been created with concept of skim pricing. Explain the skim pricing in your business and financial presentations by using this unique PPT.

Business Framework Capital Structure And Coc PowerPoint Presentation
This PPT slide contains the concept of capital structure and cost of capital. To display both these concept we have used graphic of chart for analyzing capital structure versus COC. Use this PPT slide in your financial presentations.

Monetary Planning And Evaluation Guide KPI Metrics Dashboard Highlighting Organization Revenue Profitability And Liquidity Ppt Diagram Images PDF
The following slide outlines key performance indicator KPI dashboard showcasing various financial metrics of the organization. The key metrics are gross revenue, product revenue, service revenue, gross profit, net profit etc. Coming up with a presentation necessitates that the majority of the effort goes into the content and the message you intend to convey. The visuals of a PowerPoint presentation can only be effective if it supplements and supports the story that is being told. Keeping this in mind our experts created Monetary Planning And Evaluation Guide KPI Metrics Dashboard Highlighting Organization Revenue Profitability And Liquidity Ppt Diagram Images PDF to reduce the time that goes into designing the presentation. This way, you can concentrate on the message while our designers take care of providing you with the right template for the situation.

Digital Products Company Outline Company Historic Revenue Graphics PDF
The slide shows annual revenue growth of the company with the CAGR for last five financial years from 2018 to 2022. It also highlights year on year growth along with key insights. Presenting this PowerPoint presentation, titled Digital Products Company Outline Company Historic Revenue Graphics PDF, with topics curated by our researchers after extensive research. This editable presentation is available for immediate download and provides attractive features when used. Download now and captivate your audience. Presenting this Digital Products Company Outline Company Historic Revenue Graphics PDF. Our researchers have carefully researched and created these slides with all aspects taken into consideration. This is a completely customizable Digital Products Company Outline Company Historic Revenue Graphics PDF that is available for immediate downloading. Download now and make an impact on your audience. Highlight the attractive features available with our PPTs.
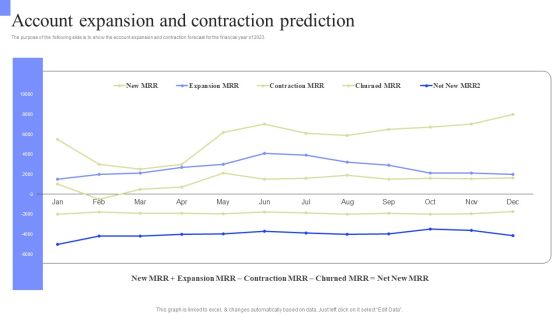
Periodic Revenue Model Account Expansion And Contraction Prediction Summary PDF
The purpose of the following slide is to show the account expansion and contraction forecast for the financial year of 2023. Presenting this PowerPoint presentation, titled Periodic Revenue Model Account Expansion And Contraction Prediction Summary PDF, with topics curated by our researchers after extensive research. This editable presentation is available for immediate download and provides attractive features when used. Download now and captivate your audience. Presenting this Periodic Revenue Model Account Expansion And Contraction Prediction Summary PDF. Our researchers have carefully researched and created these slides with all aspects taken into consideration. This is a completely customizable Periodic Revenue Model Account Expansion And Contraction Prediction Summary PDF that is available for immediate downloading. Download now and make an impact on your audience. Highlight the attractive features available with our PPTs.
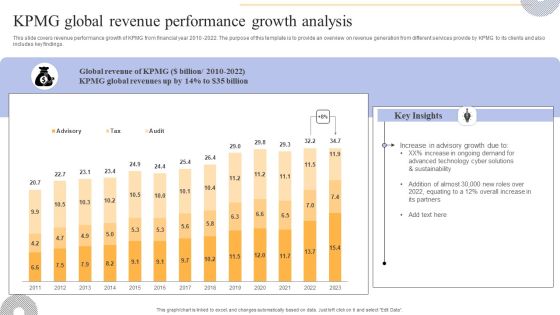
KPMG Global Revenue Performance Growth Analysis Clipart PDF
This slide covers revenue performance growth of KPMG from financial year 2010 -2022. The purpose of this template is to provide an overview on revenue generation from different services provide by KPMG to its clients and also includes key findings. Are you in need of a template that can accommodate all of your creative concepts This one is crafted professionally and can be altered to fit any style. Use it with Google Slides or PowerPoint. Include striking photographs, symbols, depictions, and other visuals. Fill, move around, or remove text boxes as desired. Test out color palettes and font mixtures. Edit and save your work, or work with colleagues. Download KPMG Global Revenue Performance Growth Analysis Clipart PDF and observe how to make your presentation outstanding. Give an impeccable presentation to your group and make your presentation unforgettable.

Information Analytics Company Outline Revenue By Customer Fy2023 Topics PDF
This slide highlights the revenue by customer which includes financial service, direct to consumer, health, retail, automotive, insurance, government, and public sector, media and technology. Slidegeeks is here to make your presentations a breeze with Information Analytics Company Outline Revenue By Customer Fy2023 Topics PDF With our easy to use and customizable templates, you can focus on delivering your ideas rather than worrying about formatting. With a variety of designs to choose from, you are sure to find one that suits your needs. And with animations and unique photos, illustrations, and fonts, you can make your presentation pop. So whether you are giving a sales pitch or presenting to the board, make sure to check out Slidegeeks first.
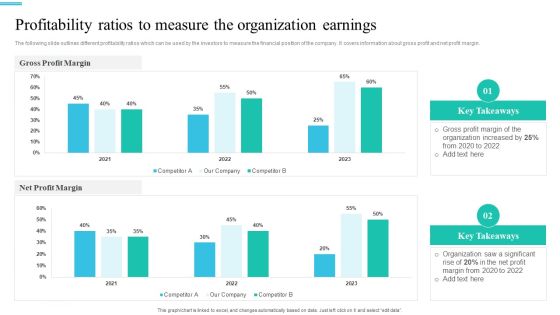
Monetary Planning And Evaluation Guide Profitability Ratios To Measure The Organization Earnings Ppt Ideas Skills PDF
The following slide outlines different profitability ratios which can be used by the investors to measure the financial position of the company. It covers information about gross profit and net profit margin. Retrieve professionally designed Monetary Planning And Evaluation Guide Profitability Ratios To Measure The Organization Earnings Ppt Ideas Skills PDF to effectively convey your message and captivate your listeners. Save time by selecting pre-made slideshows that are appropriate for various topics, from business to educational purposes. These themes come in many different styles, from creative to corporate, and all of them are easily adjustable and can be edited quickly. Access them as PowerPoint templates or as Google Slides themes. You do not have to go on a hunt for the perfect presentation because Slidegeeks got you covered from everywhere.

Estimating Business Overall Kpi Metrics Dashboard Highlighting Organization Revenue Clipart PDF
The following slide outlines key performance indicator KPI dashboard showcasing various financial metrics of the organization. The key metrics are gross revenue, product revenue, service revenue, gross profit, net profit etc. Formulating a presentation can take up a lot of effort and time, so the content and message should always be the primary focus. The visuals of the PowerPoint can enhance the presenters message, so our Estimating Business Overall Kpi Metrics Dashboard Highlighting Organization Revenue Clipart PDF was created to help save time. Instead of worrying about the design, the presenter can concentrate on the message while our designers work on creating the ideal templates for whatever situation is needed. Slidegeeks has experts for everything from amazing designs to valuable content, we have put everything into Estimating Business Overall Kpi Metrics Dashboard Highlighting Organization Revenue Clipart PDF.
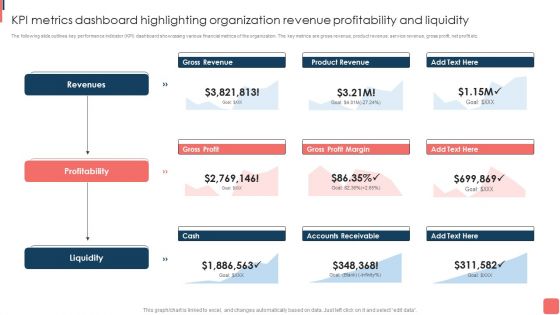
KPI Metrics Dashboard Highlighting Organization Revenue Profitability And Liquidity Template PDF
The following slide outlines key performance indicator KPI dashboard showcasing various financial metrics of the organization. The key metrics are gross revenue, product revenue, service revenue, gross profit, net profit etc. This KPI Metrics Dashboard Highlighting Organization Revenue Profitability And Liquidity Template PDF from Slidegeeks makes it easy to present information on your topic with precision. It provides customization options, so you can make changes to the colors, design, graphics, or any other component to create a unique layout. It is also available for immediate download, so you can begin using it right away. Slidegeeks has done good research to ensure that you have everything you need to make your presentation stand out. Make a name out there for a brilliant performance.
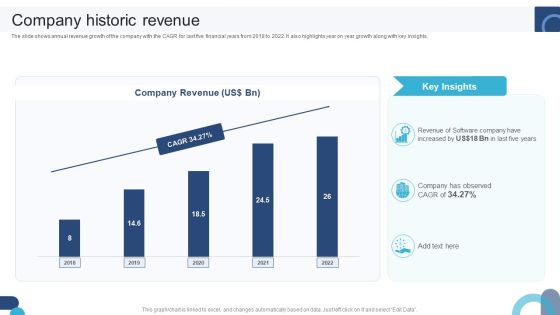
Digital Application Software Development Business Profile Company Historic Revenue Download PDF
The slide shows annual revenue growth of the company with the CAGR for last five financial years from 2018 to 2022. It also highlights year on year growth along with key insights. Do you have to make sure that everyone on your team knows about any specific topic I yes, then you should give Digital Application Software Development Business Profile Company Historic Revenue Download PDF a try. Our experts have put a lot of knowledge and effort into creating this impeccable Digital Application Software Development Business Profile Company Historic Revenue Download PDF. You can use this template for your upcoming presentations, as the slides are perfect to represent even the tiniest detail. You can download these templates from the Slidegeeks website and these are easy to edit. So grab these today.
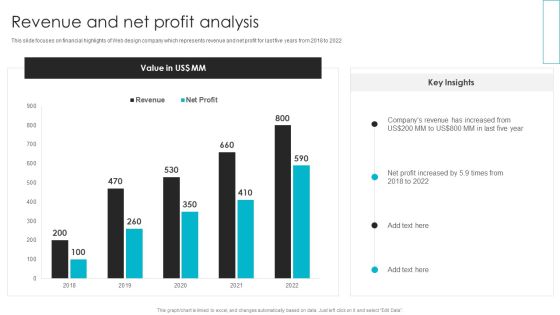
Web Design Company Overview Revenue And Net Profit Analysis Designs PDF
This slide focuses on financial highlights of Web design company which represents revenue and net profit for last five years from 2018 to 2022. Do you have to make sure that everyone on your team knows about any specific topic I yes, then you should give Web Design Company Overview Revenue And Net Profit Analysis Designs PDF a try. Our experts have put a lot of knowledge and effort into creating this impeccable Web Design Company Overview Revenue And Net Profit Analysis Designs PDF. You can use this template for your upcoming presentations, as the slides are perfect to represent even the tiniest detail. You can download these templates from the Slidegeeks website and these are easy to edit. So grab these today.
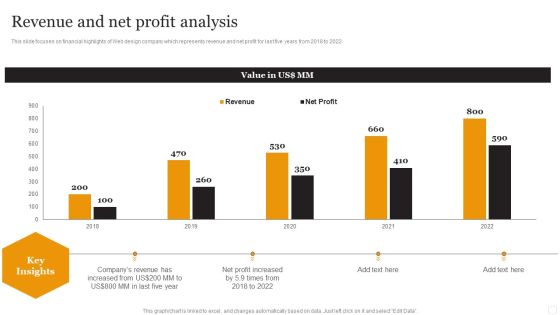
Website Designing Solutions Company Profile Revenue And Net Profit Analysis Background PDF
This slide focuses on financial highlights of Web design company which represents revenue and net profit for last five years from 2018 to 2022. Here you can discover an assortment of the finest PowerPoint and Google Slides templates. With these templates, you can create presentations for a variety of purposes while simultaneously providing your audience with an eye-catching visual experience. Download Website Designing Solutions Company Profile Revenue And Net Profit Analysis Background PDF to deliver an impeccable presentation. These templates will make your job of preparing presentations much quicker, yet still, maintain a high level of quality. Slidegeeks has experienced researchers who prepare these templates and write high-quality content for you. Later on, you can personalize the content by editing the Website Designing Solutions Company Profile Revenue And Net Profit Analysis Background PDF.
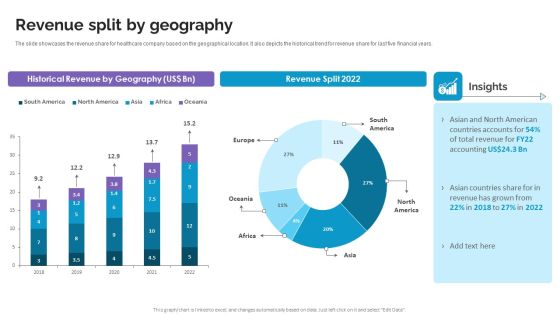
Revenue Split By Geography Life Science And Healthcare Solutions Company Profile Brochure PDF
The slide showcases the revenue share for healthcare company based on the geographical location. It also depicts the historical trend for revenue share for last five financial years. Are you in need of a template that can accommodate all of your creative concepts This one is crafted professionally and can be altered to fit any style. Use it with Google Slides or PowerPoint. Include striking photographs, symbols, depictions, and other visuals. Fill, move around, or remove text boxes as desired. Test out color palettes and font mixtures. Edit and save your work, or work with colleagues. Download Revenue Split By Geography Life Science And Healthcare Solutions Company Profile Brochure PDF and observe how to make your presentation outstanding. Give an impeccable presentation to your group and make your presentation unforgettable.

Streaming Platform Company Outline Annual Revenue And Net Income Slides PDF
This slide focuses on financial highlights of Netflix which represents revenue and net income for last five years from 2018 to 2022. Here you can discover an assortment of the finest PowerPoint and Google Slides templates. With these templates, you can create presentations for a variety of purposes while simultaneously providing your audience with an eye catching visual experience. Download Streaming Platform Company Outline Annual Revenue And Net Income Slides PDF to deliver an impeccable presentation. These templates will make your job of preparing presentations much quicker, yet still, maintain a high level of quality. Slidegeeks has experienced researchers who prepare these templates and write high quality content for you. Later on, you can personalize the content by editing the Streaming Platform Company Outline Annual Revenue And Net Income Slides PDF.

Profit And Loss Account Statement Summary Of Revenue Cost And Expenses Portrait PDF
The slides provide a glimpse of the projected profit and loss statement to visualize the platforms financial performance for the next five years. The key components are total revenue from operations, gross profit, EBITDA, etc. Do you have to make sure that everyone on your team knows about any specific topic I yes, then you should give Profit And Loss Account Statement Summary Of Revenue Cost And Expenses Portrait PDF a try. Our experts have put a lot of knowledge and effort into creating this impeccable Profit And Loss Account Statement Summary Of Revenue Cost And Expenses Portrait PDF. You can use this template for your upcoming presentations, as the slides are perfect to represent even the tiniest detail. You can download these templates from the Slidegeeks website and these are easy to edit. So grab these today.

Customer Credit Reporting Company Outline Revenue By Customer FY2022 Elements PDF
This slide highlights the revenue by customer which includes financial service, direct to consumer, health, retail, automotive, insurance, government, and public sector, media and technology. Explore a selection of the finest Customer Credit Reporting Company Outline Revenue By Customer FY2022 Elements PDF here. With a plethora of professionally designed and pre made slide templates, you can quickly and easily find the right one for your upcoming presentation. You can use our Customer Credit Reporting Company Outline Revenue By Customer FY2022 Elements PDF to effectively convey your message to a wider audience. Slidegeeks has done a lot of research before preparing these presentation templates. The content can be personalized and the slides are highly editable. Grab templates today from Slidegeeks.
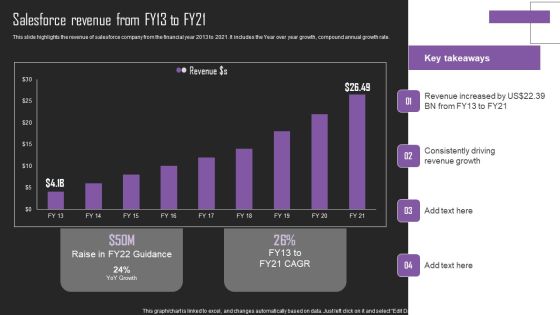
Web Hosting Software Company Outline Salesforce Revenue From FY13 To FY21 Rules PDF
This slide highlights the revenue of salesforce company from the financial year 2013 to 2021. It includes the Year over year growth, compound annual growth rate. Retrieve professionally designed Web Hosting Software Company Outline Salesforce Revenue From FY13 To FY21 Rules PDF to effectively convey your message and captivate your listeners. Save time by selecting pre made slideshows that are appropriate for various topics, from business to educational purposes. These themes come in many different styles, from creative to corporate, and all of them are easily adjustable and can be edited quickly. Access them as PowerPoint templates or as Google Slides themes. You do not have to go on a hunt for the perfect presentation because Slidegeeks got you covered from everywhere.

Agriculture Marketing Strategy To Improve Revenue Performance Farm Management Dashboard Depicting Production Themes PDF
This slide showcases the dashboard depicting data related to the production of fruits. The dashboard includes area, last production, air temperature, water content, pH value and financial statistics. Coming up with a presentation necessitates that the majority of the effort goes into the content and the message you intend to convey. The visuals of a PowerPoint presentation can only be effective if it supplements and supports the story that is being told. Keeping this in mind our experts created Agriculture Marketing Strategy To Improve Revenue Performance Farm Management Dashboard Depicting Production Themes PDF to reduce the time that goes into designing the presentation. This way, you can concentrate on the message while our designers take care of providing you with the right template for the situation.

Criterion For Choosing Distribution Channel For Efficient Sales Administration Impact Analysis Elements PDF
This slide covers financial impact of new distribution strategies on revenue, gross profit margins, net profit margins and distribution and logistics cost. Company revenues has increased, profit margins have improved and distribution cost has decreased. This slide showcases the expected growth of company from new distribution channels. The growth is highlighted in terms of revenue numbers, net profit, customer base, products sold etc. Make sure to capture your audiences attention in your business displays with our gratis customizable Criterion For Choosing Distribution Channel For Efficient Sales Administration Impact Analysis Elements PDF. These are great for business strategies, office conferences, capital raising or task suggestions. If you desire to acquire more customers for your tech business and ensure they stay satisfied, create your own sales presentation with these plain slides.
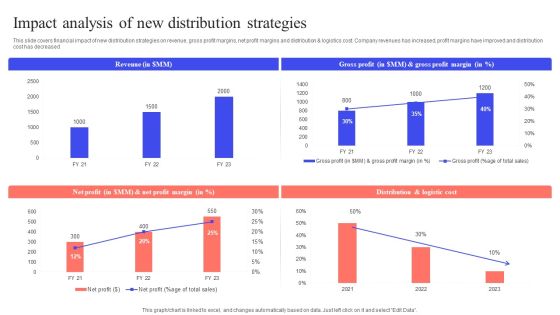
Implementing Effective Distribution Impact Analysis Of New Distribution Strategies Information PDF
This slide covers financial impact of new distribution strategies on revenue, gross profit margins, net profit margins and distribution AND logistics cost. Company revenues has increased, profit margins have improved and distribution cost has decreased. Do you know about Slidesgeeks Implementing Effective Distribution Impact Analysis Of New Distribution Strategies Information PDF These are perfect for delivering any kind od presentation. Using it, create PowerPoint presentations that communicate your ideas and engage audiences. Save time and effort by using our pre-designed presentation templates that are perfect for a wide range of topic. Our vast selection of designs covers a range of styles, from creative to business, and are all highly customizable and easy to edit. Download as a PowerPoint template or use them as Google Slides themes.
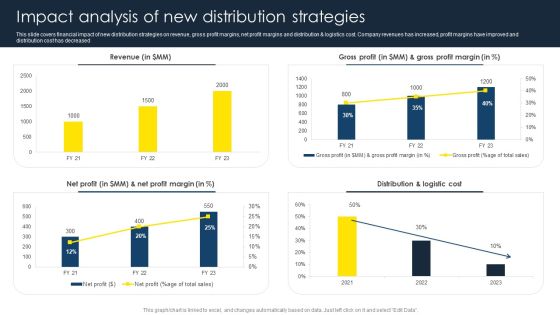
Optimize Business Sales Impact Analysis Of New Distribution Strategies Background PDF
This slide covers financial impact of new distribution strategies on revenue, gross profit margins, net profit margins and distribution AND logistics cost. Company revenues has increased, profit margins have improved and distribution cost has decreased. Do you have to make sure that everyone on your team knows about any specific topic I yes, then you should give Optimize Business Sales Impact Analysis Of New Distribution Strategies Background PDF a try. Our experts have put a lot of knowledge and effort into creating this impeccable Optimize Business Sales Impact Analysis Of New Distribution Strategies Background PDF. You can use this template for your upcoming presentations, as the slides are perfect to represent even the tiniest detail. You can download these templates from the Slidegeeks website and these are easy to edit. So grab these today.

Maximizing Profit Returns With Right Distribution Source Impact Analysis Of New Distribution Strategies Structure PDF
This slide covers financial impact of new distribution strategies on revenue, gross profit margins, net profit margins and distribution and logistics cost. Company revenues has increased, profit margins have improved and distribution cost has decreased. This modern and well-arranged Maximizing Profit Returns With Right Distribution Source Impact Analysis Of New Distribution Strategies Structure PDF provides lots of creative possibilities. It is very simple to customize and edit with the Powerpoint Software. Just drag and drop your pictures into the shapes. All facets of this template can be edited with Powerpoint no extra software is necessary. Add your own material, put your images in the places assigned for them, adjust the colors, and then you can show your slides to the world, with an animated slide included.

Omnichannel Distribution System To Satisfy Customer Needs Impact Analysis Of New Distribution Strategies Ideas PDF
This slide covers financial impact of new distribution strategies on revenue, gross profit margins, net profit margins and distribution and logistics cost. Company revenues has increased, profit margins have improved and distribution cost has decreased. Coming up with a presentation necessitates that the majority of the effort goes into the content and the message you intend to convey. The visuals of a PowerPoint presentation can only be effective if it supplements and supports the story that is being told. Keeping this in mind our experts created Omnichannel Distribution System To Satisfy Customer Needs Impact Analysis Of New Distribution Strategies Ideas PDF to reduce the time that goes into designing the presentation. This way, you can concentrate on the message while our designers take care of providing you with the right template for the situation.
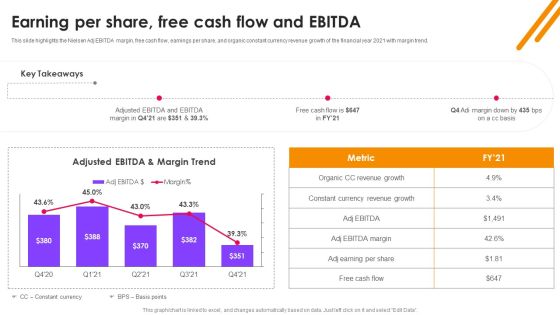
Nielsen Business Profile Earning Per Share Free Cash Flow And EBITDA Ppt PowerPoint Presentation Diagram Lists PDF
This slide highlights the Nielsen Adj EBITDA margin, free cash flow, earnings per share, and organic constant currency revenue growth of the financial year 2021 with margin trend. Here you can discover an assortment of the finest PowerPoint and Google Slides templates. With these templates, you can create presentations for a variety of purposes while simultaneously providing your audience with an eye catching visual experience. Download Nielsen Business Profile Earning Per Share Free Cash Flow And EBITDA Ppt PowerPoint Presentation Diagram Lists PDF to deliver an impeccable presentation. These templates will make your job of preparing presentations much quicker, yet still, maintain a high level of quality. Slidegeeks has experienced researchers who prepare these templates and write high quality content for you. Later on, you can personalize the content by editing the Nielsen Business Profile Earning Per Share Free Cash Flow And EBITDA Ppt PowerPoint Presentation Diagram Lists PDF.

Market Study Company Outline Earning Per Share Free Cash Flow And EBITDA Structure PDF
This slide highlights the Nielsen Adj EBITDA margin, free cash flow, earnings per share, and organic constant currency revenue growth of the financial year 2021 with margin trend. Presenting this PowerPoint presentation, titled Market Study Company Outline Earning Per Share Free Cash Flow And EBITDA Structure PDF, with topics curated by our researchers after extensive research. This editable presentation is available for immediate download and provides attractive features when used. Download now and captivate your audience. Presenting this Market Study Company Outline Earning Per Share Free Cash Flow And EBITDA Structure PDF. Our researchers have carefully researched and created these slides with all aspects taken into consideration. This is a completely customizable Market Study Company Outline Earning Per Share Free Cash Flow And EBITDA Structure PDF that is available for immediate downloading. Download now and make an impact on your audience. Highlight the attractive features available with our PPTs.

Billing Software Dashboard To Track Company Performance Ppt PowerPoint Presentation File Professional PDF
Following slide shows billing software dashboard to track company financial performance. It includes elements such as average revenue, activity record of payments, invoice summary, income and expenditures. Slidegeeks is here to make your presentations a breeze with Billing Software Dashboard To Track Company Performance Ppt PowerPoint Presentation File Professional PDF With our easy to use and customizable templates, you can focus on delivering your ideas rather than worrying about formatting. With a variety of designs to choose from, you are sure to find one that suits your needs. And with animations and unique photos, illustrations, and fonts, you can make your presentation pop. So whether you are giving a sales pitch or presenting to the board, make sure to check out Slidegeeks first.

Actual Time Transaction Monitoring Software And Strategies Global Statistics Highlighting Frauds Clipart PDF
This slide showcases global scenario of financial crimes and frauds. It provides information about fraud, bribery, politically exposed persons PEPs, money laundering, turnover lost, total losses, etc. If you are looking for a format to display your unique thoughts, then the professionally designed Actual Time Transaction Monitoring Software And Strategies Global Statistics Highlighting Frauds Clipart PDF is the one for you. You can use it as a Google Slides template or a PowerPoint template. Incorporate impressive visuals, symbols, images, and other charts. Modify or reorganize the text boxes as you desire. Experiment with shade schemes and font pairings. Alter, share or cooperate with other people on your work. Download Actual Time Transaction Monitoring Software And Strategies Global Statistics Highlighting Frauds Clipart PDF and find out how to give a successful presentation. Present a perfect display to your team and make your presentation unforgettable.

Implementing Brand Leadership Kpi Dashboard To Track Brand Performance Themes PDF
Mentioned slide showcases KPI dashboard that can be used to check the financial performance of a brand. Metrics covered in the dashboard are return on assets, working capital ratio, return on equity etc. This Implementing Brand Leadership Kpi Dashboard To Track Brand Performance Themes PDF is perfect for any presentation, be it in front of clients or colleagues. It is a versatile and stylish solution for organizing your meetings. The Implementing Brand Leadership Kpi Dashboard To Track Brand Performance Themes PDF features a modern design for your presentation meetings. The adjustable and customizable slides provide unlimited possibilities for acing up your presentation. Slidegeeks has done all the homework before launching the product for you. So, dont wait, grab the presentation templates today.

Brand Management Strategy To Increase Awareness KPI Dashboard To Track Brand Performance Slides PDF
Mentioned slide showcases KPI dashboard that can be used to check the financial performance of a brand. Metrics covered in the dashboard are return on assets, working capital ratio, return on equity etc. This Brand Management Strategy To Increase Awareness KPI Dashboard To Track Brand Performance Slides PDF is perfect for any presentation, be it in front of clients or colleagues. It is a versatile and stylish solution for organizing your meetings. The Brand Management Strategy To Increase Awareness KPI Dashboard To Track Brand Performance Slides PDF features a modern design for your presentation meetings. The adjustable and customizable slides provide unlimited possibilities for acing up your presentation. Slidegeeks has done all the homework before launching the product for you. So, dont wait, grab the presentation templates today

Building Brand Leadership Strategy To Dominate The Market KPI Dashboard To Track Brand Performance Formats PDF
Mentioned slide showcases KPI dashboard that can be used to check the financial performance of a brand. Metrics covered in the dashboard are return on assets, working capital ratio, return on equity etc.This Building Brand Leadership Strategy To Dominate The Market KPI Dashboard To Track Brand Performance Formats PDF is perfect for any presentation, be it in front of clients or colleagues. It is a versatile and stylish solution for organizing your meetings. The Building Brand Leadership Strategy To Dominate The Market KPI Dashboard To Track Brand Performance Formats PDF features a modern design for your presentation meetings. The adjustable and customizable slides provide unlimited possibilities for acing up your presentation. Slidegeeks has done all the homework before launching the product for you. So, dont wait, grab the presentation templates today
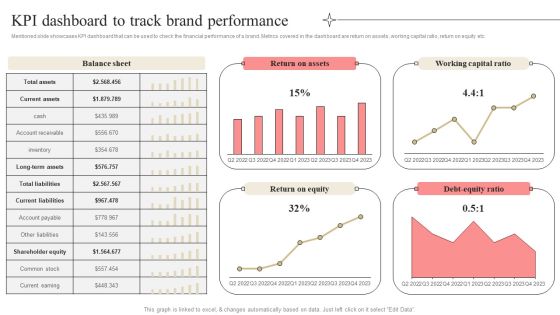
Developing Market Leading Businesses KPI Dashboard To Track Brand Performance Summary PDF
Mentioned slide showcases KPI dashboard that can be used to check the financial performance of a brand. Metrics covered in the dashboard are return on assets, working capital ratio, return on equity etc. Coming up with a presentation necessitates that the majority of the effort goes into the content and the message you intend to convey. The visuals of a PowerPoint presentation can only be effective if it supplements and supports the story that is being told. Keeping this in mind our experts created Developing Market Leading Businesses KPI Dashboard To Track Brand Performance Summary PDF to reduce the time that goes into designing the presentation. This way, you can concentrate on the message while our designers take care of providing you with the right template for the situation.

KPI Dashboard To Track Brand Performance Information PDF
Mentioned slide showcases KPI dashboard that can be used to check the financial performance of a brand. Metrics covered in the dashboard are return on assets, working capital ratio, return on equity etc. Do you know about Slidesgeeks KPI Dashboard To Track Brand Performance Information PDF These are perfect for delivering any kind od presentation. Using it, create PowerPoint presentations that communicate your ideas and engage audiences. Save time and effort by using our pre designed presentation templates that are perfect for a wide range of topic. Our vast selection of designs covers a range of styles, from creative to business, and are all highly customizable and easy to edit. Download as a PowerPoint template or use them as Google Slides themes.

KPI Dashboard To Track Brand Performance Ppt Ideas Pictures PDF
Mentioned slide showcases KPI dashboard that can be used to check the financial performance of a brand. Metrics covered in the dashboard are return on assets, working capital ratio, return on equity etc. Formulating a presentation can take up a lot of effort and time, so the content and message should always be the primary focus. The visuals of the PowerPoint can enhance the presenters message, so our KPI Dashboard To Track Brand Performance Ppt Ideas Pictures PDF was created to help save time. Instead of worrying about the design, the presenter can concentrate on the message while our designers work on creating the ideal templates for whatever situation is needed. Slidegeeks has experts for everything from amazing designs to valuable content, we have put everything into KPI Dashboard To Track Brand Performance Ppt Ideas Pictures PDF.
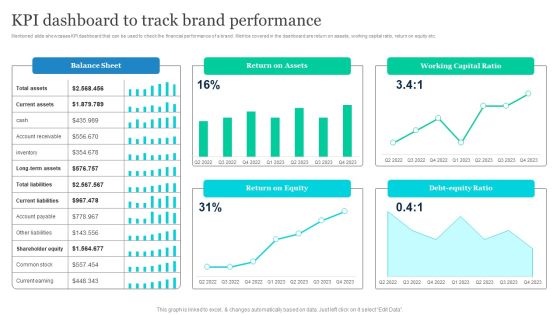
Effective Product Positioning Approach Kpi Dashboard To Track Brand Performance Infographics PDF
Mentioned slide showcases KPI dashboard that can be used to check the financial performance of a brand. Metrics covered in the dashboard are return on assets, working capital ratio, return on equity etc. Slidegeeks is one of the best resources for PowerPoint templates. You can download easily and regulate Effective Product Positioning Approach Kpi Dashboard To Track Brand Performance Infographics PDF for your personal presentations from our wonderful collection. A few clicks is all it takes to discover and get the most relevant and appropriate templates. Use our Templates to add a unique zing and appeal to your presentation and meetings. All the slides are easy to edit and you can use them even for advertisement purposes.

Agriculture Business Elevator Pitch Deck Details About Emerging Farming Firm Information PDF
This slide caters details about emerging agriculture firm including information about its vision and mission along with its competitive advantage and financial highlights. Formulating a presentation can take up a lot of effort and time, so the content and message should always be the primary focus. The visuals of the PowerPoint can enhance the presenters message, so our Agriculture Business Elevator Pitch Deck Details About Emerging Farming Firm Information PDF was created to help save time. Instead of worrying about the design, the presenter can concentrate on the message while our designers work on creating the ideal templates for whatever situation is needed. Slidegeeks has experts for everything from amazing designs to valuable content, we have put everything into Agriculture Business Elevator Pitch Deck Details About Emerging Farming Firm Information PDF.

Equity Debt And Convertible Bond Investment Banking Pitch Book Financing Requirements By The Company Infographics PDF
The slide provides the financial requirements of the company which shows the minimum cash, projected cash balance from different years, etc. Here you can discover an assortment of the finest PowerPoint and Google Slides templates. With these templates, you can create presentations for a variety of purposes while simultaneously providing your audience with an eye catching visual experience. Download Equity Debt And Convertible Bond Investment Banking Pitch Book Financing Requirements By The Company Infographics PDF to deliver an impeccable presentation. These templates will make your job of preparing presentations much quicker, yet still, maintain a high level of quality. Slidegeeks has experienced researchers who prepare these templates and write high quality content for you. Later on, you can personalize the content by editing the Equity Debt And Convertible Bond Investment Banking Pitch Book Financing Requirements By The Company Infographics PDF.

Ecommerce KPI Dashboard With Pand L Statement Download PDF
This slide showcases ecommerce key performance indicators KPI dashboard with financial statement. It provides information about total sales, orders, net profit, net profit margin, average order value, channels, etc. This Ecommerce KPI Dashboard With Pand L Statement Download PDF from Slidegeeks makes it easy to present information on your topic with precision. It provides customization options, so you can make changes to the colors, design, graphics, or any other component to create a unique layout. It is also available for immediate download, so you can begin using it right away. Slidegeeks has done good research to ensure that you have everything you need to make your presentation stand out. Make a name out there for a brilliant performance.

Digital Application Software Development Business Profile Shareholding Pattern Mockup PDF
The slide highlights the company ownership structure and FII holdings for financial year 2022. It showcases shareholding of promoters, public, mutual funds, foreign institutional investors and other institutions. Presenting this PowerPoint presentation, titled Digital Application Software Development Business Profile Shareholding Pattern Mockup PDF, with topics curated by our researchers after extensive research. This editable presentation is available for immediate download and provides attractive features when used. Download now and captivate your audience. Presenting this Digital Application Software Development Business Profile Shareholding Pattern Mockup PDF. Our researchers have carefully researched and created these slides with all aspects taken into consideration. This is a completely customizable Digital Application Software Development Business Profile Shareholding Pattern Mockup PDF that is available for immediate downloading. Download now and make an impact on your audience. Highlight the attractive features available with our PPTs.
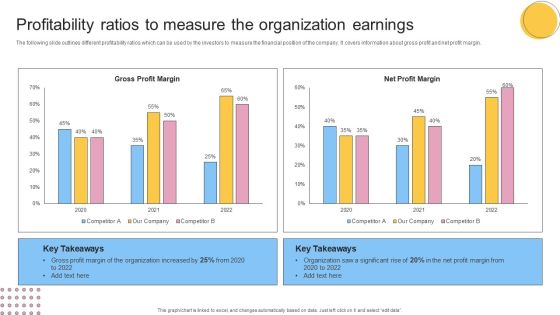
Profitability Ratios To Measure The Organization Earnings Ideas PDF
The following slide outlines different profitability ratios which can be used by the investors to measure the financial position of the company. It covers information about gross profit and net profit margin. Do you have an important presentation coming up Are you looking for something that will make your presentation stand out from the rest Look no further than Profitability Ratios To Measure The Organization Earnings Ideas PDF. With our professional designs, you can trust that your presentation will pop and make delivering it a smooth process. And with Slidegeeks, you can trust that your presentation will be unique and memorable. So why wait Grab Profitability Ratios To Measure The Organization Earnings Ideas PDF today and make your presentation stand out from the rest.

Data Quality Dashboard For Linked Data Integrating Linked Data To Enhance Operational Template PDF
This slide describes the data quality dashboard for linked data by covering details of account information quality, contact details quality, financial data quality, and missing account information.This Data Quality Dashboard For Linked Data Integrating Linked Data To Enhance Operational Template PDF from Slidegeeks makes it easy to present information on your topic with precision. It provides customization options, so you can make changes to the colors, design, graphics, or any other component to create a unique layout. It is also available for immediate download, so you can begin using it right away. Slidegeeks has done good research to ensure that you have everything you need to make your presentation stand out. Make a name out there for a brilliant performance.

Executing Risk Mitigation KPI Dashboard To Track Effectiveness Of Real Estate Rules PDF
The following slide exhibits key performance indicator KPI dashboard which can be used to measure the financial performance of the real estate company. It covers various KPIs such as sales vs target per agent, top 10 projects, top 5 agencies etc. Find highly impressive Executing Risk Mitigation KPI Dashboard To Track Effectiveness Of Real Estate Rules PDF on Slidegeeks to deliver a meaningful presentation. You can save an ample amount of time using these presentation templates. No need to worry to prepare everything from scratch because Slidegeeks experts have already done a huge research and work for you. You need to download Executing Risk Mitigation Kpi Dashboard To Track Effectiveness Of Real Estate Rules PDF for your upcoming presentation. All the presentation templates are 100 percent editable and you can change the color and personalize the content accordingly. Download now.

Company Details Of The Cafe Business Start Up Summary Of The Coffee Shop Portrait PDF
The purpose of this slide is to portray the structure of the business, target market, marketing strategy, funding requirements, financial projections, and licensing requirements, among others. It serves as a roadmap for the business. Do you have to make sure that everyone on your team knows about any specific topic I yes, then you should give Company Details Of The Cafe Business Start Up Summary Of The Coffee Shop Portrait PDF a try. Our experts have put a lot of knowledge and effort into creating this impeccable Company Details Of The Cafe Business Start Up Summary Of The Coffee Shop Portrait PDF. You can use this template for your upcoming presentations, as the slides are perfect to represent even the tiniest detail. You can download these templates from the Slidegeeks website and these are easy to edit. So grab these today.
 Home
Home