AI PPT Maker
Templates
PPT Bundles
Design Services
Business PPTs
Business Plan
Management
Strategy
Introduction PPT
Roadmap
Self Introduction
Timelines
Process
Marketing
Agenda
Technology
Medical
Startup Business Plan
Cyber Security
Dashboards
SWOT
Proposals
Education
Pitch Deck
Digital Marketing
KPIs
Project Management
Product Management
Artificial Intelligence
Target Market
Communication
Supply Chain
Google Slides
Research Services
 One Pagers
All Categories
-
Home
- Customer Favorites
- Financial Dashboard
Financial Dashboard
Enhancing Financial Institution Operations Dashboard Tracking Customer Retention Rate Partner Introduction PDF
Deliver an awe inspiring pitch with this creative enhancing financial institution operations dashboard tracking customer retention rate partner introduction pdf bundle. Topics like dashboard tracking customer retention rate can be discussed with this completely editable template. It is available for immediate download depending on the needs and requirements of the user.
Enhancing Financial Institution Operations Dashboard Tracking Customer Retention Rate Ideas PDF
Deliver and pitch your topic in the best possible manner with this enhancing financial institution operations dashboard tracking customer retention rate ideas pdf. Use them to share invaluable insights on dashboard tracking customer retention rate and impress your audience. This template can be altered and modified as per your expectations. So, grab it now.
Enhancing Financial Institution Operations Dashboard Tracking Customer Satisfaction Score Icons PDF
Deliver an awe inspiring pitch with this creative enhancing financial institution operations dashboard tracking customer satisfaction score icons pdf bundle. Topics like dashboard tracking customer satisfaction score can be discussed with this completely editable template. It is available for immediate download depending on the needs and requirements of the user.
Enhancing Financial Institution Operations Dashboard Tracking Total Loans And Deposits Graphics PDF
Deliver an awe inspiring pitch with this creative enhancing financial institution operations dashboard tracking total loans and deposits graphics pdf bundle. Topics like dashboard tracking total loans and deposits can be discussed with this completely editable template. It is available for immediate download depending on the needs and requirements of the user.
Enhancing Financial Institution Operations Dashboard Tracking Customer Activities And Revenue Generated Microsoft PDF
Deliver and pitch your topic in the best possible manner with this enhancing financial institution operations dashboard tracking customer activities and revenue generated microsoft pdf. Use them to share invaluable insights on target, revenue, value, achievement and impress your audience. This template can be altered and modified as per your expectations. So, grab it now.

Annual Financial Performance Administration Dashboard With Key Metrics Ppt PowerPoint Presentation Icon Visual Aids PDF
Showcasing this set of slides titled Annual Financial Performance Administration Dashboard With Key Metrics Ppt PowerPoint Presentation Icon Visual Aids PDF. The topics addressed in these templates are Accounts Receivable, Accounts Payable, Planned Profit Margin. All the content presented in this PPT design is completely editable. Download it and make adjustments in color, background, font etc. as per your unique business setting.
Enhancing Financial Institution Operations Dashboard Tracking Online Banking Activities Rules PDF
Deliver and pitch your topic in the best possible manner with this enhancing financial institution operations dashboard tracking online banking activities rules pdf. Use them to share invaluable insights on management, service, access and impress your audience. This template can be altered and modified as per your expectations. So, grab it now.
Strategic Corporate Planning To Attain Corporate Financial Performance Tracking Dashboard Icons PDF
This slide provides information regarding dashboard utilized by firm to monitor financial performance. The performance is tracked through revenues generated, vendors associated, profit generated, etc. This Strategic Corporate Planning To Attain Corporate Financial Performance Tracking Dashboard Icons PDF is perfect for any presentation, be it in front of clients or colleagues. It is a versatile and stylish solution for organizing your meetings. The Strategic Corporate Planning To Attain Corporate Financial Performance Tracking Dashboard Icons PDF features a modern design for your presentation meetings. The adjustable and customizable slides provide unlimited possibilities for acing up your presentation. Slidegeeks has done all the homework before launching the product for you. So, do not wait, grab the presentation templates today
Risk Management For Organization Essential Assets Financial Performance Tracking Dashboard Designs PDF
This slide presents the dashboard which will help firm in tracking the fiscal performance. This dashboard displays revenues and expenses trends and payment received analysis. Deliver an awe inspiring pitch with this creative risk management for organization essential assets financial performance tracking dashboard designs pdf bundle. Topics like receivables analysis, revenue and expense trends can be discussed with this completely editable template. It is available for immediate download depending on the needs and requirements of the user.

Corporate Security And Risk Management Financial Performance Tracking Dashboard Introduction PDF
This slide presents the dashboard which will help firm in tracking the fiscal performance. This dashboard displays revenues and expenses trends and payment received analysis. Deliver an awe inspiring pitch with this creative corporate security and risk management financial performance tracking dashboard introduction pdf bundle. Topics like revenue and expense trends, receivables analysis can be discussed with this completely editable template. It is available for immediate download depending on the needs and requirements of the user.

Corporate Financial Performance Tracking Dashboard Ppt PowerPoint Presentation File Pictures PDF
This slide provides information regarding dashboard utilized by firm to monitor financial performance. The performance is tracked through revenues generated, vendors associated, profit generated, etc. Find a pre designed and impeccable Corporate Financial Performance Tracking Dashboard Ppt PowerPoint Presentation File Pictures PDF. The templates can ace your presentation without additional effort. You can download these easy to edit presentation templates to make your presentation stand out from others. So, what are you waiting for Download the template from Slidegeeks today and give a unique touch to your presentation.

Company Financial Performance Indicators Dashboard With Working Capital And Cash Conversion Icons PDF
This slide shows dashboard of finance KPIs . It covers working capital, cash conversion cycle, vendor payment error rate ,current assets and liabilities. Showcasing this set of slides titled Company Financial Performance Indicators Dashboard With Working Capital And Cash Conversion Icons PDF. The topics addressed in these templates are Current Working Capital, Current Liabilities, Working Capital. All the content presented in this PPT design is completely editable. Download it and make adjustments in color, background, font etc. as per your unique business setting.

Financial Feasibility Analysis Dashboard Depicting Income And Unemployment Analysis Download PDF
This slide illustrates economic feasibility dashboard depicting income and unemployment analysis. It contains information about household income, unemployment rate, poverty, status, etc. Pitch your topic with ease and precision using this Financial Feasibility Analysis Dashboard Depicting Income And Unemployment Analysis Download PDF. This layout presents information on Median Household Income, Unemployment Rate, Percent Living Poverty. It is also available for immediate download and adjustment. So, changes can be made in the color, design, graphics or any other component to create a unique layout.

Company Financial Performance Indicators Dashboard With Liquidity And Turnover Ratios Formats PDF
This graph or chart is linked to excel, and changes automatically based on data. Just left click on it and select Edit Data. Pitch your topic with ease and precision using this Company Financial Performance Indicators Dashboard With Liquidity And Turnover Ratios Formats PDF. This layout presents information on Cash Balance, Days Inventory Outstanding, Days Payable Outstanding. It is also available for immediate download and adjustment. So, changes can be made in the color, design, graphics or any other component to create a unique layout.
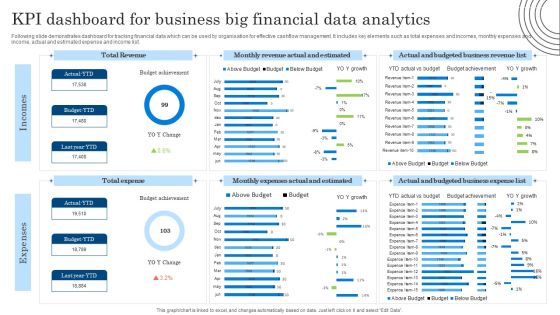
KPI Dashboard For Business Big Financial Data Analytics Diagrams PDF
Following slide demonstrates dashboard for tracking financial data which can be used by organisation for effective cashflow management. It includes key elements such as total expenses and incomes, monthly expenses and income, actual and estimated expense and income list. Showcasing this set of slides titled KPI Dashboard For Business Big Financial Data Analytics Diagrams PDF. The topics addressed in these templates are KPI Dashboard, Business Big Financial, Data Analytics. All the content presented in this PPT design is completely editable. Download it and make adjustments in color, background, font etc. as per your unique business setting.

Dashboard Depicting E-Commerce Business Financial Operations Metrics Topics PDF
This slide represents dashboard showcasing e-commerce financial process metrics illustrating eccentric purchase conversation rate, shipping revenue, average quantity etc.Showcasing this set of slides titled dashboard depicting e-commerce business financial operations metrics topics pdf The topics addressed in these templates are eccentric purchase, average product revenue, impression rate All the content presented in this PPT design is completely editable. Download it and make adjustments in color, background, font etc. as per your unique business setting.

Dashboard To Assess Ecommerce Financial Performance Across Regions Infographics PDF
This slide showcases ecommerce key performance indicators KPI dashboard with financial statement. It provides information about total sales, orders, net profit, net profit margin, average order value, channels, etc.Here you can discover an assortment of the finest PowerPoint and Google Slides templates. With these templates, you can create presentations for a variety of purposes while simultaneously providing your audience with an eye-catching visual experience. Download Dashboard To Assess Ecommerce Financial Performance Across Regions Infographics PDF to deliver an impeccable presentation. These templates will make your job of preparing presentations much quicker, yet still, maintain a high level of quality. Slidegeeks has experienced researchers who prepare these templates and write high-quality content for you. Later on, you can personalize the content by editing the Dashboard To Assess Ecommerce Financial Performance Across Regions Infographics PDF.

Dashboard To Assess Ecommerce Financial Performance Across Regions Themes PDF
This slide showcases ecommerce key performance indicators KPI dashboard with financial statement. It provides information about total sales, orders, net profit, net profit margin, average order value, channels, etc. Here you can discover an assortment of the finest PowerPoint and Google Slides templates. With these templates, you can create presentations for a variety of purposes while simultaneously providing your audience with an eye catching visual experience. Download Dashboard To Assess Ecommerce Financial Performance Across Regions Themes PDF to deliver an impeccable presentation. These templates will make your job of preparing presentations much quicker, yet still, maintain a high level of quality. Slidegeeks has experienced researchers who prepare these templates and write high quality content for you. Later on, you can personalize the content by editing the Dashboard To Assess Ecommerce Financial Performance Across Regions Themes PDF.

Dashboard To Measure Business Financial Performance Summary PDF
This slide shows the dashboard to measure business financial performance which focuses on revenues, debt to equity, net profit margin, gross profit margin and return on equity. Are you searching for a Dashboard To Measure Business Financial Performance Summary PDF that is uncluttered, straightforward, and original Its easy to edit, and you can change the colors to suit your personal or business branding. For a presentation that expresses how much effort youve put in, this template is ideal With all of its features, including tables, diagrams, statistics, and lists, its perfect for a business plan presentation. Make your ideas more appealing with these professional slides. Download Dashboard To Measure Business Financial Performance Summary PDF from Slidegeeks today.
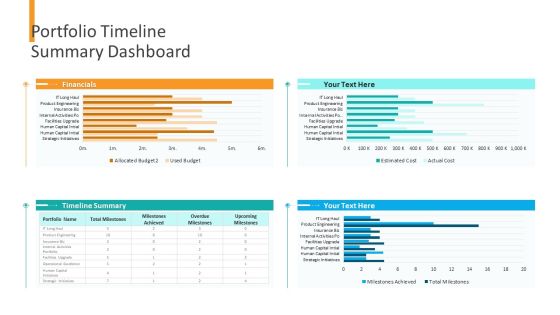
Organizational Financial Assets Assessment Portfolio Timeline Summary Dashboard Clipart PDF
Deliver and pitch your topic in the best possible manner with this organizational financial assets assessment portfolio timeline summary dashboard clipart pdf. Use them to share invaluable insights on financials, timeline summary and impress your audience. This template can be altered and modified as per your expectations. So, grab it now.
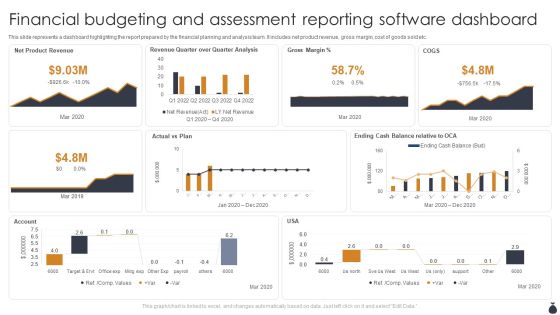
Financial Budgeting And Assessment Reporting Software Dashboard Template PDF
This slide represents a dashboard highlighting the report prepared by the financial planning and analysis team. It includes net product revenue, gross margin, cost of goods sold etc. Showcasing this set of slides titled Financial Budgeting And Assessment Reporting Software Dashboard Template PDF. The topics addressed in these templates are Net Product Revenue, Actual Vs Plan, Account. All the content presented in this PPT design is completely editable. Download it and make adjustments in color, background, font etc. as per your unique business setting.
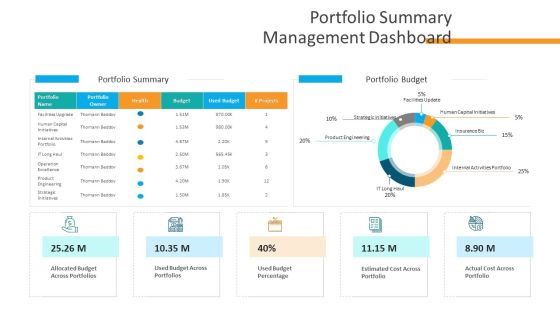
Organizational Financial Assets Assessment Portfolio Summary Management Dashboard Topics PDF
Deliver an awe-inspiring pitch with this creative organizational financial assets assessment portfolio summary management dashboard topics pdf. bundle. Topics like portfolio owner, allocated budget across portfolios, used budget across portfolios can be discussed with this completely editable template. It is available for immediate download depending on the needs and requirements of the user.

Accounting KPI Dashboard To Control System Financial Performance Formats PDF
The following slide showcases model for enabling control of accounts. It presents information related to long term planning, investment plans, profit estimated, etc. Pitch your topic with ease and precision using this Accounting KPI Dashboard To Control System Financial Performance Formats PDF. This layout presents information on Sales Outstanding, Payable Outstanding, Sales Inventory. It is also available for immediate download and adjustment. So, changes can be made in the color, design, graphics or any other component to create a unique layout.

Summary Financial Sales And Profit Margin Analysis Dashboard Pictures PDF
This graph or chart is linked to excel, and changes automatically based on data. Just left click on it and select Edit Data. Deliver an awe inspiring pitch with this creative Summary Financial Sales And Profit Margin Analysis Dashboard Pictures PDF bundle. Topics like Net Profit, Past Year Vs Target Vs Actual, Net Profit Margin By Region, Channel, Expenses Breakdown, Costs And Expenses, Profitability Indicator Ratios can be discussed with this completely editable template. It is available for immediate download depending on the needs and requirements of the user.
Executive Dashboards For Tracking Financial Health Of Enterprise Diagrams PDF
This slide represents the CEO dashboard to track the financial health of an organization. It includes key performance indicators such as revenue, expenses, activity ratio, gross profit margin, EBIT etc. Pitch your topic with ease and precision using this Executive Dashboards For Tracking Financial Health Of Enterprise Diagrams PDF. This layout presents information on Revenue, Expense, Activity Ratio. It is also available for immediate download and adjustment. So, changes can be made in the color, design, graphics or any other component to create a unique layout.
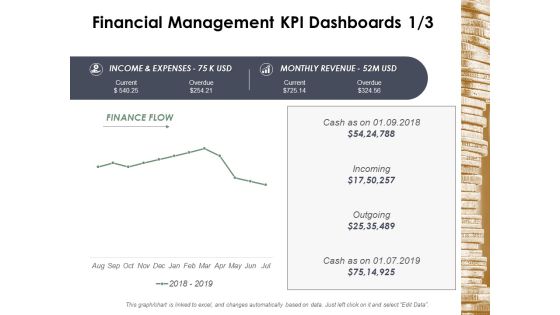
Financial Management Kpi Dashboards Business Ppt Powerpoint Presentation Infographic Template Deck
This is a financial management kpi dashboards business ppt powerpoint presentation infographic template deck. This is a four stage process. The stages in this process are finance, marketing, management, investment, analysis.
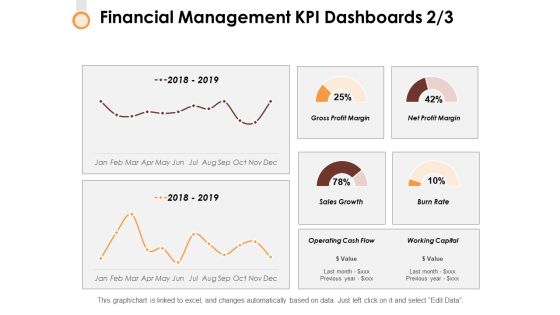
Financial Management Kpi Dashboards 2 3 Ppt PowerPoint Presentation Infographic Template Format Ideas
This is a financial management kpi dashboards 2 3 ppt powerpoint presentation infographic template format ideas. This is a two stage process. The stages in this process are finance, strategy, marketing, compare, business.

Financial Management Kpi Dashboards Strategy Ppt Powerpoint Presentation Gallery Graphics Template
This is a financial management kpi dashboards strategy ppt powerpoint presentation gallery graphics template. This is a six stage process. The stages in this process are finance, marketing, management, investment, analysis.

Financial Management Kpi Dashboards 1 3 Ppt PowerPoint Presentation Outline Background
This is a financial management kpi dashboards 1 3 ppt powerpoint presentation outline background. This is a four stage process. The stages in this process are finance, strategy, marketing, compare, business.

Financial Management Kpi Dashboards 3 3 Ppt PowerPoint Presentation Layouts Graphics Template
This is a financial management kpi dashboards 3 3 ppt powerpoint presentation layouts graphics template. This is a two stage process. The stages in this process are finance, strategy, marketing, compare, business.

Performance Dashboard For E Commerce Business Financial Operations Infographics PDF
This slide represents performance dashboard for e-commerce financial process illustrating product sales, number of brands, revenue, number of units sold etc.Pitch your topic with ease and precision using this performance dashboard for e commerce business financial operations infographics pdf This layout presents information on category by total revenue, total revenue, purchase by age breakdown It is also available for immediate download and adjustment. So, changes can be made in the color, design, graphics or any other component to create a unique layout.

Dashboard For Monitoring And Corporate Financial Statement Budgets Template PDF
This slide brings forth dashboard for monitoring and reporting the financial budgets of various branches of an enterprise emphasis on income and expenditure by each branch. The key performing indicators are actual vs budgeted revenue, revenue distribution by branches etc. Showcasing this set of slides titled Dashboard For Monitoring And Corporate Financial Statement Budgets Template PDF. The topics addressed in these templates are Revenue Distribution, Revenue Source, Revenue Expenses. All the content presented in this PPT design is completely editable. Download it and make adjustments in color, background, font etc. as per your unique business setting.

Dashboard For Cash Flow And Financial KPI Ratio Icons PDF
Showcasing this set of slides titled Dashboard For Cash Flow And Financial KPI Ratio Icons PDF. The topics addressed in these templates are Days Sales Outstanding, Days Payable Outstanding, Return On Assets. All the content presented in this PPT design is completely editable. Download it and make adjustments in color, background, font etc. as per your unique business setting.
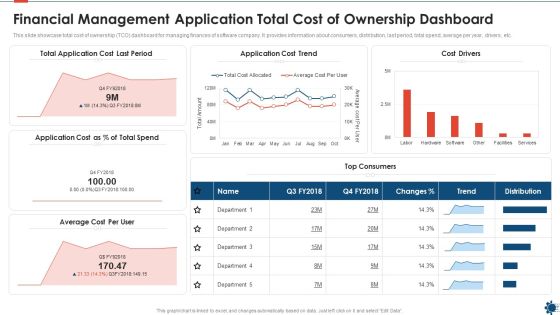
Financial Management Application Total Cost Of Ownership Dashboard Infographics PDF
This slide showcase total cost of ownership TCO dashboard for managing finances of software company. It provides information about consumers, distribution, last period, total spend, average per year, drivers, etc. Showcasing this set of slides titled financial management application total cost of ownership dashboard infographics pdf. The topics addressed in these templates are cost, application. All the content presented in this PPT design is completely editable. Download it and make adjustments in color, background, font etc. as per your unique business setting.

Budget Assessment Dashboard With Project Financials Rules PDF
The following slide shows project management financials and budget portfolio dashboard. It provides information about workflow phase, statistics, baseline work, actual cost, remaining cost, etc. Showcasing this set of slides titled Budget Assessment Dashboard With Project Financials Rules PDF. The topics addressed in these templates are Portfolio Statistics, Portfolio Summery, Projects By State. All the content presented in this PPT design is completely editable. Download it and make adjustments in color, background, font etc. as per your unique business setting.
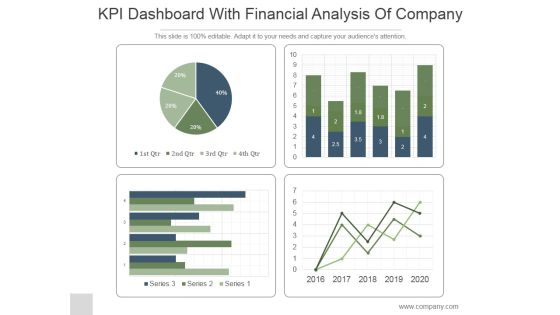
KPI Dashboard With Financial Analysis Of Company Ppt PowerPoint Presentation Backgrounds
This is a kpi dashboard with financial analysis of company ppt powerpoint presentation backgrounds. This is a four stage process. The stages in this process are business, strategy, marketing, line graph, finance.

Dashboard Showcasing Financial Metrics To Coffee Shop Business Plan Background PDF
This slide represents financial dashboard to develop coffee business plan. It covers revenue breakdown, revenue, cash flow, and cumulative cash flow for five years. Showcasing this set of slides titled dashboard showcasing financial metrics to coffee shop business plan background pdf. The topics addressed in these templates are dashboard showcasing financial metrics to coffee shop business plan. All the content presented in this PPT design is completely editable. Download it and make adjustments in color, background, font etc. as per your unique business setting.

Picture Showing Dashboard For Financial Performance Of Business Ppt PowerPoint Presentation Portfolio Master Slide PDF
Presenting picture showing dashboard for financial performance of business ppt powerpoint presentation portfolio master slide pdf to dispense important information. This template comprises two stages. It also presents valuable insights into the topics including picture showing dashboard for financial performance of business. This is a completely customizable PowerPoint theme that can be put to use immediately. So, download it and address the topic impactfully.

Dashboard For Financial Summary Vector Icon Ppt PowerPoint Presentation Infographic Template Design Inspiration PDF
Presenting this set of slides with name dashboard for financial summary vector icon ppt powerpoint presentation infographic template design inspiration pdf. This is a three stage process. The stages in this process are dashboard for financial summary vector icon. This is a completely editable PowerPoint presentation and is available for immediate download. Download now and impress your audience.

Online Financial Transaction Mobile Banking Dashboard Ppt PowerPoint Presentation Gallery Professional PDF
Persuade your audience using this online financial transaction mobile banking dashboard ppt powerpoint presentation gallery professional pdf. This PPT design covers three stages, thus making it a great tool to use. It also caters to a variety of topics including online financial transaction mobile banking dashboard. Download this PPT design now to present a convincing pitch that not only emphasizes the topic but also showcases your presentation skills.

Financial Asset Management System Dashboard Showing Debt And Equity Ratio Graphics PDF
This slide shows the dashboard of financial asset management representing total accounts receivable and payable, equity and debt ratio, profit and loss summary, net working capital etc. Showcasing this set of slides titled Financial Asset Management System Dashboard Showing Debt And Equity Ratio Graphics PDF. The topics addressed in these templates are Financial Asset, Management System, Debt And Equity Ratio. All the content presented in this PPT design is completely editable. Download it and make adjustments in color, background, font etc. as per your unique business setting.
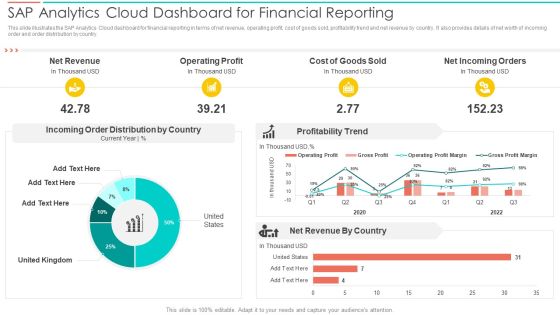
SAC Planning And Implementation SAP Analytics Cloud Dashboard For Financial Reporting Introduction PDF
This slide illustrates the SAP Analytics Cloud dashboard for financial reporting in terms of net revenue, operating profit, cost of goods sold, profitability trend and net revenue by country. It also provides details of net worth of incoming order and order distribution by country. Deliver an awe inspiring pitch with this creative SAC Planning And Implementation SAP Analytics Cloud Dashboard For Financial Reporting Introduction PDF bundle. Topics like Net Revenue, Operating Profit, Cost Goods Sold can be discussed with this completely editable template. It is available for immediate download depending on the needs and requirements of the user.
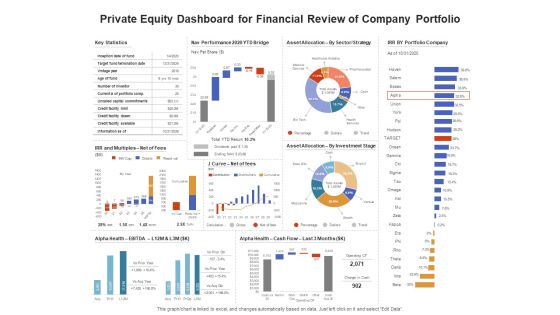
Venture Capitalist Control Board Private Equity Dashboard For Financial Review Of Company Portfolio Information PDF
Presenting this set of slides with name venture capitalist control board private equity dashboard for financial review of company portfolio information pdf. The topics discussed in these slides are contribution margin, margin analysis, income statement, dashboards controls. This is a completely editable PowerPoint presentation and is available for immediate download. Download now and impress your audience.

Outsource Bookkeeping Service Manage Financial Transactions Accounts Payable Dashboard Diagrams PDF
Presenting this set of slides with name outsource bookkeeping service manage financial transactions accounts payable dashboard diagrams pdf. The topics discussed in these slide is accounts payable dashboard. This is a completely editable PowerPoint presentation and is available for immediate download. Download now and impress your audience.
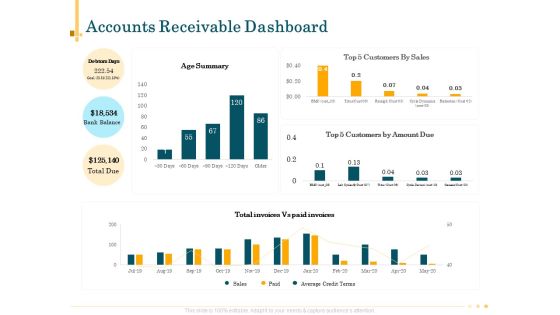
Outsource Bookkeeping Service Manage Financial Transactions Accounts Receivable Dashboard Themes PDF
Presenting this set of slides with name outsource bookkeeping service manage financial transactions accounts receivable dashboard themes pdf. The topics discussed in these slide is accounts receivable dashboard. This is a completely editable PowerPoint presentation and is available for immediate download. Download now and impress your audience.
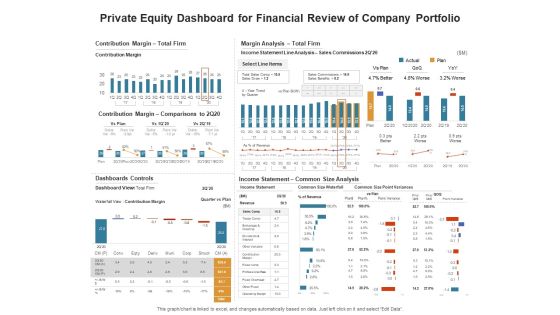
Venture Capitalist Control Board Private Equity Dashboard For Financial Review Of Company Portfolio Plan Elements PDF
Presenting this set of slides with name venture capitalist control board private equity dashboard for financial review of company portfolio plan elements pdf. The topics discussed in these slides are nav performance, key statistics, asset allocation, portfolio company. This is a completely editable PowerPoint presentation and is available for immediate download. Download now and impress your audience.
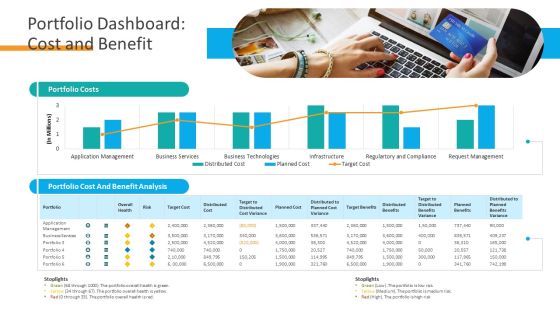
Organizational Financial Assets Assessment Portfolio Dashboard Cost And Benefit Information PDF
Deliver and pitch your topic in the best possible manner with this organizational financial assets assessment portfolio dashboard cost and benefit information pdf. Use them to share invaluable insights on portfolio costs, portfolio cost and benefit analysis and impress your audience. This template can be altered and modified as per your expectations. So, grab it now.

Conducting Monetary Inclusion With Mobile Financial Services Branch Scoreboard Dashboard Sample PDF
This slide portrays branch scoreboard dashboard covering metrics such as accounts opened and closed, deposits to goal, accounts by type, expense to budget and referrals by product. Deliver an awe inspiring pitch with this creative Conducting Monetary Inclusion With Mobile Financial Services Branch Scoreboard Dashboard Sample PDF bundle. Topics like Expense Budget, Referrals Product, Deposits To Goal can be discussed with this completely editable template. It is available for immediate download depending on the needs and requirements of the user.

BI Technique For Data Informed Decisions Sap Analytics Cloud Dashboard For Financial Reporting Portrait PDF
This slide illustrates the SAP Analytics Cloud dashboard for financial reporting in terms of net revenue, operating profit, cost of goods sold, profitability trend and net revenue by country. It also provides details of net worth of incoming order and order distribution by country. Coming up with a presentation necessitates that the majority of the effort goes into the content and the message you intend to convey. The visuals of a PowerPoint presentation can only be effective if it supplements and supports the story that is being told. Keeping this in mind our experts created BI Technique For Data Informed Decisions Sap Analytics Cloud Dashboard For Financial Reporting Portrait PDF to reduce the time that goes into designing the presentation. This way, you can concentrate on the message while our designers take care of providing you with the right template for the situation.

Financial Services Enterprise Transformation Dashboard Related To The Banking Company Information PDF
This slide shows the company financials Total Branches and Total R and D Expenses of ABC Bank. It includes the financials before the implementation of strategies for the years 2019 to 2023 with key notes.Deliver an awe inspiring pitch with this creative Financial Services Enterprise Transformation Dashboard Related To The Banking Company Information PDF bundle. Topics like Company Financials Before The Implementation Of Strategies can be discussed with this completely editable template. It is available for immediate download depending on the needs and requirements of the user.

Dashboard For Key Performance Indicator Of Financial KPI Background PDF
Pitch your topic with ease and precision using this Dashboard For Key Performance Indicator Of Financial KPI Background PDF. This layout presents information on Dashboard For Key, Performance Indicator, Financial KPI. It is also available for immediate download and adjustment. So, changes can be made in the color, design, graphics or any other component to create a unique layout.
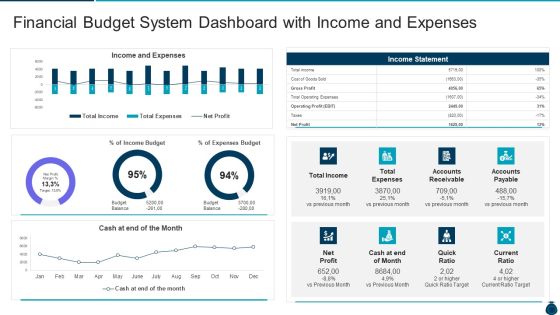
Key Elements And Techniques Of A Budgeting System Financial Budget System Dashboard With Income And Expenses Rules PDF
Deliver an awe inspiring pitch with this creative key elements and techniques of a budgeting system financial budget system dashboard with income and expenses rules pdf bundle. Topics like financial budget system dashboard with income and expenses can be discussed with this completely editable template. It is available for immediate download depending on the needs and requirements of the user.

Dashboard To Assess Ecommerce Financial Performance Across Regions Financial Management Strategies Clipart PDF
This slide showcases ecommerce key performance indicators KPI dashboard with financial statement. It provides information about total sales, orders, net profit, net profit margin, average order value, channels, etc.Present like a pro with Dashboard To Assess Ecommerce Financial Performance Across Regions Financial Management Strategies Clipart PDF Create beautiful presentations together with your team, using our easy-to-use presentation slides. Share your ideas in real-time and make changes on the fly by downloading our templates. So whether you are in the office, on the go, or in a remote location, you can stay in sync with your team and present your ideas with confidence. With Slidegeeks presentation got a whole lot easier. Grab these presentations today.

KPI Dashboard To Monitor Financial Budget Allocation And Distribution Portrait PDF
This slide signifies the key performance indicator dashboard on organisation financial budget allocation within various department. It includes budget allocation, monthly performance, top suppliers etc.Deliver an awe inspiring pitch with this creative KPI Dashboard To Monitor Financial Budget Allocation And Distribution Portrait PDF bundle. Topics like Budget Allocated, Budget Distributed, Payable Account can be discussed with this completely editable template. It is available for immediate download depending on the needs and requirements of the user.

Financial Assets Management KPI And Dashboard Ppt PowerPoint Presentation Complete Deck With Slides
Presenting this set of slides with name financial assets management kpi and dashboard ppt powerpoint presentation complete deck with slides. The topics discussed in these slides are pipeline projects, financial forecast, work forecast. This is a completely editable PowerPoint presentation and is available for immediate download. Download now and impress your audience.
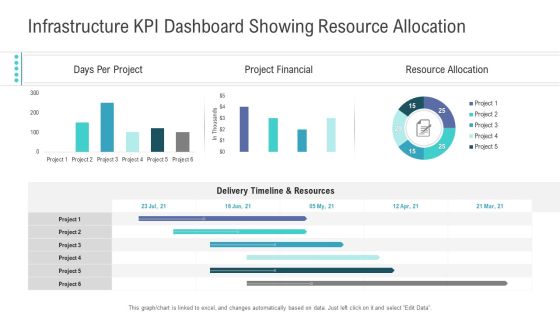
Financial Functional Assessment Infrastructure KPI Dashboard Showing Resource Allocation Ideas PDF
Deliver an awe-inspiring pitch with this creative financial functional assessment infrastructure kpi dashboard showing resource allocation ideas pdf bundle. Topics like resource allocation, project financial, delivery timeline, resources can be discussed with this completely editable template. It is available for immediate download depending on the needs and requirements of the user.
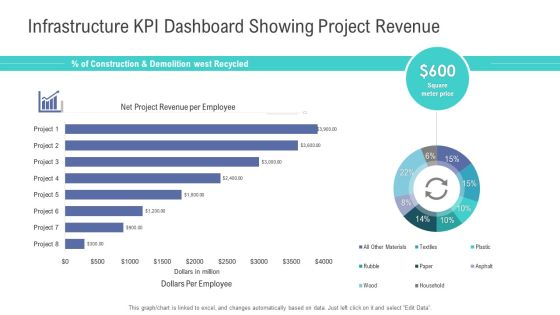
Financial Functional Assessment Infrastructure KPI Dashboard Showing Project Revenue Pictures PDF
Deliver and pitch your topic in the best possible manner with this financial functional assessment infrastructure kpi dashboard showing project revenue pictures pdf. Use them to share invaluable insights on infrastructure kpi dashboard showing project revenue and impress your audience. This template can be altered and modified as per your expectations. So, grab it now.

BPO Managing Enterprise Financial Transactions Employee Payroll Details Dashboard Bons Mockup PDF
Presenting this set of slides with name bpo managing enterprise financial transactions employee payroll details dashboard bons mockup pdf. The topics discussed in these slide is employee payroll details dashboard. This is a completely editable PowerPoint presentation and is available for immediate download. Download now and impress your audience.

BPO Managing Enterprise Financial Transactions Employee Payroll Details Dashboard Portrait PDF
Presenting this set of slides with name bpo managing enterprise financial transactions employee payroll details dashboard portrait pdf. The topics discussed in these slide is employee payroll details dashboard. This is a completely editable PowerPoint presentation and is available for immediate download. Download now and impress your audience.

Outsource Bookkeeping Service Manage Financial Transactions Employee Payroll Details Dashboard Bons Portrait PDF
Presenting this set of slides with name outsource bookkeeping service manage financial transactions employee payroll details dashboard bons portrait pdf. The topics discussed in these slide is employee payroll details dashboard. This is a completely editable PowerPoint presentation and is available for immediate download. Download now and impress your audience.
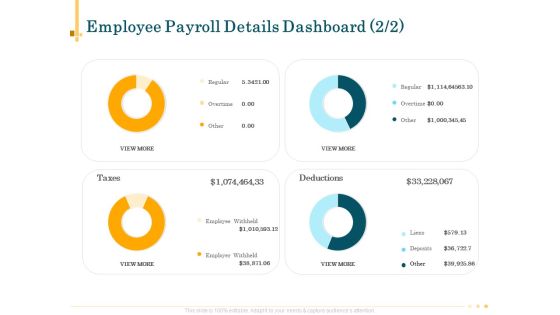
Outsource Bookkeeping Service Manage Financial Transactions Employee Payroll Details Dashboard Rules Introduction PDF
Presenting this set of slides with name outsource bookkeeping service manage financial transactions employee payroll details dashboard rules introduction pdf. The topics discussed in these slide is employee payroll details dashboard. This is a completely editable PowerPoint presentation and is available for immediate download. Download now and impress your audience.
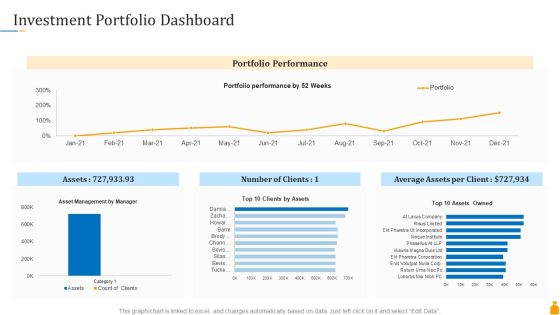
Financial Banking PPT Investment Portfolio Dashboard Ppt Slides Design Inspiration PDF
Deliver an awe-inspiring pitch with this creative financial banking ppt investment portfolio dashboard ppt slides design inspiration pdf bundle. Topics like investment portfolio dashboard can be discussed with this completely editable template. It is available for immediate download depending on the needs and requirements of the user.

Company Risk Assessment Plan Financial Risk Management Key Metrics Dashboard Brochure PDF
This slide covers dashboard to manage and monitor financial risks faced by the enterprise. It includes details related to kpis such as risk heat map, risk rating breakdown, top 5 vulnerabilities etc. Crafting an eye catching presentation has never been more straightforward. Let your presentation shine with this tasteful yet straight forward Company Risk Assessment Plan Financial Risk Management Key Metrics Dashboard Brochure PDF template. It offers a minimalistic and classy look that is great for making a statement. The colors have been employed intelligently to add a bit of playfulness while still remaining professional. Construct the ideal Company Risk Assessment Plan Financial Risk Management Key Metrics Dashboard Brochure PDF that effortlessly grabs the attention of your audience. Begin now and be certain to wow your customers.
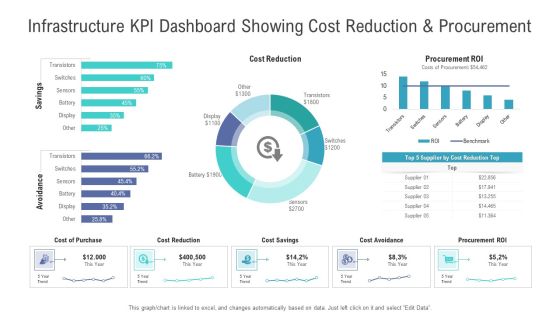
Financial Functional Assessment Infrastructure KPI Dashboard Showing Cost Reduction And Procurement Brochure PDF
Deliver an awe-inspiring pitch with this creative financial functional assessment infrastructure kpi dashboard showing cost reduction and procurement brochure pdf bundle. Topics like cost reduction, cost savings, cost avoidance, cost of purchase, procurement roi can be discussed with this completely editable template. It is available for immediate download depending on the needs and requirements of the user.
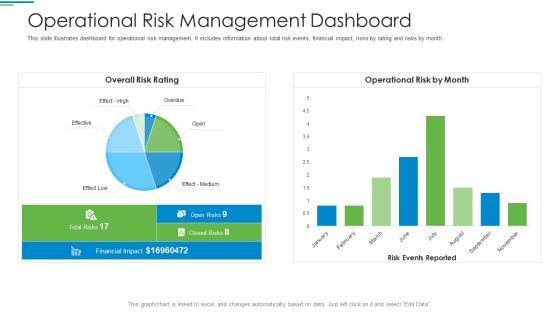
Operational Risk Management Structure In Financial Companies Operational Risk Management Dashboard Rules PDF
This slide illustrates dashboard for operational risk management. It includes information about total risk events, financial impact, risks by rating and risks by month. Deliver an awe inspiring pitch with this creative operational risk management structure in financial companies operational risk management dashboard rules pdf bundle. Topics like overall risk rating, operational risk by month can be discussed with this completely editable template. It is available for immediate download depending on the needs and requirements of the user.
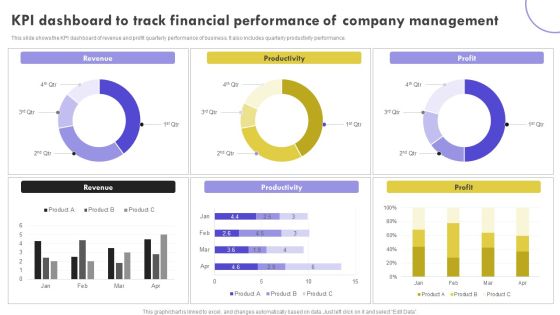
KPI Dashboard To Track Financial Performance Of Company Management Clipart PDF
This slide shows the KPI dashboard of revenue and profit quarterly performance of business. It also includes quarterly productivity performance. Pitch your topic with ease and precision using this KPI Dashboard To Track Financial Performance Of Company Management Clipart PDF. This layout presents information on Revenue, Productivity, Profit. It is also available for immediate download and adjustment. So, changes can be made in the color, design, graphics or any other component to create a unique layout.

KPI Dashboard To Analyze Financial Improvements Effective Planning For Monetary Portrait PDF
This slide showcases the KPIs that would help our business organization to evaluate improvements with the new financial strategy implementation. It includes total income, total expenses, accounts receivable, etc.Find highly impressive KPI Dashboard To Analyze Financial Improvements Effective Planning For Monetary Portrait PDF on Slidegeeks to deliver a meaningful presentation. You can save an ample amount of time using these presentation templates. No need to worry to prepare everything from scratch because Slidegeeks experts have already done a huge research and work for you. You need to download KPI Dashboard To Analyze Financial Improvements Effective Planning For Monetary Portrait PDF for your upcoming presentation. All the presentation templates are 100precent editable and you can change the color and personalize the content accordingly. Download now,
Estimating Business Overall Performance Kpi Dashboard To Measure Financial Position Inspiration PDF
The following slide outlines a comprehensive key performance indicator KPI dashboard highlighting different financial metrics. The KPIs are quick and current ratio, cash balance, days sales outstanding etc. Welcome to our selection of the Estimating Business Overall Performance Kpi Dashboard To Measure Financial Position Inspiration PDF. These are designed to help you showcase your creativity and bring your sphere to life. Planning and Innovation are essential for any business that is just starting out. This collection contains the designs that you need for your everyday presentations. All of our PowerPoints are 100 percent editable, so you can customize them to suit your needs. This multi-purpose template can be used in various situations. Grab these presentation templates today.

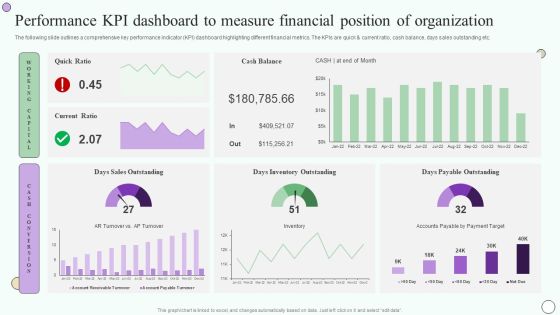
Performance KPI Dashboard To Measure Financial Position Of Organization Pictures PDF
The following slide outlines a comprehensive key performance indicator KPI dashboard highlighting different financial metrics. The KPIs are quick and current ratio, cash balance, days sales outstanding etc. Slidegeeks is here to make your presentations a breeze with Performance KPI Dashboard To Measure Financial Position Of Organization Pictures PDF With our easy to use and customizable templates, you can focus on delivering your ideas rather than worrying about formatting. With a variety of designs to choose from, you are sure to find one that suits your needs. And with animations and unique photos, illustrations, and fonts, you can make your presentation pop. So whether you are giving a sales pitch or presenting to the board, make sure to check out Slidegeeks first.

Overview Of Organizational Performance Kpi Dashboard To Measure Financial Position Sample PDF
The following slide outlines a comprehensive key performance indicator KPI dashboard highlighting different financial metrics. The KPIs are quick and current ratio, cash balance, days sales outstanding etc. Welcome to our selection of the Overview Of Organizational Performance Kpi Dashboard To Measure Financial Position Sample PDF. These are designed to help you showcase your creativity and bring your sphere to life. Planning and Innovation are essential for any business that is just starting out. This collection contains the designs that you need for your everyday presentations. All of our PowerPoints are 100 percent editable, so you can customize them to suit your needs. This multi-purpose template can be used in various situations. Grab these presentation templates today.

Financial Forecast And Essential Metrics Dashboard Showing Cash Management Designs PDF
This slide contains the projections of the company financials to predict the future position so that better decisions could be taken for the growth prospective. It also includes ratios, cash balance, inventory analysis , etc. Showcasing this set of slides titled Financial Forecast And Essential Metrics Dashboard Showing Cash Management Designs PDF. The topics addressed in these templates are Days Sales Outstanding, Cash Management Dashboard, Days Inventory Outstanding. All the content presented in this PPT design is completely editable. Download it and make adjustments in color, background, font etc. as per your unique business setting.

Strategies For Dynamic Supply Chain Agility Supply Chain Kpi Dashboard For Effective Financial Analysis Demonstration PDF
Mentioned slide illustrates KPI dashboard that can be used by managers to assess financial health of supply chain business. KPIs covered are supply chain costs versus sales, cash to order cycle, warehouse operating cost distribution etc. The Strategies For Dynamic Supply Chain Agility Supply Chain Kpi Dashboard For Effective Financial Analysis Demonstration PDF is a compilation of the most recent design trends as a series of slides. It is suitable for any subject or industry presentation, containing attractive visuals and photo spots for businesses to clearly express their messages. This template contains a variety of slides for the user to input data, such as structures to contrast two elements, bullet points, and slides for written information. Slidegeeks is prepared to create an impression.
Optimizing AI Strategies To Improve Financial Services Digital Media Tracking Dashboard Professional PDF
This slide covers the digital marketing dashboard along with the lead breakdown, google analytics traffic, and social media channels. Do you know about Slidesgeeks Optimizing AI Strategies To Improve Financial Services Digital Media Tracking Dashboard Professional PDF These are perfect for delivering any kind od presentation. Using it, create PowerPoint presentations that communicate your ideas and engage audiences. Save time and effort by using our pre designed presentation templates that are perfect for a wide range of topic. Our vast selection of designs covers a range of styles, from creative to business, and are all highly customizable and easy to edit. Download as a PowerPoint template or use them as Google Slides themes.
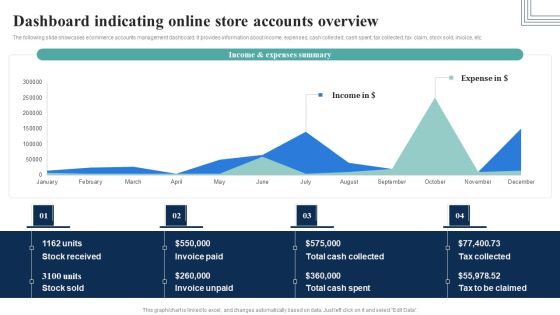
How Electronic Commerce Financial Procedure Can Be Enhanced Dashboard Indicating Online Store Pictures PDF
The following slide showcases ecommerce accounts management dashboard. It provides information about income, expenses, cash collected, cash spent, tax collected, tax claim, stock sold, invoice, etc.Do you know about Slidesgeeks How Electronic Commerce Financial Procedure Can Be Enhanced Dashboard Indicating Online Store Pictures PDF These are perfect for delivering any kind od presentation. Using it, create PowerPoint presentations that communicate your ideas and engage audiences. Save time and effort by using our pre-designed presentation templates that are perfect for a wide range of topic. Our vast selection of designs covers a range of styles, from creative to business, and are all highly customizable and easy to edit. Download as a PowerPoint template or use them as Google Slides themes.

Assessing Stocks In Financial Market Organization Performance Dashboard For Equity Research Ppt PowerPoint Presentation Styles Slide Download PDF
Presenting this set of slides with name assessing stocks in financial market organization performance dashboard for equity research ppt powerpoint presentation styles slide download pdf. The topics discussed in these slides are return equity, return assets, working capital ratio, debt equity ratio. This is a completely editable PowerPoint presentation and is available for immediate download. Download now and impress your audience.
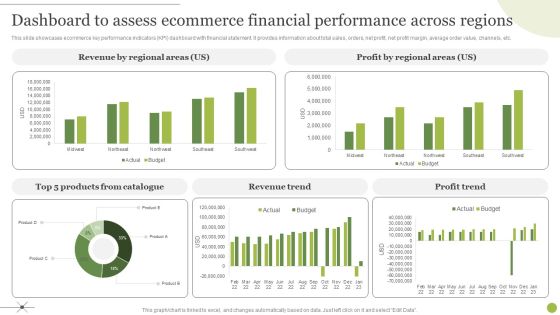
Managing E Commerce Business Accounting Dashboard To Assess Ecommerce Financial Performance Across Regions Graphics PDF
This slide showcases ecommerce key performance indicators KPI dashboard with financial statement. It provides information about total sales, orders, net profit, net profit margin, average order value, channels, etc. Do you have to make sure that everyone on your team knows about any specific topic I yes, then you should give Managing E Commerce Business Accounting Dashboard To Assess Ecommerce Financial Performance Across Regions Graphics PDF a try. Our experts have put a lot of knowledge and effort into creating this impeccable Managing E Commerce Business Accounting Dashboard To Assess Ecommerce Financial Performance Across Regions Graphics PDF. You can use this template for your upcoming presentations, as the slides are perfect to represent even the tiniest detail. You can download these templates from the Slidegeeks website and these are easy to edit. So grab these today.

Business Restructuring Process Dashboard To Measure Business Financial Performance Rules PDF
This slide shows the dashboard to measure business financial performance which focuses on revenues, debt to equity, net profit margin, gross profit margin and return on equity. If you are looking for a format to display your unique thoughts, then the professionally designed Business Restructuring Process Dashboard To Measure Business Financial Performance Rules PDF is the one for you. You can use it as a Google Slides template or a PowerPoint template. Incorporate impressive visuals, symbols, images, and other charts. Modify or reorganize the text boxes as you desire. Experiment with shade schemes and font pairings. Alter, share or cooperate with other people on your work. Download Business Restructuring Process Dashboard To Measure Business Financial Performance Rules PDF and find out how to give a successful presentation. Present a perfect display to your team and make your presentation unforgettable.

Deployment Of Business Process Dashboard To Measure Business Financial Performance Microsoft PDF
This slide shows the dashboard to measure business financial performance which focuses on revenues, debt to equity, net profit margin, gross profit margin and return on equity. Do you have to make sure that everyone on your team knows about any specific topic I yes, then you should give Deployment Of Business Process Dashboard To Measure Business Financial Performance Microsoft PDF a try. Our experts have put a lot of knowledge and effort into creating this impeccable Deployment Of Business Process Dashboard To Measure Business Financial Performance Microsoft PDF. You can use this template for your upcoming presentations, as the slides are perfect to represent even the tiniest detail. You can download these templates from the Slidegeeks website and these are easy to edit. So grab these today.

Organizational Financial Assets Assessment Project Portfolio Summary Dashboard Gride Designs PDF
Deliver an awe-inspiring pitch with this creative organizational financial assets assessment project portfolio summary dashboard gride designs pdf. bundle. Topics like pipeline projects, projects by department, financial forecast can be discussed with this completely editable template. It is available for immediate download depending on the needs and requirements of the user.
Organizational Financial Assets Assessment Project Portfolio Summary Dashboard Icon Structure PDF
Deliver and pitch your topic in the best possible manner with this organizational financial assets assessment project portfolio summary dashboard icon structure pdf. Use them to share invaluable insights on total completed projects, on boarded projects, average cost and impress your audience. This template can be altered and modified as per your expectations. So, grab it now.

Conducting Monetary Inclusion With Mobile Financial Services Total Loan And Deposits Dashboard Download PDF
This slide illustrates total loan and deposit dashboard covering information by region, by district along with twelve-month trend.Deliver and pitch your topic in the best possible manner with this Conducting Monetary Inclusion With Mobile Financial Services Total Loan And Deposits Dashboard Download PDF. Use them to share invaluable insights on Total Loan, Deposits Dashboard and impress your audience. This template can be altered and modified as per your expectations. So, grab it now.
Insurance And Financial Product Insurance Agency Activities Tracking Dashboard Download PDF
This slide provides glimpse about insurance agency activities tracking dashboard which help management in monitoring activities. Deliver an awe inspiring pitch with this creative Insurance And Financial Product Insurance Agency Activities Tracking Dashboard Download PDF bundle. Topics like Scheduled Reports, Pending Activities, Latest Customers can be discussed with this completely editable template. It is available for immediate download depending on the needs and requirements of the user.

BPR To Develop Operational Effectiveness Dashboard To Measure Business Financial Performance Elements PDF
This slide shows the dashboard to measure business financial performance which focuses on revenues, debt to equity, net profit margin, gross profit margin and return on equity. Coming up with a presentation necessitates that the majority of the effort goes into the content and the message you intend to convey. The visuals of a PowerPoint presentation can only be effective if it supplements and supports the story that is being told. Keeping this in mind our experts created BPR To Develop Operational Effectiveness Dashboard To Measure Business Financial Performance Elements PDF to reduce the time that goes into designing the presentation. This way, you can concentrate on the message while our designers take care of providing you with the right template for the situation.

Financial Services Organization Monthly Sales Forecast Dashboard Ppt Summary Slideshow PDF
This slide shows the dashboard representing data related to monthly sales forecast of the organization offering financial services to its clients. It includes information related to forecasted data, sales forecast, total sales, forecast projection etc. Showcasing this set of slides titled Financial Services Organization Monthly Sales Forecast Dashboard Ppt Summary Slideshow PDF. The topics addressed in these templates are Forecasts Sales, Time Series View, Forecast Projection. All the content presented in this PPT design is completely editable. Download it and make adjustments in color, background, font etc. as per your unique business setting.
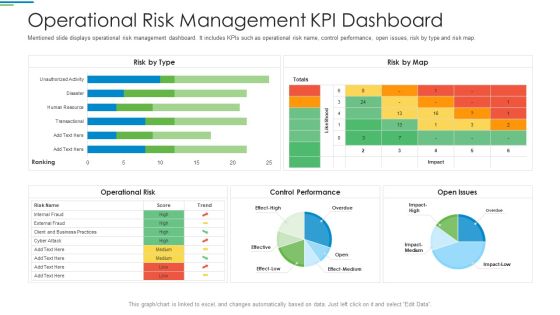
Operational Risk Management Structure In Financial Companies Operational Risk Management Kpi Dashboard Download PDF
Mentioned slide displays operational risk management dashboard. It includes KPIs such as operational risk name, control performance, open issues, risk by type and risk map. Deliver and pitch your topic in the best possible manner with this operational risk management structure in financial companies operational risk management kpi dashboard download pdf. Use them to share invaluable insights on operational risk name, control performance, open issues, risk by type and risk map and impress your audience. This template can be altered and modified as per your expectations. So, grab it now.
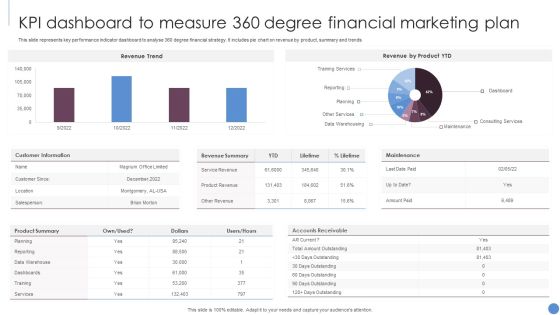
KPI Dashboard To Measure 360 Degree Financial Marketing Plan Slides PDF
This slide represents key performance indicator dashboard to analyse 360 degree financial strategy. It includes pie chart on revenue by product, summary and trends. Showcasing this set of slides titled KPI Dashboard To Measure 360 Degree Financial Marketing Plan Slides PDF. The topics addressed in these templates are Revenue Trend, Revenue Product YTD, Customer Information. All the content presented in this PPT design is completely editable. Download it and make adjustments in color, background, font etc. as per your unique business setting.
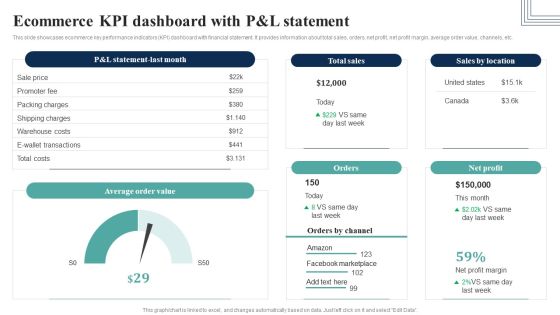
How Electronic Commerce Financial Procedure Can Be Enhanced Ecommerce Kpi Dashboard Slides PDF
This slide showcases ecommerce key performance indicators KPI dashboard with financial statement. It provides information about total sales, orders, net profit, net profit margin, average order value, channels, etc.Create an editable How Electronic Commerce Financial Procedure Can Be Enhanced Ecommerce Kpi Dashboard Slides PDF that communicates your idea and engages your audience. Whether you are presenting a business or an educational presentation, pre-designed presentation templates help save time. How Electronic Commerce Financial Procedure Can Be Enhanced Ecommerce Kpi Dashboard Slides PDF is highly customizable and very easy to edit, covering many different styles from creative to business presentations. Slidegeeks has creative team members who have crafted amazing templates. So, go and get them without any delay.
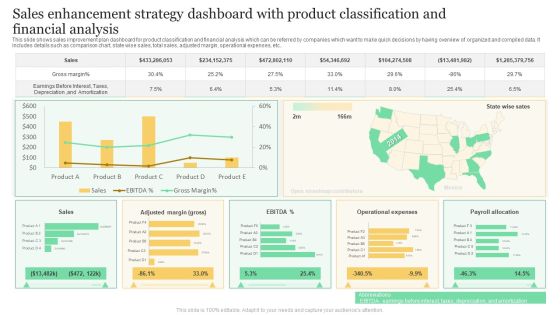
Sales Enhancement Strategy Dashboard With Product Classification And Financial Analysis Formats PDF
This slide shows sales improvement plan dashboard for product classification and financial analysis which can be referred by companies which want to make quick decisions by having overview of organized and compiled data. It includes details such as comparison chart, state wise sales, total sales, adjusted margin, operational expenses, etc. Showcasing this set of slides titled Sales Enhancement Strategy Dashboard With Product Classification And Financial Analysis Formats PDF. The topics addressed in these templates are Gross Margin, Sales, Operational Expenses. All the content presented in this PPT design is completely editable. Download it and make adjustments in color, background, font etc. as per your unique business setting.

Guide To Healthcare Services Administration KPI Dashboard To Analyze Performance Healthcare Financial Demonstration PDF
The following slide showcases key performance indicator KPI dashboard which can be used to analyze the financial performance of hospital. The metrics covered in the slide are net profit margin, income and expenses, etc. Here you can discover an assortment of the finest PowerPoint and Google Slides templates. With these templates, you can create presentations for a variety of purposes while simultaneously providing your audience with an eye catching visual experience. Download Guide To Healthcare Services Administration KPI Dashboard To Analyze Performance Healthcare Financial Demonstration PDF to deliver an impeccable presentation. These templates will make your job of preparing presentations much quicker, yet still, maintain a high level of quality. Slidegeeks has experienced researchers who prepare these templates and write high quality content for you. Later on, you can personalize the content by editing the Guide To Healthcare Services Administration KPI Dashboard To Analyze Performance Healthcare Financial Demonstration PDF.

Organizational Financial Assets Assessment Portfolio Management Securities Allocation Dashboard Brochure PDF
Deliver and pitch your topic in the best possible manner with this organizational financial assets assessment portfolio management securities allocation dashboard brochure pdf. Use them to share invaluable insights on portfolio, commodities and impress your audience. This template can be altered and modified as per your expectations. So, grab it now.

Summary Financial Accounting Statement Profit And Loss Analysis Dashboard Elements PDF
This graph or chart is linked to excel, and changes automatically based on data. Just left click on it and select Edit Data. Deliver an awe inspiring pitch with this creative Summary Financial Accounting Statement Profit And Loss Analysis Dashboard Elements PDF bundle. Topics like P And L Structure Dynamics, Dupont Rations, Debt Coverage Ratios, Creditworthiness Assessment can be discussed with this completely editable template. It is available for immediate download depending on the needs and requirements of the user.

Dashboards Related To The Zoo Financials And Operations Guidelines PDF
This slide shows the dashboard or KPI related to the ABC Zoo which includes the forecasted revenue, competitors details, visitors attractions, capital expenditure and many more. Deliver an awe inspiring pitch with this creative dashboards related to the zoo financials and operations guidelines pdf bundle. Topics like dashboards related to the zoo financials and operations can be discussed with this completely editable template. It is available for immediate download depending on the needs and requirements of the user.

Dashboards Related To The Zoo Financials And Operations Diagrams PDF
This slide shows the dashboard or KPI related to the ABC Zoo which includes the forecasted revenue, competitors details, visitors attractions, capital expenditure and many kore. Deliver and pitch your topic in the best possible manner with this dashboards related to the zoo financials and operations diagrams pdf. Use them to share invaluable insights on capital expenditure, revenue and impress your audience. This template can be altered and modified as per your expectations. So, grab it now.

Monetary Planning And Evaluation Guide Performance KPI Dashboard To Measure Financial Position Of Organization Ppt File Slides PDF
The following slide outlines a comprehensive key performance indicator KPI dashboard highlighting different financial metrics. The KPIs are quick and current ratio, cash balance, days sales outstanding etc. The best PPT templates are a great way to save time, energy, and resources. Slidegeeks have 100 percent editable powerpoint slides making them incredibly versatile. With these quality presentation templates, you can create a captivating and memorable presentation by combining visually appealing slides and effectively communicating your message. Download Monetary Planning And Evaluation Guide Performance KPI Dashboard To Measure Financial Position Of Organization Ppt File Slides PDF from Slidegeeks and deliver a wonderful presentation.
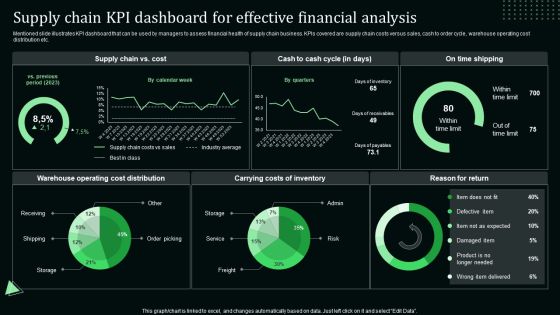
Supply Chain Kpi Dashboard For Effective Financial Analysis Stand Out Digital Supply Chain Tactics Enhancing Graphics PDF
Mentioned slide illustrates KPI dashboard that can be used by managers to assess financial health of supply chain business. KPIs covered are supply chain costs versus sales, cash to order cycle, warehouse operating cost distribution etc.Coming up with a presentation necessitates that the majority of the effort goes into the content and the message you intend to convey. The visuals of a PowerPoint presentation can only be effective if it supplements and supports the story that is being told. Keeping this in mind our experts created Supply Chain Kpi Dashboard For Effective Financial Analysis Stand Out Digital Supply Chain Tactics Enhancing Graphics PDF to reduce the time that goes into designing the presentation. This way, you can concentrate on the message while our designers take care of providing you with the right template for the situation.
KPI Dashboard For Tracking Commercial Banking And Financial Activities Download PDF
This slide depicts a dashboard for tracking the banking and financial activities of a business enterprise to measure the income and expenses. The key performing indicators are business accounts, paid, pending and cancelled transactions etc. Pitch your topic with ease and precision using this KPI Dashboard For Tracking Commercial Banking And Financial Activities Download PDF. This layout presents information on KPI Dashboard, Tracking Commercial Banking, Financial Activities. It is also available for immediate download and adjustment. So, changes can be made in the color, design, graphics or any other component to create a unique layout.
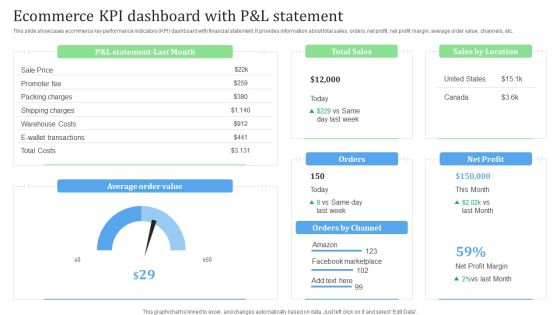
Ecommerce KPI Dashboard With P And L Statement Financial Management Strategies Background PDF
This slide showcases ecommerce key performance indicators KPI dashboard with financial statement. It provides information about total sales, orders, net profit, net profit margin, average order value, channels, etc.Whether you have daily or monthly meetings, a brilliant presentation is necessary. Ecommerce KPI Dashboard With P And L Statement Financial Management Strategies Background PDF can be your best option for delivering a presentation. Represent everything in detail using Ecommerce KPI Dashboard With P And L Statement Financial Management Strategies Background PDF and make yourself stand out in meetings. The template is versatile and follows a structure that will cater to your requirements. All the templates prepared by Slidegeeks are easy to download and edit. Our research experts have taken care of the corporate themes as well. So, give it a try and see the results.

KPI Dashboard To Analyze Performance Of Healthcare Financial Department Summary PDF
The following slide showcases key performance indicator KPI dashboard which can be used to analyze the financial performance of hospital. The metrics covered in the slide are net profit margin, income and expenses, etc. Do you have an important presentation coming up Are you looking for something that will make your presentation stand out from the rest Look no further than KPI Dashboard To Analyze Performance Of Healthcare Financial Department Summary PDF. With our professional designs, you can trust that your presentation will pop and make delivering it a smooth process. And with Slidegeeks, you can trust that your presentation will be unique and memorable. So why wait Grab KPI Dashboard To Analyze Performance Of Healthcare Financial Department Summary PDF today and make your presentation stand out from the rest.
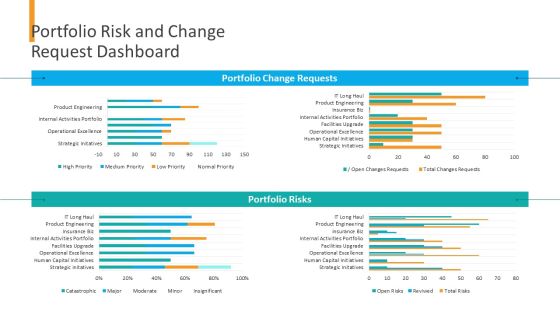
Organizational Financial Assets Assessment Portfolio Risk And Change Request Dashboard Pictures PDF
Deliver and pitch your topic in the best possible manner with this organizational financial assets assessment portfolio risk and change request dashboard pictures pdf. Use them to share invaluable insights on portfolio change requests, portfolio risks and impress your audience. This template can be altered and modified as per your expectations. So, grab it now.

Roadmap For Financial Accounting Transformation Sales And Profit Margin Analysis Dashboard Pictures PDF
Deliver an awe inspiring pitch with this creative roadmap for financial accounting transformation sales and profit margin analysis dashboard pictures pdf bundle. Topics like profitability indicator ratios, costs and expenses, expenses breakdown can be discussed with this completely editable template. It is available for immediate download depending on the needs and requirements of the user.

Providing Electronic Financial Services To Existing Consumers Branch Scoreboard Kpi Dashboard Brochure PDF
This slide portrays branch scoreboard dashboard covering metrics such as accounts opened and closed, deposits to goal, accounts by type, expense to budget and referrals by product. Deliver an awe inspiring pitch with this creative Providing Electronic Financial Services To Existing Consumers Branch Scoreboard Kpi Dashboard Brochure PDF bundle. Topics like Product, Budget, Goal, Expense can be discussed with this completely editable template. It is available for immediate download depending on the needs and requirements of the user.

KPI Dashboard To Analyze Performance Of Healthcare Financial Department Guidelines PDF
The following slide showcases key performance indicator KPI dashboard which can be used to analyze the financial performance of hospital. The metrics covered in the slide are net profit margin, income and expenses, etc. Retrieve professionally designed KPI Dashboard To Analyze Performance Of Healthcare Financial Department Guidelines PDF to effectively convey your message and captivate your listeners. Save time by selecting pre made slideshows that are appropriate for various topics, from business to educational purposes. These themes come in many different styles, from creative to corporate, and all of them are easily adjustable and can be edited quickly. Access them as PowerPoint templates or as Google Slides themes. You do not have to go on a hunt for the perfect presentation because Slidegeeks got you covered from everywhere.

Dashboard Indicating Online Store Accounts Overview Financial Management Strategies Clipart PDF
The following slide showcases ecommerce accounts management dashboard. It provides information about income, expenses, cash collected, cash spent, tax collected, tax claim, stock sold, invoice, etc.From laying roadmaps to briefing everything in detail, our templates are perfect for you. You can set the stage with your presentation slides. All you have to do is download these easy-to-edit and customizable templates. Dashboard Indicating Online Store Accounts Overview Financial Management Strategies Clipart PDF will help you deliver an outstanding performance that everyone would remember and praise you for. Do download this presentation today.
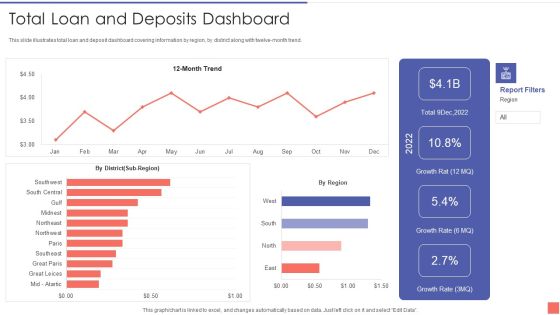
Providing Electronic Financial Services To Existing Consumers Total Loan And Deposits Dashboard Guidelines PDF
This slide illustrates total loan and deposit dashboard covering information by region, by district along with twelve-month trend. Deliver an awe inspiring pitch with this creative Providing Electronic Financial Services To Existing Consumers Total Loan And Deposits Dashboard Guidelines PDF bundle. Topics like Total Loan And Deposits Dashboard can be discussed with this completely editable template. It is available for immediate download depending on the needs and requirements of the user.
Financial Services Advisory Business Plan Insurance Agency Activities Tracking Dashboard Introduction PDF
This slide provides glimpse about insurance agency activities tracking dashboard which help management in monitoring activities. Deliver an awe inspiring pitch with this creative Financial Services Advisory Business Plan Insurance Agency Activities Tracking Dashboard Introduction PDF bundle. Topics like Claim Reviews, Claim Renewals, Activities, Vehicle Insurance, Scheduled Reports can be discussed with this completely editable template. It is available for immediate download depending on the needs and requirements of the user.
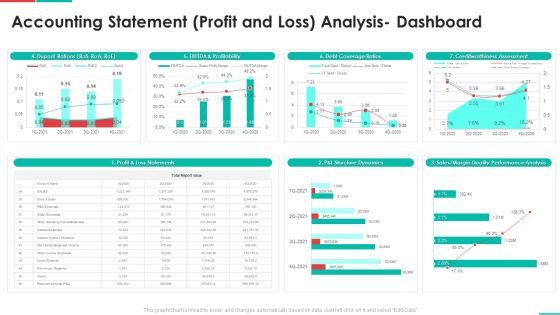
Roadmap For Financial Accounting Transformation Accounting Statement Profit And Loss Analysis Dashboard Clipart PDF
Deliver an awe inspiring pitch with this creative roadmap for financial accounting transformation accounting statement profit and loss analysis dashboard clipart pdf bundle. Topics like profit and loss statements, p and l structure dynamics, sales or margin quality performance analysis, creditworthiness assessment, debt coverage ratios can be discussed with this completely editable template. It is available for immediate download depending on the needs and requirements of the user.

Dashboards Related To The Zoo Financials And Operations Ppt Portfolio Graphics Example PDF
This slide shows the dashboard KPI related to the ABC Zoo which includes the forecasted revenue, competitors details, visitors attractions, capital expenditure and many more.Deliver and pitch your topic in the best possible manner with this dashboards related to the zoo financials and operations ppt portfolio graphics example pdf. Use them to share invaluable insights on capital expenditure, visitors attraction, forecasted revenue and impress your audience. This template can be altered and modified as per your expectations. So, grab it now.

Dashboards Related To The Zoo Financials And Operations Ppt Outline Portfolio PDF
This slide shows the dashboard or KPI related to the ABC Zoo which includes the forecasted revenue, competitors details, visitors attractions, capital expenditure and many more. Deliver an awe-inspiring pitch with this creative dashboards related to the zoo financials and operations ppt outline portfolio pdf. bundle. Topics like forecasted revenue, visitors attraction, capital expenditure, advertising and marketing can be discussed with this completely editable template. It is available for immediate download depending on the needs and requirements of the user.

Dashboards Related To The Zoo Financials And Operations Ppt Icon Professional PDF
This slide shows the dashboard KPI related to the ABC Zoo which includes the forecasted revenue, competitors details, visitors attractions, capital expenditure and many more. Deliver and pitch your topic in the best possible manner with this dashboards related to the zoo financials and operations ppt icon professional pdf. Use them to share invaluable insights on forecasted revenue, visitors attraction and impress your audience. This template can be altered and modified as per your expectations. So, grab it now.

Dashboard For Strategic Evaluation Of Key Business Financials Ppt Gallery Aids PDF
This slide displays dashboard to review business performance and formulate appropriate improvement strategies. It further includes kpis such as revenue comparison, top selling categories, sales by month, customer satisfaction, etc. Showcasing this set of slides titled Dashboard For Strategic Evaluation Of Key Business Financials Ppt Gallery Aids PDF. The topics addressed in these templates are Revenue Comparison, Top Selling Categories, New Customer. All the content presented in this PPT design is completely editable. Download it and make adjustments in color, background, font etc. as per your unique business setting.

KPI Dashboard For Informational Technology Department To Analyze Key Financials Structure PDF
This slide shows KPI dashboard for informational technology department to analyze key financials of companies which assists in decision making for growth. It also includes information about IT department ROI, expenditure vs. Allocated budget, it cost breakdown and it expenditure vs. Revenue. Pitch your topic with ease and precision using this KPI Dashboard For Informational Technology Department To Analyze Key Financials Structure PDF. This layout presents information on Expenditure Vs Allocated, Budget IT Cost, Break Down IT, Expenditure Vs Revenue, IT Department ROI. It is also available for immediate download and adjustment. So, changes can be made in the color, design, graphics or any other component to create a unique layout.
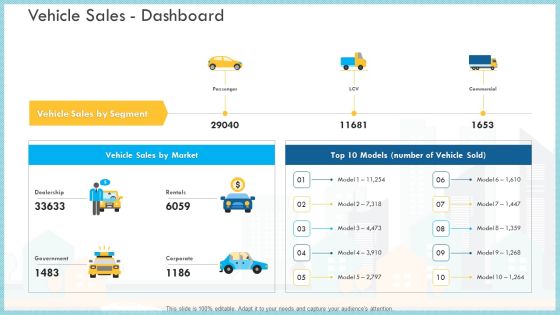
Loss Of Income And Financials Decline In An Automobile Organization Case Study Vehicle Sales Dashboard Infographics PDF
Deliver an awe-inspiring pitch with this creative loss of income and financials decline in an automobile organization case study vehicle sales dashboard infographics pdf bundle. Topics like vehicle sales by segment, vehicle sales by market, government can be discussed with this completely editable template. It is available for immediate download depending on the needs and requirements of the user.
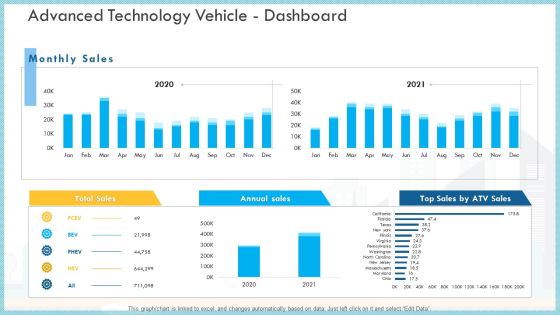
Loss Of Income And Financials Decline In An Automobile Organization Case Study Advanced Technology Vehicle Dashboard Infographics PDF
This graph or chart is linked to excel, and changes automatically based on data. Just left click on it and select Edit Data.Deliver an awe inspiring pitch with this creative loss of income and financials decline in an automobile organization case study advanced technology vehicle dashboard infographics pdf bundle. Topics like total sales, annual sales, monthly sales can be discussed with this completely editable template. It is available for immediate download depending on the needs and requirements of the user.

Financial Ppt PowerPoint Presentation Guide
This is a financial ppt powerpoint presentation guide. This is a three stage process. The stages in this process are business, strategy, marketing, analysis, dashboard, measuring.

Financial Statistics Ppt Samples Download
This is a financial statistics ppt samples download. This is a six stage process. The stages in this process are business, finance, percentage, dollar, data.

Financial Development Analysis Ppt Ideas
This is a financial development analysis ppt ideas. This is a twelve stage process. The stages in this process are business infographic.

Develop Financial Goals Presentation Slides
This is a develop financial goals presentation slides. This is a five stage process. The stages in this process are establish relationship, gather data, develop financial goals, analyze financial status, review proposed plan.\n\n

Financial Assessment Ppt PowerPoint Presentation Styles
This is a financial assessment ppt powerpoint presentation styles. This is a five stage process. The stages in this process are sales volume and value, variable cost of production, incremental fixed cost, contribution and profitability of the new service, claim canalization.
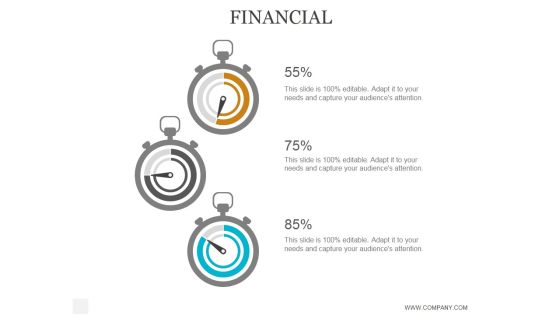
Financial Ppt PowerPoint Presentation Background Designs
This is a financial ppt powerpoint presentation background designs. This is a five stage process. The stages in this process are business, strategy, marketing, analysis, success, finance, dashboard.
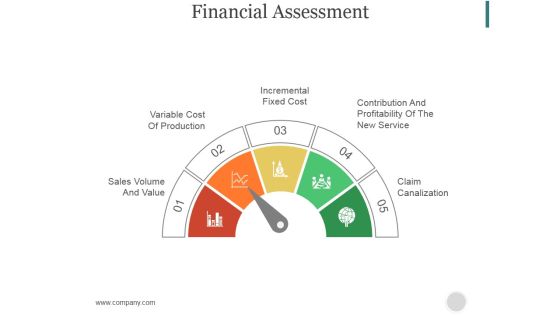
Financial Assessment Ppt PowerPoint Presentation Picture
This is a financial assessment ppt powerpoint presentation picture. This is a five stage process. The stages in this process are sales volume and value, variable cost of production, incremental fixed cost, contribution and profitability of the new service, claim canalization.

Various Winning Strategies To Manage Financial Risk Clipart PDF
The following slide highlights four winning strategies which will assist company to mitigate financial risk. Building a team of advisors, reviewing financial statements, creating a financial dashboard and financial management tools are the strategies which are mentioned in the slide. Presenting Various Winning Strategies To Manage Financial Risk Clipart PDF to dispense important information. This template comprises four stages. It also presents valuable insights into the topics including Review Financials, Financial Dashboard, Management Tools This is a completely customizable PowerPoint theme that can be put to use immediately. So, download it and address the topic impactfully.

Financial Growth Analysis Circular Chart Powerpoint Slides
Visually support your presentation with our above template containing graphics of circular chart. This diagram slide helps to display financial growth analysis. Etch your views in the brains of your audience with this diagram slide.

Column Chart For Financial Analysis Powerpoint Slides
This PowerPoint template has been designed with graphics of column chart with percentage values. You may use this business slide design for topics like financial analysis and planning. This PPT slide is powerful tool to describe your ideas.
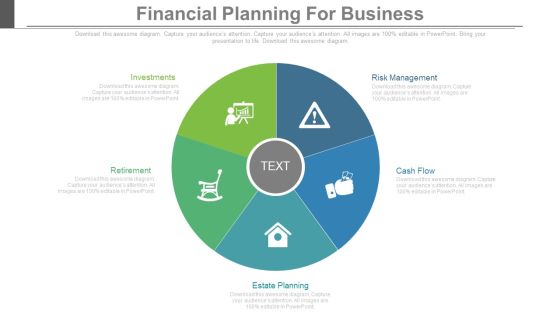
Financial Planning For Business Ppt Slides
This is a financial planning for business ppt slides. This is a five stage process. The stages in this process are business, success, marketing.
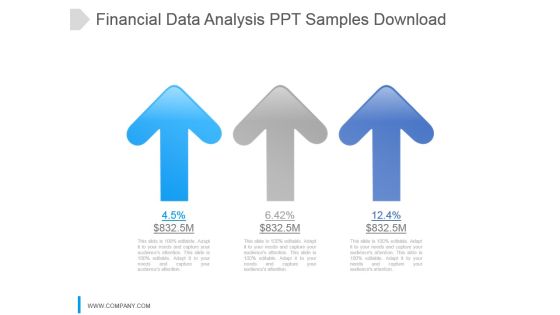
Financial Data Analysis Ppt Samples Download
This is a financial data analysis ppt samples download. This is a three stage process. The stages in this process are arrow, growth, percentage, finance, success.
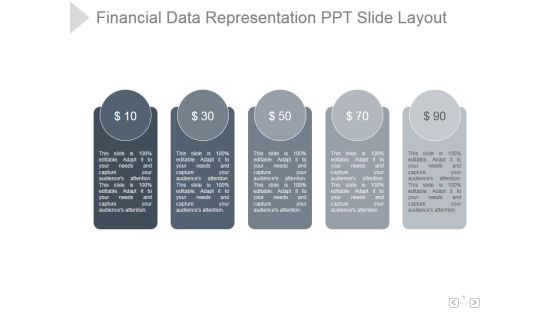
Financial Data Representation Ppt PowerPoint Presentation Rules
This is a financial data representation ppt powerpoint presentation rules. This is a five stage process. The stages in this process are financial, data, representation, marketing, management, business.
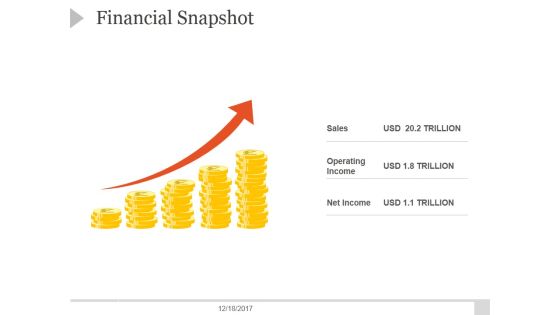
Financial Snapshot Ppt PowerPoint Presentation Samples
This is a financial snapshot ppt powerpoint presentation samples. This is a five stage process. The stages in this process are sales, operating income, net income.
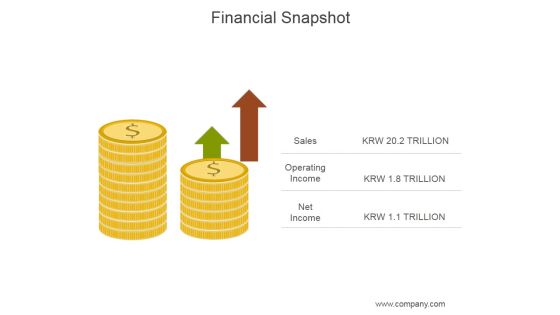
Financial Snapshot Ppt PowerPoint Presentation Layouts
This is a financial snapshot ppt powerpoint presentation layouts. This is a two stage process. The stages in this process are sales, operating income, net income.

Financial Growth Ppt PowerPoint Presentation Layout
This is a financial growth ppt powerpoint presentation layout. This is a three stage process. The stages in this process are business, marketing, finance, percentage, growth.
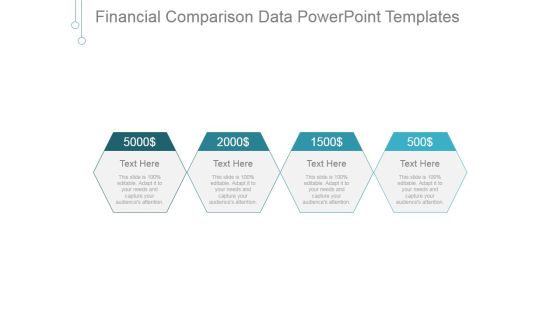
Financial Comparison Data Ppt PowerPoint Presentation Gallery
This is a financial comparison data ppt powerpoint presentation gallery. This is a four stage process. The stages in this process are business, marketing, management, dollar, finance.
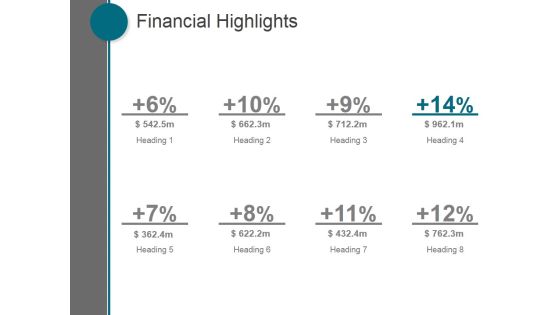
Financial Highlights Ppt PowerPoint Presentation Visual Aids
This is a financial highlights ppt powerpoint presentation visual aids. This is a eight stage process. The stages in this process are business, marketing, management, finance, strategy.

Financial Ppt PowerPoint Presentation Outline Grid
This is a financial ppt powerpoint presentation outline grid. This is a three stage process. The stages in this process are business, strategy, marketing, analysis, finance, purchase, monthly.
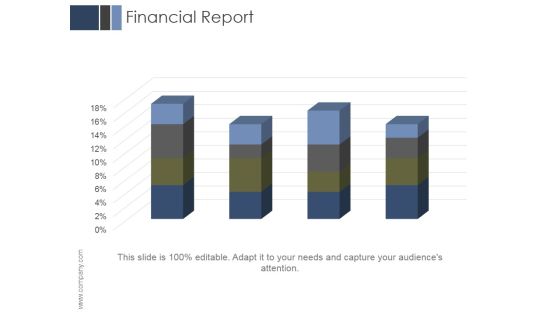
Financial Report Ppt PowerPoint Presentation Templates
This is a financial report ppt powerpoint presentation templates. This is a four stage process. The stages in this process are business, marketing, management, finance, report.
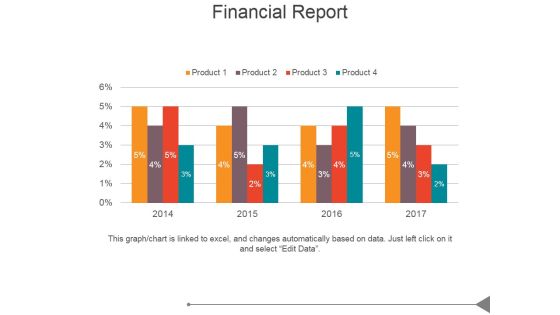
Financial Report Ppt PowerPoint Presentation Professional
This is a financial report ppt powerpoint presentation professional. This is a four stage process. The stages in this process are business, marketing, success, product, growth.

Financial Report Ppt PowerPoint Presentation Styles Skills
This is a financial report ppt powerpoint presentation styles skills. This is a four stage process. The stages in this process are bar graph, business, marketing, success, growth.
Hour Glass For Financial Management PowerPoint Templates
Create dynamic presentations with this professional slide containing a graphic of hour glass with dollar currency notes and coins. This template is designed to portray the concepts of financial management. Add this slide in your presentations to visually support your content

Financial Statement Ppt PowerPoint Presentation Professional Clipart
This is a financial statement ppt powerpoint presentation professional clipart. This is a five stage process. The stages in this process are revenue trends, revenue growth, deal drop off by stage, trends of sales cycle times.

Infographic For Financial Statement Analysis PowerPoint Templates
This PowerPoint template contains infographic slide. This diagram has been designed with circular infographic to exhibit financial statement analysis. Use this diagram to set targets and to measure performance in your presentations.
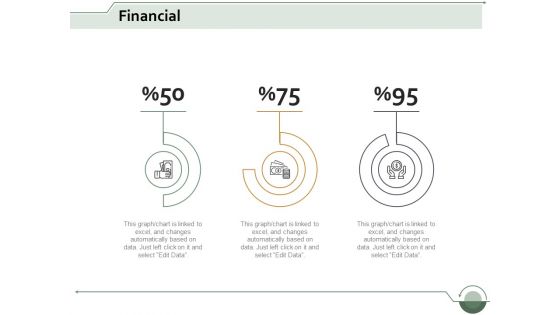
financial analysis ppt powerpoint presentation styles objects
This is a financial analysis ppt powerpoint presentation styles objects. This is a three stage process. The stages in this process are dashboard, business, marketing, management, planning.
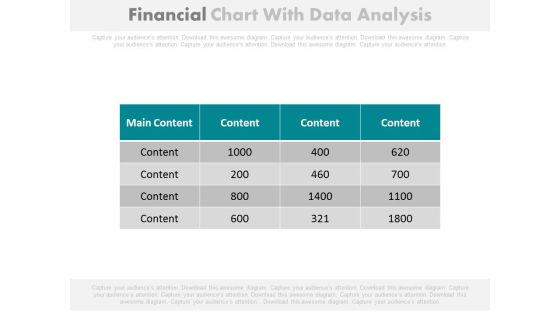
Financial Figures Data Analysis Report Powerpoint Slides
Our above PowerPoint template contains table chart with financial figures. This professional slide may be used to display data analysis report. Enlighten your audience with your breathtaking ideas.
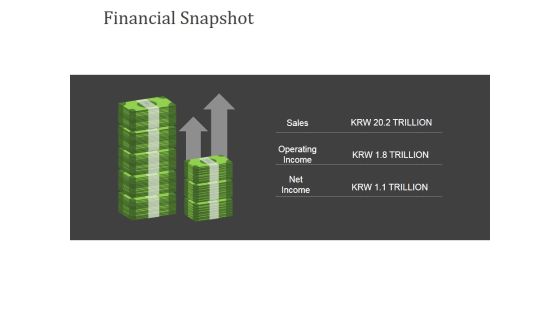
Financial Snapshot Ppt PowerPoint Presentation Model Themes
This is a financial snapshot ppt powerpoint presentation model themes. This is a two stage process. The stages in this process are sales, operating income, net income.
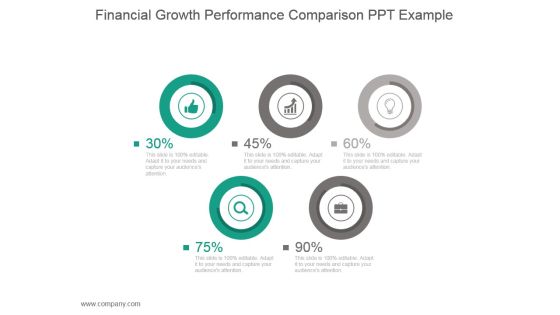
Financial Growth Performance Comparison Ppt Example
This is a financial growth performance comparison ppt example. This is a five stage process. The stages in this process are business, strategy, marketing, finance, icons.

Financial Reporting Manager With Data Powerpoint Slides
This PowerPoint template has been designed with graphics of finance manager and percentage data. This diagram is useful to exhibit financial management. This diagram slide can be used to make impressive presentations.

Financial Highlights Template Ppt PowerPoint Presentation Influencers
This is a financial highlights template ppt powerpoint presentation influencers. This is a three stage process. The stages in this process are business, marketing, management, finance, strategy.

Customer Financial Market Trends Icon Topics PDF
Persuade your audience using this Customer Financial Market Trends Icon Topics PDF. This PPT design covers three stages, thus making it a great tool to use. It also caters to a variety of topics including Customer Financial, Market, Trends. Download this PPT design now to present a convincing pitch that not only emphasizes the topic but also showcases your presentation skills.

Pyramid For Financial Accounting Information Powerpoint Slides
This PowerPoint template has been designed with graphics of pyramid chart. This PPT slide can be used to prepare presentations for profit growth report and also for financial data analysis. You can download finance PowerPoint template to prepare awesome presentations.

Business Performance Review Financial Performance Ppt PowerPoint Presentation Complete Deck
Presenting this set of slides with name business performance review financial performance ppt powerpoint presentation complete deck. The topics discussed in these slides are financial, performance, dashboard, employee, optimization. This is a completely editable PowerPoint presentation and is available for immediate download. Download now and impress your audience.
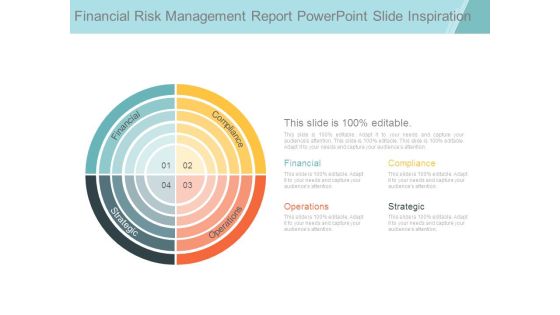
Financial Risk Management Report Powerpoint Slide Inspiration
This is a financial risk management report powerpoint slide inspiration. This is a four stage process. The stages in this process are financial, compliance, operations, strategic.
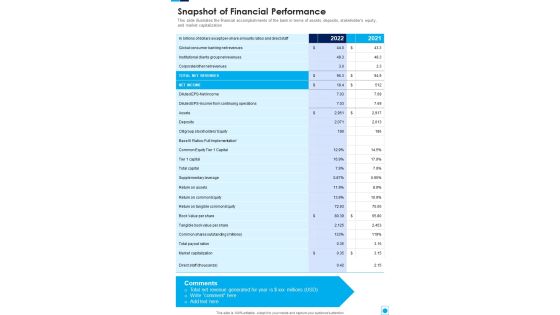
Snapshot Of Financial Performance One Pager Documents
This slide illustrates the financial accomplishments of the bank in terms of assets, deposits, stakeholders equity, and market capitalization. Presenting you a fantastic Snapshot Of Financial Performance One Pager Documents. This piece is crafted on hours of research and professional design efforts to ensure you have the best resource. It is completely editable and its design allow you to rehash its elements to suit your needs. Get this Snapshot Of Financial Performance One Pager Documents A4 One-pager now.
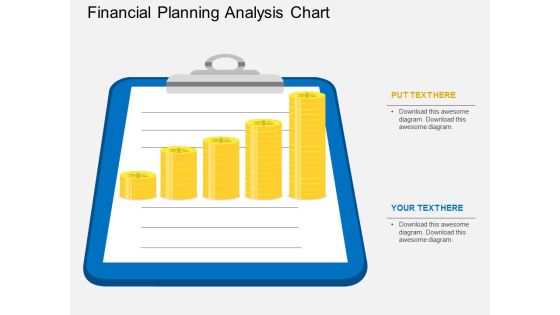
Financial Planning Analysis Chart Powerpoint Template
This PowerPoint slide contains graphics of note pad with gold coins. This professional slide may be used to display financial planning, report and analysis. Adjust the above diagram in your business presentations to give professional impact.

Investment Management And Financial Planning Powerpoint Layout
This is a investment management and financial planning powerpoint layout. This is a six stage process. The stages in this process are financial goals, analyze data to identify shortfalls, customise solutions to suits needs, financial plan, financial situation, take action to implement.

2020 Financial Snapshot One Pager Documents
This slide shows the business highlights illustrating key financial measures including revenues, EBITA margin etc. which are earned from ongoing business in a fiscal year. Presenting you a fantastic 2020 Financial Snapshot One Pager Documents. This piece is crafted on hours of research and professional design efforts to ensure you have the best resource. It is completely editable and its design allow you to rehash its elements to suit your needs. Get this 2020 Financial Snapshot One Pager Documents A4 One-pager now.

2022 Financial Snapshot One Pager Documents
This slide shows the business highlights illustrating key financial measures including revenues, EBITA margin etc. which are earned from ongoing business in a fiscal year.Presenting you a fantastic 2022 Financial Snapshot One Pager Documents. This piece is crafted on hours of research and professional design efforts to ensure you have the best resource. It is completely editable and its design allow you to rehash its elements to suit your needs. Get this 2022 Financial Snapshot One Pager Documents A4 One-pager now.

Data Structure IT Financial Clipart PDF
If your project calls for a presentation, then Slidegeeks is your go-to partner because we have professionally designed, easy-to-edit templates that are perfect for any presentation. After downloading, you can easily edit Data Structure IT Financial Clipart PDF and make the changes accordingly. You can rearrange slides or fill them with different images. Check out all the handy templates
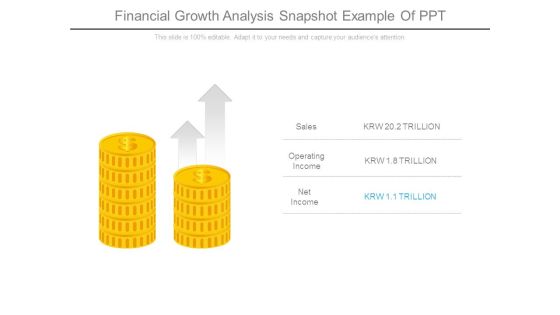
Financial Growth Analysis Snapshot Example Of Ppt
This is a financial growth analysis snapshot example of ppt. This is a two stage process. The stages in this process are sales, operating income, net income.

Financial Snapshot Ppt PowerPoint Presentation Backgrounds
This is a financial snapshot ppt powerpoint presentation backgrounds. This is a six stage process. The stages in this process are icons, strategy, percentage, finance, business.

Financial Services Crm Presentation Visual Aids
This is a financial services crm presentation visual aids. This is a five stage process. The stages in this process are account aggregation, financial planning, crm, data input tools, document management, portfolio accounting, custodian, trading rebalancing, portfolio analytics reporting.
Organizational Financial Assets Assessment Content Formats PDF
This is a organizational financial assets assessment content formats pdf. template with various stages. Focus and dispense information on ten stages using this creative set, that comes with editable features. It contains large content boxes to add your information on topics like portfolio performance dashboard, project portfolio summary dashboard. You can also showcase facts, figures, and other relevant content using this PPT layout. Grab it now.

Financial Market Plan Internal Reporting Ppt Example
This is a financial market plan internal reporting ppt example. This is a five stage process. The stages in this process are internal reporting, maintaining projects capital expenditures, financial market plan, content manufacturers, supplier oriented exchanges.

Organization Financial Performance Report Icon Mockup PDF
Persuade your audience using this Organization Financial Performance Report Icon Mockup PDF. This PPT design covers three stages, thus making it a great tool to use. It also caters to a variety of topics including Organization Financial, Performance Report Icon. Download this PPT design now to present a convincing pitch that not only emphasizes the topic but also showcases your presentation skills.

Financial Analysis Model Powerpoint Slide Show
This is a financial analysis model powerpoint slide show. This is a four stage process. The stages in this process are dollar, symbol, business, marketing, finance.

Financial Services Internet Example Presentation Powerpoint Templates
This is a financial services internet example presentation powerpoint templates. This is a six stage process. The stages in this process are accounting and financial reporting, annual report, management reports, cash flow statement, review compilation and preparation, assurance and advisory.
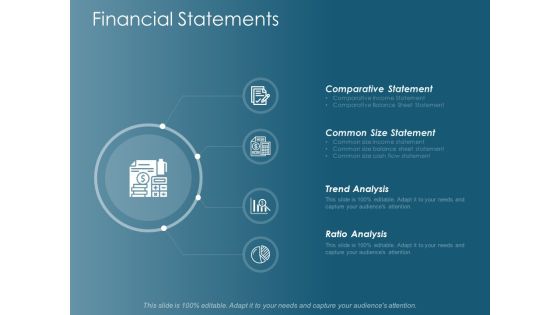
Financial Statements Ppt Powerpoint Presentation Inspiration Example
This is a financial statements ppt powerpoint presentation inspiration example. This is a four stage process. The stages in this process are financial statements, comparative statement, common size statement, trend analysis, ratio analysis.

Financial Statements Ppt Powerpoint Presentation Styles Example
This is a financial statements ppt powerpoint presentation styles example. This is a four stage process. The stages in this process are financial statements, comparative statement, common size statement, trend analysis, ratio analysis.

Data Gathering Draft Financial Plan Ppt Sample
This is a data gathering draft financial plan ppt sample. This is a seven stage process. The stages in this process are data gathering, draft financial plan, investment proposal, estate insurance and education planning, ongoing portfolio management, statement and performance reviews, updating financial plan.

Business Financial Growth Ppt Powerpoint Graphics
This is a business financial growth ppt powerpoint graphics. This is a five stage process. The stages in this process are financial growth, investment, reporting, growth, security and analysis.
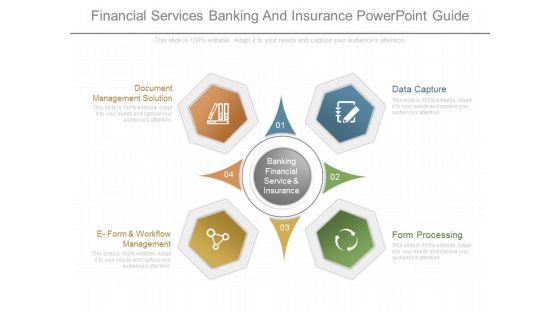
Financial Services Banking And Insurance Powerpoint Guide
This is a financial services banking and insurance powerpoint guide. This is a four stage process. The stages in this process are banking financial service and insurance, data capture, form processing, e form and workflow management, document management solution.

Annual Financial Budget Analysis Example Of Ppt
This is a annual financial budget analysis example of ppt. This is a five stage process. The stages in this process are business, strategy, finance, planning, compare.

Financial Ppt PowerPoint Presentation Infographic Template Graphics
This is a financial ppt powerpoint presentation infographic template graphics. This is a four stage process. The stages in this process are tables, marketing, planning, strategy, finance.

Key Financial Ratios Ppt PowerPoint Presentation Guidelines
This is a key financial ratios ppt powerpoint presentation guidelines. This is a four stage process. The stages in this process are current ratio, debt to equity ratio, ratio, return, return on assets.

Financial Analysis Growth Rate Diagram Powerpoint Layout
This is a financial analysis growth rate diagram powerpoint layout. This is a three stage process. The stages in this process are data analysis, result analysis, growth.
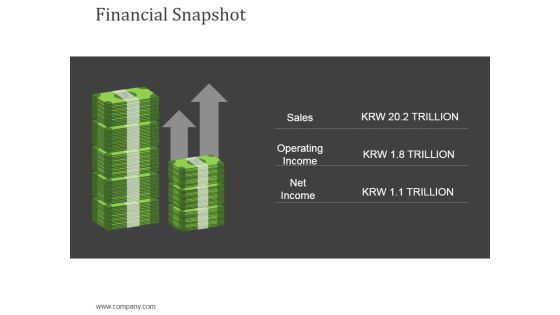
Financial Snapshot Ppt Powerpoint Presentation Layouts Slides
This is a financial snapshot ppt powerpoint presentation layouts slides. This is a two stage process. The stages in this process are sales, operating income, net income, currency, finance.
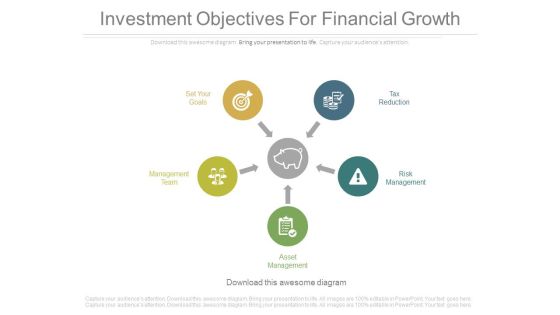
Investment Objectives For Financial Growth Ppt Slides
This is an investment objectives for financial growth ppt slides. This is a five stage process. The stages in this process are marketing, business, success, arrows.
Financial Report Review Procedure Icon Demonstration PDF
Presenting Financial Report Review Procedure Icon Demonstration PDF to dispense important information. This template comprises Four stages. It also presents valuable insights into the topics includingFinancial Report, Review Procedure Icon. This is a completely customizable PowerPoint theme that can be put to use immediately. So, download it and address the topic impactfully.
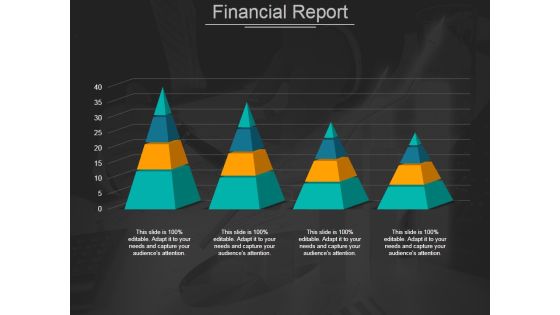
Financial Report Ppt PowerPoint Presentation Summary Gridlines
This is a financial report ppt powerpoint presentation summary gridlines. This is a four stage process. The stages in this process are pyramid, business, marketing, management, shapes.

Financial Reporting Dimension Powerpoint Slide Introduction
This is a financial reporting dimension powerpoint slide introduction. This is a four stage process. The stages in this process are control environment, risk assessment, companies, processes.

Financial Compatibility Ppt PowerPoint Presentation Portfolio Template
This is a financial compatibility ppt powerpoint presentation portfolio template. This is a three stage process. The stages in this process are business, marketing, icons, strategy, management.

Financial Modelling Growth Reporting Workflow Formats PDF
This slide shows financial modelling report development workflow for forecasting the future ups and downs for business. It include steps such as considering historical data, analyzing historical performance and gathering future assumptions etc. Pitch your topic with ease and precision using this Financial Modelling Growth Reporting Workflow Formats PDF. This layout presents information on Forecast Financial Statements, Risk Assessment, Forecasting Assumptions. It is also available for immediate download and adjustment. So, changes can be made in the color, design, graphics or any other component to create a unique layout.
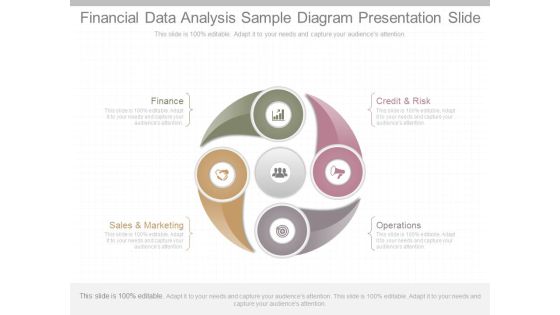
Financial Data Analysis Sample Diagram Presentation Slide
This is a financial data analysis sample diagram presentation slide. This is a four stage process. The stages in this process are finance, sales and marketing, operations, credit and risk.

