AI PPT Maker
Templates
PPT Bundles
Design Services
Business PPTs
Business Plan
Management
Strategy
Introduction PPT
Roadmap
Self Introduction
Timelines
Process
Marketing
Agenda
Technology
Medical
Startup Business Plan
Cyber Security
Dashboards
SWOT
Proposals
Education
Pitch Deck
Digital Marketing
KPIs
Project Management
Product Management
Artificial Intelligence
Target Market
Communication
Supply Chain
Google Slides
Research Services
 One Pagers
All Categories
-
Home
- Customer Favorites
- Financial Dashboard
Financial Dashboard

Sales Performance Dashboard Ppt PowerPoint Presentation Ideas Portfolio
This is a sales performance dashboard ppt powerpoint presentation ideas portfolio. This is a three stage process. The stages in this process are revenue, new customers, gross profit, customer satisfaction, sales comparison.
Modifying Banking Functionalities Dashboard Tracking Customer Activities And Revenue Generated Portrait PDF
This slide contains dashboard that will allow bank to track the customer activities in terms of new customer acquired, customer acquisition cost and overall revenue generated. Deliver and pitch your topic in the best possible manner with this enhancing financial institution operations dashboard tracking customer activities and revenue generated microsoft pdf. Use them to share invaluable insights on target, revenue, value, achievement and impress your audience. This template can be altered and modified as per your expectations. So, grab it now.
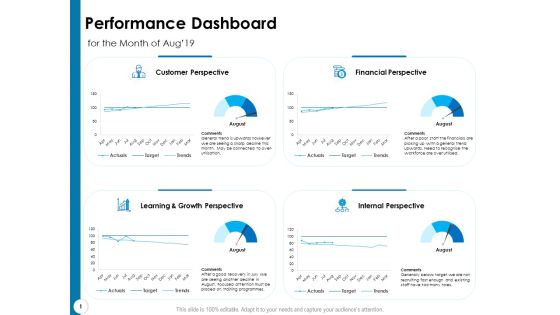
Strategy Execution Balanced Scorecard Performance Dashboard Elements PDF
Presenting this set of slides with name strategy execution balanced scorecard performance dashboard elements pdf. The topics discussed in these slides are customer perspective, financial perspective, internal perspective, learning and growth perspective. This is a completely editable PowerPoint presentation and is available for immediate download. Download now and impress your audience.
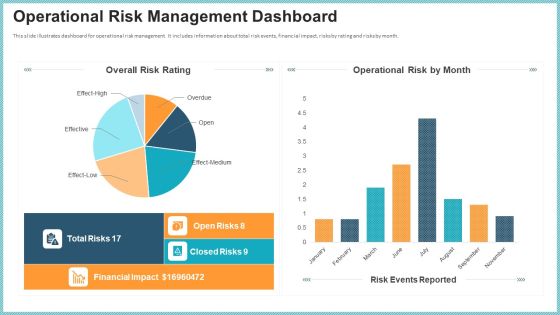
OP Risk Management Operational Risk Management Dashboard Formats PDF
This slide illustrates dashboard for operational risk management. It includes information about total risk events, financial impact, risks by rating and risks by month. Deliver an awe inspiring pitch with this creative op risk management operational risk management dashboard formats pdf bundle. Topics like operational risk management dashboard can be discussed with this completely editable template. It is available for immediate download depending on the needs and requirements of the user.

Dashboard Related To Logistic Company Date Introduction PDF
This slide shows the dashboard related to the ABC logistic company which includes order status, global financial performance, volume, inventory details, etc. Deliver and pitch your topic in the best possible manner with this dashboard related to logistic company date introduction pdf. Use them to share invaluable insights on dashboard related to logistic company and impress your audience. This template can be altered and modified as per your expectations. So, grab it now.

Performance Dashboard Template 2 Ppt PowerPoint Presentation Model Format
This is a performance dashboard template 2 ppt powerpoint presentation model format. This is a four stage process. The stages in this process are dashboard, finance, business, marketing.

Dashboard Reporting Excel Ppt PowerPoint Presentation Layouts Templates Cpb
This is a dashboard reporting excel ppt powerpoint presentation layouts templates cpb. This is a seven stage process. The stages in this process are dashboard reporting excel.
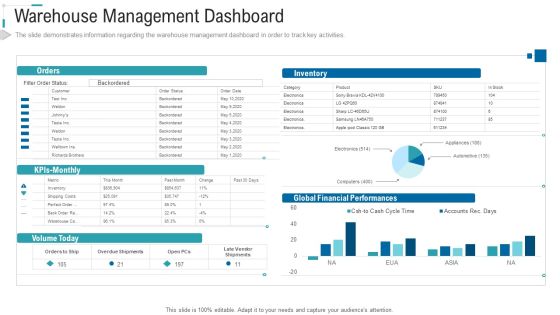
Inventory Stock Control Warehouse Management Dashboard Ppt Styles Images PDF
The slide demonstrates information regarding the warehouse management dashboard in order to track key activities. Deliver and pitch your topic in the best possible manner with this inventory stock control warehouse management dashboard ppt styles images pdf. Use them to share invaluable insights on kpls monthly, orders, inventory, global financial performances, volume today and impress your audience. This template can be altered and modified as per your expectations. So, grab it now.
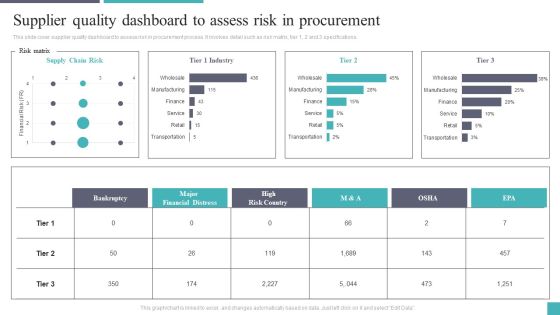
Supplier Quality Dashboard To Assess Risk In Procurement Demonstration PDF
This slide cover supplier quality dashboard to assess risk in procurement process. It involves detail such as risk matrix, tier 1, 2 and 3 specifications. Showcasing this set of slides titled Supplier Quality Dashboard To Assess Risk In Procurement Demonstration PDF. The topics addressed in these templates are Supply Chain Risk, Bankruptcy, Major Financial Distress. All the content presented in this PPT design is completely editable. Download it and make adjustments in color, background, font etc. as per your unique business setting.
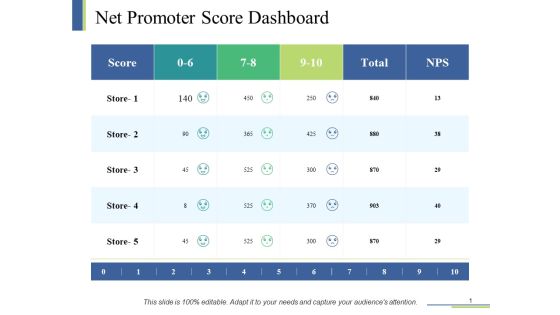
Net Promoter Score Dashboard Ppt PowerPoint Presentation Show Layout Ideas
This is a net promoter score dashboard ppt powerpoint presentation show layout ideas. This is a six stage process. The stages in this process are net promoter score dashboard, planning, management, marketing.

Dashboard Finance Ppt PowerPoint Presentation Infographic Template Graphic Tips
This is a dashboard finance ppt powerpoint presentation infographic template graphic tips. This is a three stage process. The stages in this process are dashboard, finance, analysis, business, investment.

Crm Dashboard Kpis Ppt PowerPoint Presentation Inspiration Brochure
This is a crm dashboard kpis ppt powerpoint presentation inspiration brochure. This is a three stage process. The stages in this process are acquisition, active subscribers, revenue.

Kpi Dashboard Ppt PowerPoint Presentation Infographic Template Grid
This is a kpi dashboard ppt powerpoint presentation infographic template grid. This is a five stage process. The stages in this process are outcasts, successful adverts, operations.
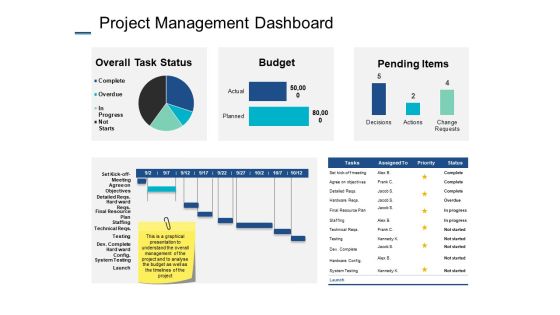
Project Management Dashboard Ppt PowerPoint Presentation Professional Images
This is a project management dashboard ppt powerpoint presentation professional images. This is a four stage process. The stages in this process are budget, finance, analysis, business, investment.

Decision Support Tools Sales Kpi Dashboard Ppt Slides
This is a decision support tools sales kpi dashboard ppt slides. This is a three stage process. The stages in this process are shapes, business, success.

Business Analysis Requirements Gathering Dashboard Diagram Ppt Example
This is a business analysis requirements gathering dashboard diagram ppt example. This is a five stage process. The stages in this process are business, marketing, presentation, success, management.

Gross Margin Improvement Bar Graph Dashboard Powerpoint Slide Download
This is a gross margin improvement bar graph dashboard powerpoint slide download. This is a two stage process. The stages in this process are chart title.

Sales Dashboard Slide Template 1 Ppt PowerPoint Presentation Layouts
This is a sales dashboard slide template 1 ppt powerpoint presentation layouts. This is a three stage process. The stages in this process are business, marketing, product, year.
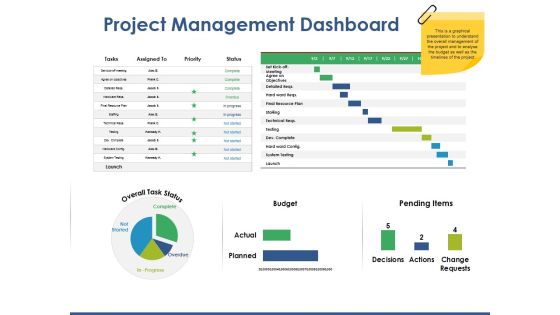
Project Management Dashboard Ppt PowerPoint Presentation Model Outline
This is a project management dashboard ppt powerpoint presentation model outline. This is a three stage process. The stages in this process are finance, business, analysis, marketing, management.
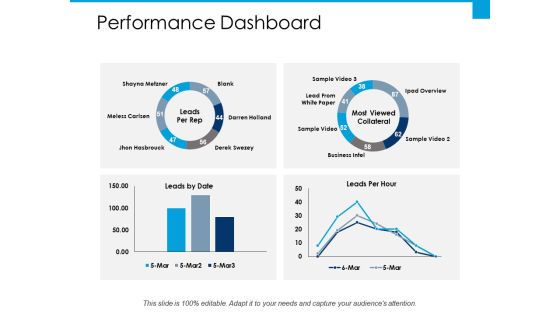
Performance Dashboard Ppt PowerPoint Presentation File Design Templates
This is a performance dashboard ppt powerpoint presentation file design templates. This is a four stage process. The stages in this process are percentage, product, management, marketing, business.
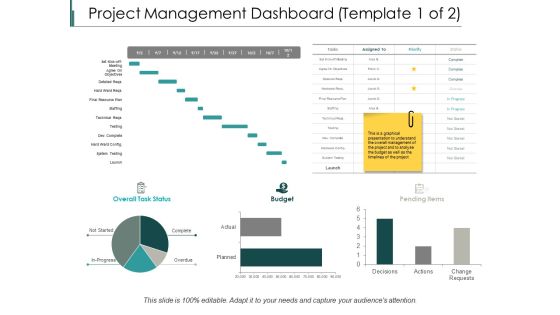
Project Management Dashboard Ppt PowerPoint Presentation Slides Styles
This is a project management dashboard ppt powerpoint presentation slides styles. This is a three stage process. The stages in this process are finance, analysis, business, investment, marketing.
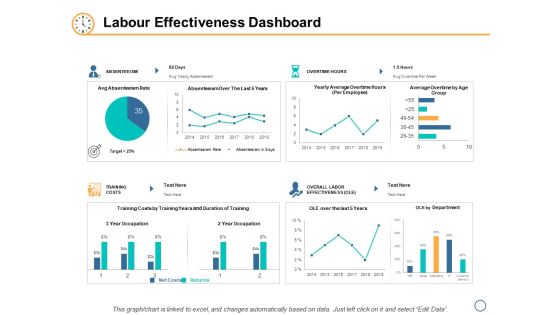
Labour Effectiveness Dashboard Ppt PowerPoint Presentation Inspiration Deck
This is a labour effectiveness dashboard ppt powerpoint presentation inspiration deck. This is a four stage process. The stages in this process are finance, analysis, business, investment, marketing.

Project Management Dashboard Ppt PowerPoint Presentation Model Pictures
This is a project management dashboard ppt powerpoint presentation model pictures. This is a four stage process. The stages in this process are finance, analysis, business, investment, marketing.
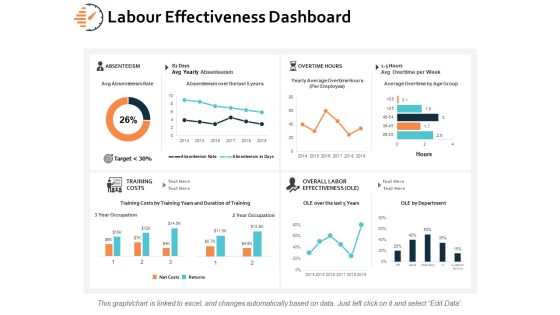
Labour Effectiveness Dashboard Ppt PowerPoint Presentation Model Objects
This is a labour effectiveness dashboard ppt powerpoint presentation model objects. This is a eight stage process. The stages in this process are finance, analysis, business, investment, marketing.

Dashboard Business Marketing Ppt Powerpoint Presentation Icon Maker
This is a dashboard business marketing ppt powerpoint presentation icon maker. This is a three stage process. The stages in this process are finance, marketing, management, investment, analysis.
Labour Effectiveness Dashboard Ppt PowerPoint Presentation Icon Vector
This is a labour effectiveness dashboard ppt powerpoint presentation icon vector.This is a three stage process. The stages in this process are finance, marketing, management, investment, analysis.
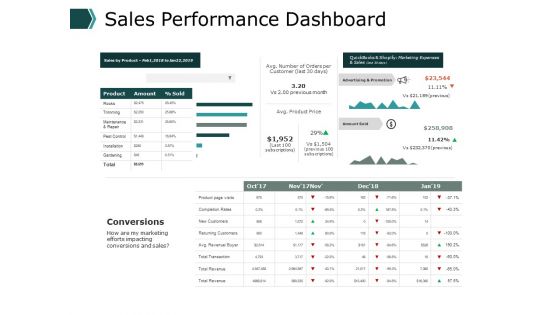
Sales Performance Dashboard Ppt PowerPoint Presentation Gallery Outline
This is a sales performance dashboard ppt powerpoint presentation gallery outline. This is a three stage process. The stages in this process are finance, marketing, management, investment, analysis.

Project Management Dashboard Ppt PowerPoint Presentation Show Portrait
This is a project management dashboard ppt powerpoint presentation show portrait. This is a three stage process. The stages in this process are finance, marketing, management, investment, analysis.

Dashboard Marketing Ppt Powerpoint Presentation Inspiration File Formats
This is a dashboard marketing ppt powerpoint presentation inspiration file formats. This is a four stage process. The stages in this process are finance, marketing, management, investment, analysis.

Quality Management Dashboard Ppt PowerPoint Presentation Outline Influencers
This is a quality management dashboard ppt powerpoint presentation outline influencers. This is a four stage process. The stages in this process are finance, marketing, management, investment, analysis.

Quality Management Dashboard Ppt PowerPoint Presentation File Diagrams
This is a quality management dashboard ppt powerpoint presentation file diagrams. This is a four stage process. The stages in this process are finance, marketing, management, investment, analysis.
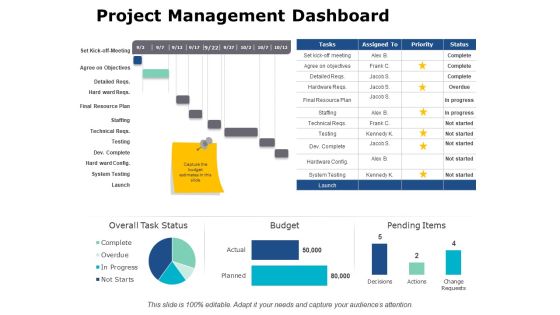
Project Management Dashboard Ppt PowerPoint Presentation Outline Designs
This is a project management dashboard ppt powerpoint presentation outline designs. This is a four stage process. The stages in this process are finance, analysis, business, investment, marketing.

Finance Metrics Dashboard Indicating Short Term Assets Download PDF
This graph or chart is linked to excel, and changes automatically based on data. Just left click on it and select edit data. Pitch your topic with ease and precision using this Finance Metrics Dashboard Indicating Short Term Assets Download PDF. This layout presents information on Short Term Assets, Global Financial Performance, Revenue YTD 2022. It is also available for immediate download and adjustment. So, changes can be made in the color, design, graphics or any other component to create a unique layout.

Credit Risk Assessment Dashboard Regulatory Parameters Microsoft PDF
This slide involves key parameters for assessing financial credit status of organization covering regulatory parameters, credit ratings and trend report etc.Showcasing this set of slides titled Credit Risk Assessment Dashboard Regulatory Parameters Microsoft PDF The topics addressed in these templates are Regulatory Parameters, Exposure By Credit Rating, Exposure By Sectors All the content presented in this PPT design is completely editable. Download it and make adjustments in color, background, font etc. as per your unique business setting.

Client Analytics Relationship Management Dashboard With Conversion Funnel Demonstration PDF
The following slide depicts the key performing areas in lead management. It includes traffic, potential customers, category wise closing percentages, financial insights etc. Pitch your topic with ease and precision using this Client Analytics Relationship Management Dashboard With Conversion Funnel Demonstration PDF. This layout presents information on Potential Customers, Social Media Followers, Social Media Subscribers. It is also available for immediate download and adjustment. So, changes can be made in the color, design, graphics or any other component to create a unique layout.
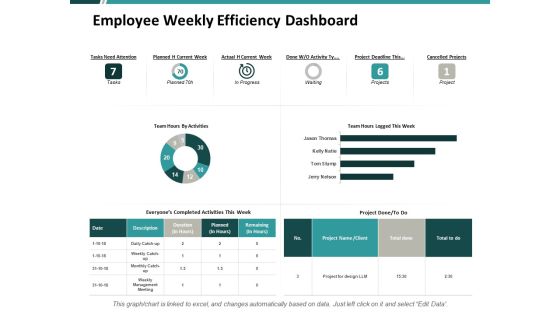
Employee Weekly Efficiency Dashboard Ppt PowerPoint Presentation Portfolio Show
This is a employee weekly efficiency dashboard ppt powerpoint presentation portfolio show. This is a three stage process. The stages in this process are financial, minimum, maximum, marketing, strategy.

Consumer Lending Procedure Credit Report Dashboard Ppt Ideas Portrait PDF
Presenting this set of slides with name consumer lending procedure credit report dashboard ppt ideas portrait pdf. This is a one stage process. The stages in this process are credit report dashboard. This is a completely editable PowerPoint presentation and is available for immediate download. Download now and impress your audience.

Successful Mobile Strategies For Business App Metrics Dashboard Microsoft PDF
Presenting successful mobile strategies for business app metrics dashboard microsoft pdf to provide visual cues and insights. Share and navigate important information on six stages that need your due attention. This template can be used to pitch topics like app metrics dashboard. In addtion, this PPT design contains high resolution images, graphics, etc, that are easily editable and available for immediate download.

Pharmaceutical Management KPI Metrics And Dashboard Ppt File Professional PDF
Presenting pharmaceutical management kpi metrics and dashboard ppt file professional pdf to provide visual cues and insights. Share and navigate important information on two stages that need your due attention. This template can be used to pitch topics like kpi metrics, kpi dashboards. In addition, this PPT design contains high-resolution images, graphics, etc, that are easily editable and available for immediate download.

International Logistics KPI Carrier Dashboard Icon Ppt Icon Gallery PDF
Presenting International Logistics KPI Carrier Dashboard Icon Ppt Icon Gallery PDF to dispense important information. This template comprises four stages. It also presents valuable insights into the topics including International Logistics, KPI Carrier, Dashboard Icon. This is a completely customizable PowerPoint theme that can be put to use immediately. So, download it and address the topic impactfully.

Iot Dashboard For Tracking Warehouse Pallets Diagrams PDF
Presenting Iot Dashboard For Tracking Warehouse Pallets Diagrams PDF to provide visual cues and insights. Share and navigate important information on ten stages that need your due attention. This template can be used to pitch topics like Iot Dashboard, Tracking Warehouse Pallets. In addtion, this PPT design contains high resolution images, graphics, etc, that are easily editable and available for immediate download.

Project Management Dashboard Ppt PowerPoint Presentation Summary Structure
This is a project management dashboard ppt powerpoint presentation summary structure. This is a five stage process. The stages in this process are overall task status, budget, pending items.
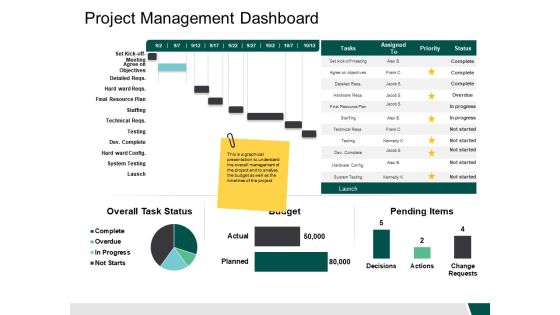
Project Management Dashboard Budget Ppt PowerPoint Presentation Slides Templates
This is a project management dashboard budget ppt powerpoint presentation slides templates. This is a two stage process. The stages in this process are finanace, management, strategy, analysis, marketing.
Key Business Metrics Dashboard Ppt Powerpoint Presentation Icon Graphics Design
This is a key business metrics dashboard ppt powerpoint presentation icon graphics design. This is a five stage process. The stages in this process are finance, marketing, management, investment, analysis.
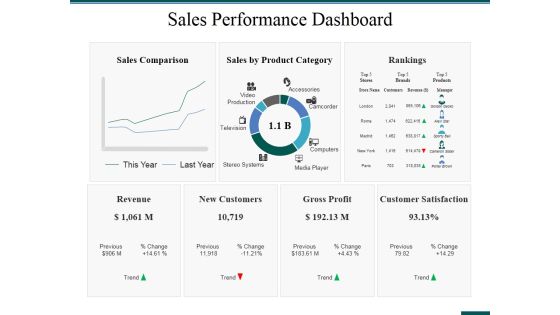
Sales Performance Dashboard Ppt PowerPoint Presentation Ideas Format Ideas
This is a sales performance dashboard ppt powerpoint presentation ideas format ideas. This is a three stage process. The stages in this process are rankings, revenue, new customers, gross profit, customer satisfaction.
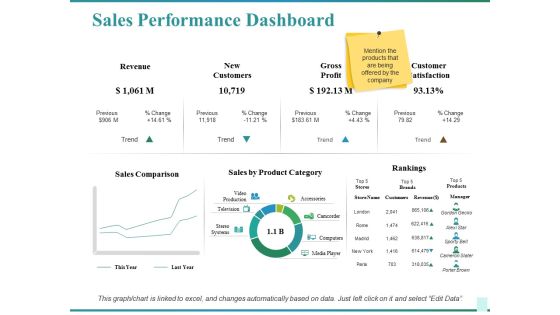
Sales Performance Dashboard Ppt PowerPoint Presentation Show Graphics Design
This is a sales performance dashboard ppt powerpoint presentation show graphics design. This is a two stage process. The stages in this process are sales comparison, sales by product category, rankings, customer satisfaction, revenue.
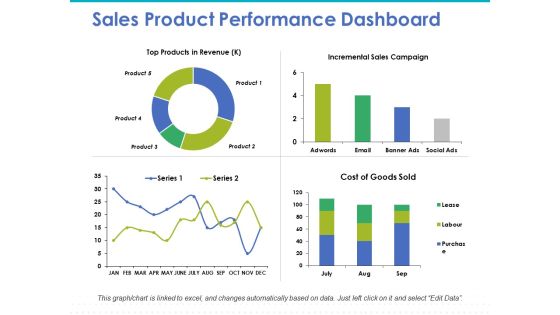
Sales Product Performance Dashboard Ppt PowerPoint Presentation Model Graphics Design
This is a sales product performance dashboard ppt powerpoint presentation model graphics design. This is a four stage process. The stages in this process are top products in revenue, incremental sales, cost of goods.

Sales Performance Dashboard Template Ppt PowerPoint Presentation Professional Elements
This is a sales performance dashboard template ppt powerpoint presentation professional elements. This is a eight stage process. The stages in this process are sales comparison, sales by product category, sales by month, brand profitability, revenue.

Company Sales And Performance Dashboard Ppt PowerPoint Presentation Show Structure
This is a company sales and performance dashboard ppt powerpoint presentation show structure. This is a four stage process. The stages in this process are year product sales, month growth in revenue, profit margins graph, year profits.
Income Balance Dashboard Indicator Vector Ppt PowerPoint Presentation Professional Diagrams
This is a income balance dashboard indicator vector ppt powerpoint presentation professional diagrams. This is a three stage process. The stages in this process are growth, increase sales, increase revenue.

Project Management Dashboard Ppt PowerPoint Presentation Portfolio Portrait
This is a project management dashboard ppt powerpoint presentation portfolio portrait. This is a five stage process. The stages in this process are overall task status, assigned to, budget, pending items, business.
Sales Activities Dashboard Ppt PowerPoint Presentation Icon Graphics
This is a sales activities dashboard ppt powerpoint presentation icon graphics. This is a two stage process. The stages in this process are business, finance, management, analysis, budget, actual.

Project Management Dashboard Ppt PowerPoint Presentation Portfolio Objects
This is a project management dashboard ppt powerpoint presentation portfolio objects. This is a three stage process. The stages in this process are complete, overdue, overall task status, budget, pending items.
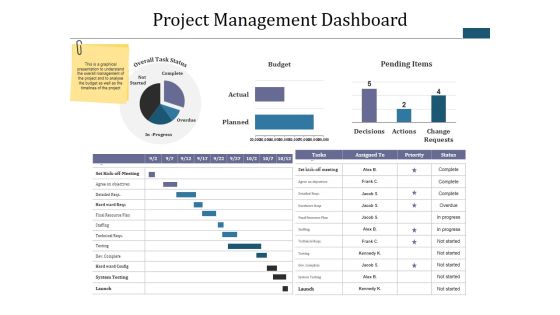
Project Management Dashboard Ppt PowerPoint Presentation Infographic Template Diagrams
This is a project management dashboard ppt powerpoint presentation infographic template diagrams. This is a three stage process. The stages in this process are budget, pending items, complete, overdue, not started.

Monthly Social Media Dashboard Ppt PowerPoint Presentation Model Slide
This is a monthly social media dashboard ppt powerpoint presentation model slide. This is a four stage process. The stages in this process are sales, social events, business, finance, key social metrics.
Monthly Social Media Dashboard Ppt PowerPoint Presentation Icon Gallery
This is a monthly social media dashboard ppt powerpoint presentation icon gallery. This is a two stage process. The stages in this process are facebook, social traffic and conversion, referral traffic, conversions, key social metrics, pinterest, you tube.
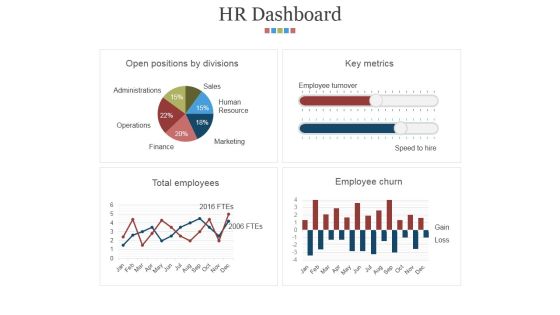
Hr Dashboard Template 2 Ppt PowerPoint Presentation Microsoft
This is a hr dashboard template 2 ppt powerpoint presentation microsoft. This is a four stage process. The stages in this process are open positions by divisions, key metrics, total employees, employee churn.
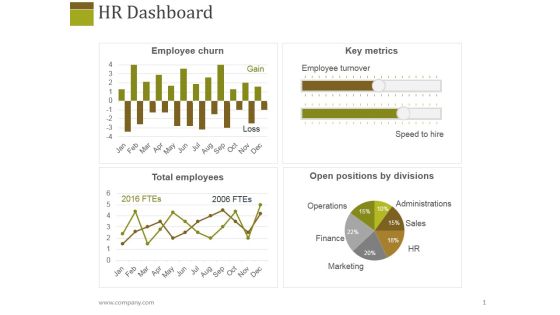
Hr Dashboard Template 1 Ppt PowerPoint Presentation Layouts Slideshow
This is a hr dashboard template 1 ppt powerpoint presentation layouts slideshow. This is a four stage process. The stages in this process are employee churn, key metrics, total employees, open positions by divisions.

Hr Dashboard Template 1 Ppt PowerPoint Presentation Outline Background Images
This is a hr dashboard template 1 ppt powerpoint presentation outline background images. This is a four stage process. The stages in this process are turnover rate, headcount flow, headcount, staffing trends.

Hr Dashboard Template 2 Ppt PowerPoint Presentation Layouts Graphics
This is a hr dashboard template 2 ppt powerpoint presentation layouts graphics. This is a four stage process. The stages in this process are turnover rate, headcount flow, headcount, staffing trends.

Performance Analysis Dashboard Icon For Email Communication Kpis Introduction PDF
Persuade your audience using this Performance Analysis Dashboard Icon For Email Communication Kpis Introduction PDF. This PPT design covers four stages, thus making it a great tool to use. It also caters to a variety of topics including Performance Analysis, Dashboard Icon, Email Communication, Kpis. Download this PPT design now to present a convincing pitch that not only emphasizes the topic but also showcases your presentation skills.
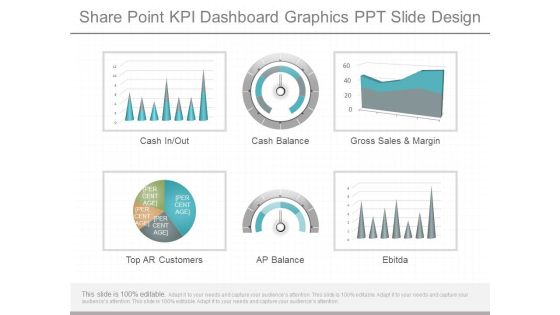
Share Point Kpi Dashboard Graphics Ppt Slide Design
This is a share point kpi dashboard graphics ppt slide design. This is a six stage process. The stages in this process are cash in out, cash balance, gross sales and margin, top ar customers, ap balance, ebitda.

Cpi Spi Dashboard Sample Diagram Powerpoint Slide Designs
This is a cpi spi dashboard sample diagram powerpoint slide designs. This is a four stage process. The stages in this process are cpi spi, performance summary, cost schedule variance, task matrix.

Lead Scoring Lead Nurturing Ideas Dashboard Ppt Sample Download
This is a lead scoring lead nurturing ideas dashboard ppt sample download. This is a four stage process. The stages in this process are adoption of lead scoring solutions chosen, number of dimensions, projects completed, number of scoring rules.

Crm Dashboard Current Lead Status Ppt PowerPoint Presentation Influencers
This is a crm dashboard current lead status ppt powerpoint presentation influencers. This is a five stage process. The stages in this process are new, assigned, process, converted, recycle.
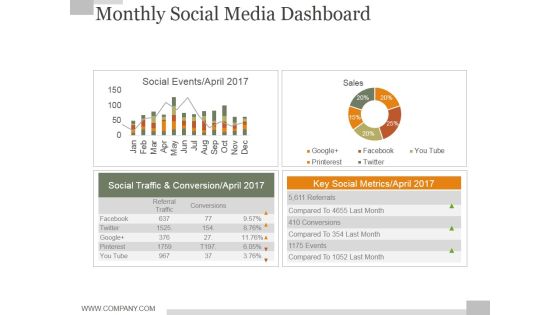
Monthly Social Media Dashboard Ppt PowerPoint Presentation Background Designs
This is a monthly social media dashboard ppt powerpoint presentation background designs. This is a four stage process. The stages in this process are business, finance, marketing, strategy, analysis, success.

Brand Performance Dashboard Template 2 Ppt PowerPoint Presentation Template
This is a brand performance dashboard template 2 ppt powerpoint presentation template. This is a five stage process. The stages in this process are marketing, business, social, icons, management.

Brand Performance Dashboard Template 2 Ppt PowerPoint Presentation Gallery
This is a brand performance dashboard template 2 ppt powerpoint presentation gallery. This is a two stage process. The stages in this process are business, finance, performance, location, strategy, success.

Crm Dashboard Current Lead Status Ppt PowerPoint Presentation Graphics
This is a crm dashboard current lead status ppt powerpoint presentation graphics. This is a six stage process. The stages in this process are carol doe, tom parker, peter smith, tony john, john clark.

Crm Dashboard Top Customers Ppt PowerPoint Presentation Styles Designs
This is a crm dashboard top customers ppt powerpoint presentation styles designs. This is a ten stage process. The stages in this process are business, customer, finance, bar graph, marketing, strategy, analysis.

Crm Sales Rep Dashboard Ppt PowerPoint Presentation Portfolio Graphics Download
This is a crm sales rep dashboard ppt powerpoint presentation portfolio graphics download. This is a three stage process. The stages in this process are actual vs goal, opportunities est close next 25 days, opp duration by pipeline.
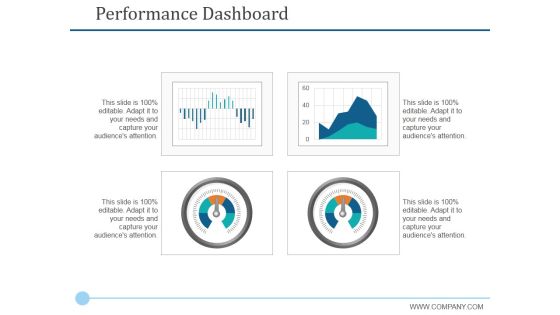
Performance Dashboard Template 2 Ppt PowerPoint Presentation Styles Graphics Tutorials
This is a performance dashboard template 2 ppt powerpoint presentation styles graphics tutorials. This is a four stage process. The stages in this process are finance, business, marketing, management.
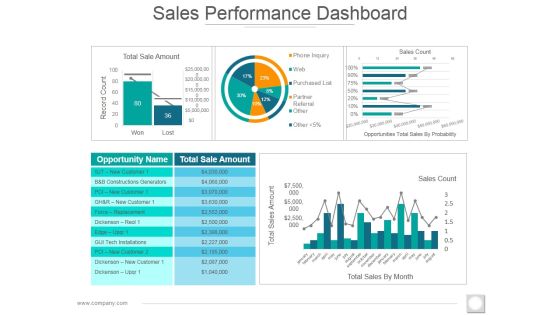
Sales Performance Dashboard Ppt PowerPoint Presentation Styles Images
This is a sales performance dashboard ppt powerpoint presentation styles images. This is a five stage process. The stages in this process are total sale amount, record count, sales count, total sales amount, total sales by month.

Monthly Social Media Dashboard Ppt PowerPoint Presentation Show Picture
This is a monthly social media dashboard ppt powerpoint presentation show picture. This is a four stage process. The stages in this process are business, finance, marketing, analysis, investment.

Change Management Performance Dashboard Ppt PowerPoint Presentation Layouts Master Slide
This is a change management performance dashboard ppt powerpoint presentation layouts master slide. This is a three stage process. The stages in this process are critical, high, low, medium, none.

Change Management Performance Dashboard Ppt PowerPoint Presentation Summary Background Image
This is a change management performance dashboard ppt powerpoint presentation summary background image. This is a three stage process. The stages in this process are high risk changes, average change, implementation time, emergency changes, average cost per change, change rejected.
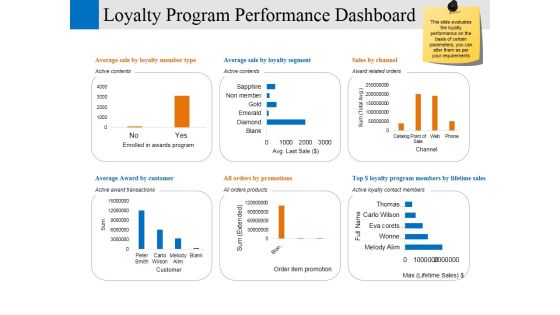
Loyalty Program Performance Dashboard Ppt PowerPoint Presentation Professional Model
This is a loyalty program performance dashboard ppt powerpoint presentation professional model. This is a six stage process. The stages in this process are enrolled in awards program, customer, order item promotion, channel, business.
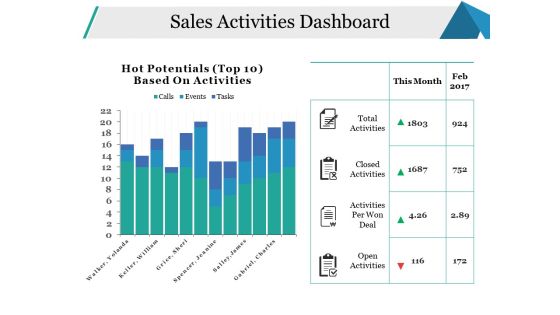
Sales Activities Dashboard Ppt PowerPoint Presentation Pictures Model
This is a sales activities dashboard ppt powerpoint presentation pictures model. This is a two stage process. The stages in this process are open activities, activities per won deal, closed activities, total activities, business.
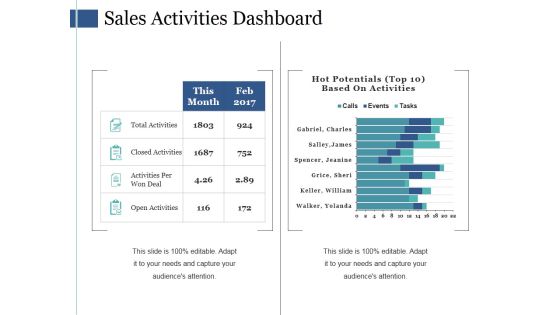
Sales Activities Dashboard Ppt PowerPoint Presentation Ideas Themes
This is a sales activities dashboard ppt powerpoint presentation ideas themes. This is a two stage process. The stages in this process are total activities, closed activities, activities per won deal, open activities.

Project Dashboard Ppt PowerPoint Presentation Ideas Graphic Tips
This is a project dashboard ppt powerpoint presentation ideas graphic tips. This is a one stage process. The stages in this process are business, marketing, objective, main focus, issues risks, key discussion items.

Sales Activities Dashboard Ppt PowerPoint Presentation Show Skills
This is a sales activities dashboard ppt powerpoint presentation show skills. This is a four stage process. The stages in this process are total activities, closed activities, activities per won deal, open activities, this month.

Sales Performance Dashboard Template Ppt PowerPoint Presentation Slides Example File
This is a sales performance dashboard template ppt powerpoint presentation slides example file. This is a eight stage process. The stages in this process are business, marketing, strategy, finance, planning.
Sales Performance Dashboard Ppt PowerPoint Presentation Professional Icons
This is a sales performance dashboard template ppt powerpoint presentation slides example file. This is a six stage process. The stages in this process are business, marketing, strategy, finance, planning.
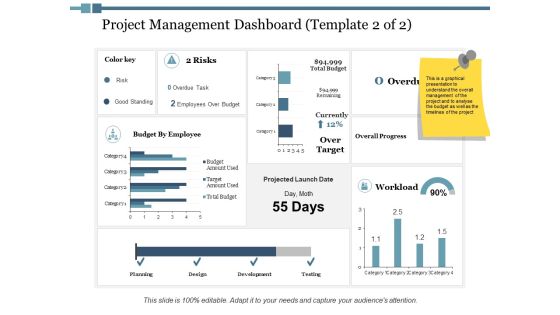
Project Management Dashboard Workload Ppt PowerPoint Presentation Inspiration Show
This is a project management dashboard workload ppt powerpoint presentation inspiration show. This is a four stage process. The stages in this process are finance, marketing, management, investment, analysis.

Change Management Performance Dashboard Ppt PowerPoint Presentation Professional Slides
This is a change management performance dashboard ppt powerpoint presentation professional slides. This is a three stage process. The stages in this process are finance, marketing, management, investment, analysis.
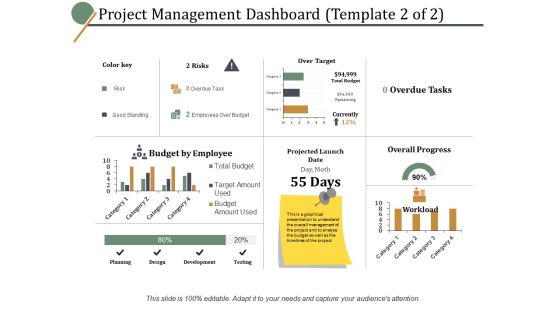
Project Management Dashboard Planning Ppt PowerPoint Presentation Ideas Graphics Design
This is a project management dashboard planning ppt powerpoint presentation ideas graphics design. This is a four stage process. The stages in this process are business, management, marketing, percentage.
Project Management Dashboard Testing Ppt PowerPoint Presentation Icon File Formats
This is a project management dashboard testing ppt powerpoint presentation icon file formats. This is a three stage process. The stages in this process are business, management, marketing, percentage.
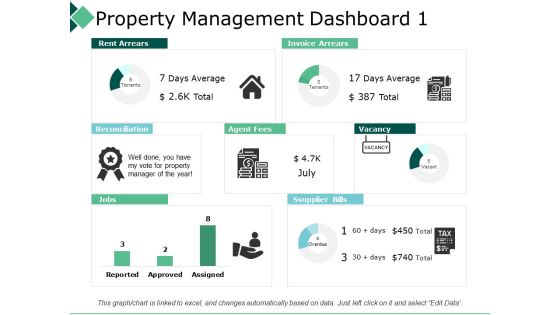
Property Management Dashboard 1 Reconciliation Ppt PowerPoint Presentation Professional Visuals
This is a property management dashboard 1 reconciliation ppt powerpoint presentation professional visuals. This is a three stage process. The stages in this process are business, management, strategy, analysis, icon.
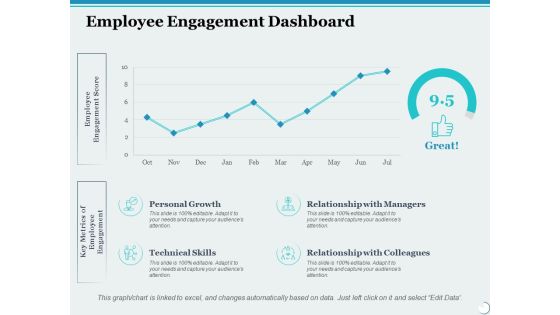
Employee Engagement Dashboard Ppt PowerPoint Presentation Inspiration Format
This is a employee engagement dashboard ppt powerpoint presentation inspiration format. This is a four stage process. The stages in this process are personal growth, relationship with managers, business, management, marketing.
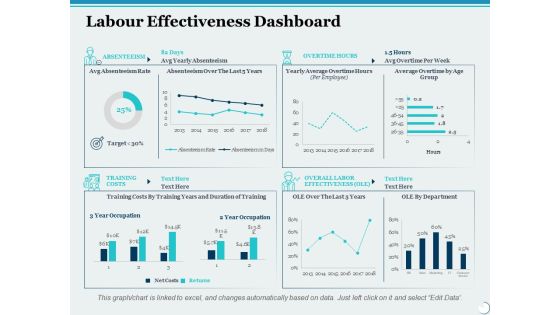
Labour Effectiveness Dashboard Ppt PowerPoint Presentation Slides File Formats
This is a labour effectiveness dashboard ppt powerpoint presentation slides file formats. This is a four stage process. The stages in this process are percentage, product, management, marketing, business.
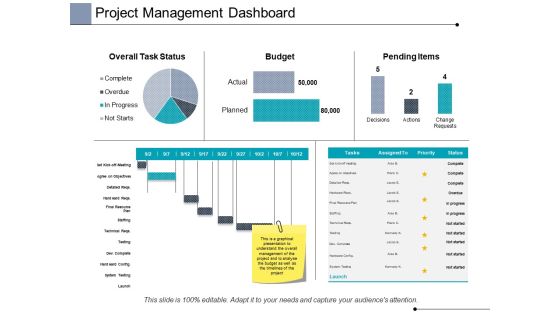
Project Management Dashboard Ppt PowerPoint Presentation Infographic Template Graphics
This is a project management dashboard ppt powerpoint presentation infographic template graphics. This is a three stage process. The stages in this process are finance, analysis, business, investment, marketing.
Project Management Dashboard Finance Ppt PowerPoint Presentation Styles Icons
This is a project management dashboard finance ppt powerpoint presentation styles icons. This is a three stage process. The stages in this process are finance, analysis, business, investment, marketing.

dashboard marketing business ppt powerpoint presentation gallery slide portrait
This is a dashboard marketing business ppt powerpoint presentation gallery slide portrait. This is a three stage process. The stages in this process are finance, marketing, management, investment, analysis.
Employee Engagement Dashboard Ppt PowerPoint Presentation Icon Shapes
This is a employee engagement dashboard ppt powerpoint presentation icon shapes. This is a four stage process. The stages in this process are personal growth, technical skills, marketing, planning, strategy.
Employee Weekly Efficiency Dashboard Ppt PowerPoint Presentation Icon Backgrounds
This is a employee weekly efficiency dashboard ppt powerpoint presentation icon backgrounds. This is a four stage process. The stages in this process are finance, analysis, business, investment, marketing.
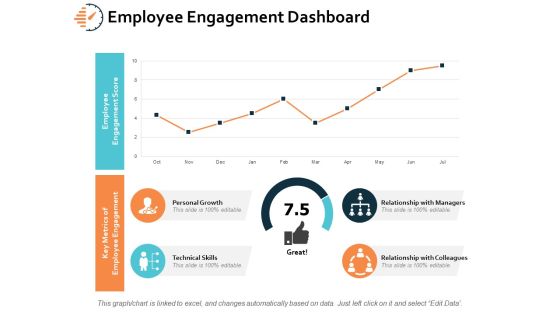
Employee Engagement Dashboard Ppt PowerPoint Presentation Layouts Inspiration
This is a employee engagement dashboard ppt powerpoint presentation layouts inspiration. This is a four stage process. The stages in this process are personal growth, technical skills, marketing, planning, strategy.
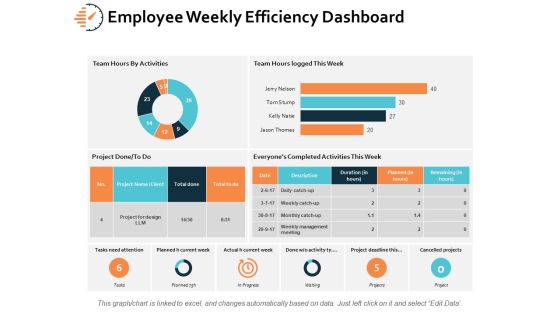
Employee Weekly Efficiency Dashboard Ppt PowerPoint Presentation Infographics Microsoft
This is a employee weekly efficiency dashboard ppt powerpoint presentation infographics microsoft. This is a six stage process. The stages in this process are finance, analysis, business, investment, marketing.
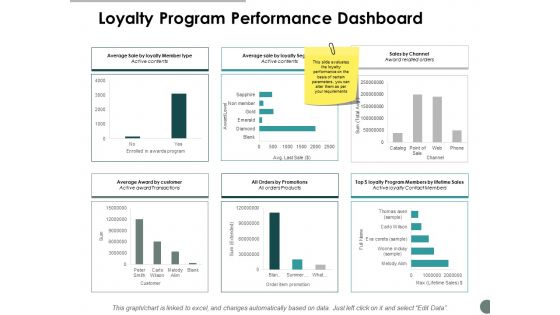
Loyalty Program Performance Dashboard Ppt Powerpoint Presentation Professional Templates
This is a loyalty program performance dashboard ppt powerpoint presentation professional templates. This is a six stage process. The stages in this process are finance, marketing, management, investment, analysis.

Employee Engagement Dashboard Ppt PowerPoint Presentation Professional File Formats
This is a employee engagement dashboard ppt powerpoint presentation professional file formats. This is a four stage process. The stages in this process are finance, marketing, management, investment, analysis.
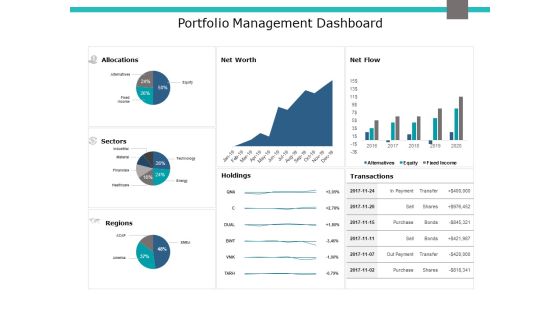
Portfolio Management Dashboard Ppt PowerPoint Presentation Gallery Example Introduction
This is a portfolio management dashboard ppt powerpoint presentation gallery example introduction. This is a three stage process. The stages in this process are area chart, finance, marketing, management, investment.

Marketing Management Dashboard Business Ppt PowerPoint Presentation Show Format
This is a marketing management dashboard business ppt powerpoint presentation show format. This is a four stage process. The stages in this process are finance, marketing, management, investment, analysis.

Marketing Management Dashboard Marketing Ppt PowerPoint Presentation Slides Graphics
This is a marketing management dashboard marketing ppt powerpoint presentation slides graphics. This is a three stage process. The stages in this process are finance, marketing, management, investment, analysis.
Marketing Management Dashboard Planning Ppt PowerPoint Presentation Layouts Icons
This is a marketing management dashboard planning ppt powerpoint presentation layouts icons. This is a four stage process. The stages in this process are finance, marketing, management, investment, analysis.

Marketing Management Dashboard Stratgegy Ppt PowerPoint Presentation Summary Samples
This is a marketing management dashboard stratgegy ppt powerpoint presentation summary samples. This is a four stage process. The stages in this process are finance, marketing, management, investment, analysis.

Marketing Management Dashboard Ppt PowerPoint Presentation Portfolio Layout Ideas
This is a marketing management dashboard ppt powerpoint presentation portfolio layout ideas. This is a four stage process. The stages in this process are finance, marketing, management, investment, analysis.
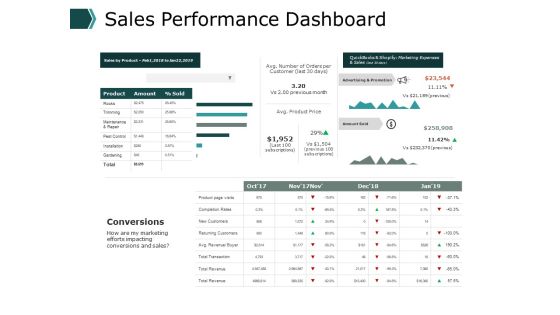
Sales Performance Dashboard Business Ppt PowerPoint Presentation Pictures Visuals
This is a sales performance dashboard business ppt powerpoint presentation pictures visuals . This is a three stage process. The stages in this process are finance, marketing, management, investment, analysis.

Inventory And Logistics Dashboard Ppt PowerPoint Presentation Gallery Clipart
This is a inventory and logistics dashboard ppt powerpoint presentation gallery clipart. This is a four stage process. The stages in this process are finance, marketing, management, investment, analysis.

Inventory Planning Kpi Dashboard Ppt PowerPoint Presentation Model Show
This is a inventory planning kpi dashboard ppt powerpoint presentation model show. This is a four stage process. The stages in this process are finance, marketing, management, investment, analysis.
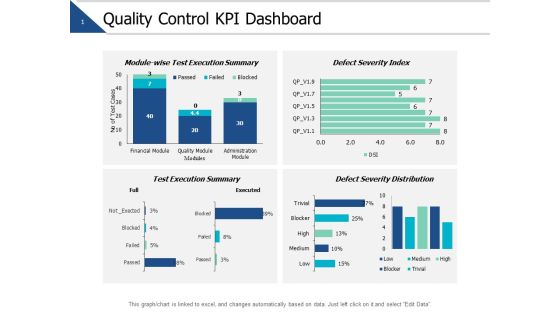
Quality Control Kpi Dashboard Ppt PowerPoint Presentation Show Portrait
This is a quality control kpi dashboard ppt powerpoint presentation show portrait. This is a four stage process. The stages in this process are finance, marketing, management, investment, analysis.
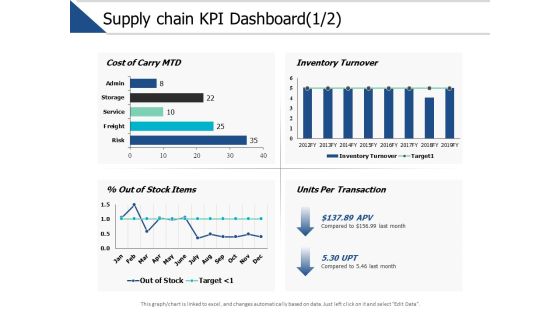
Supply Chain Kpi Dashboard Management Ppt PowerPoint Presentation Model Picture
This is a supply chain kpi dashboard management ppt powerpoint presentation model picture. This is a three stage process. The stages in this process are finance, marketing, management, investment, analysis.

Inventory And Logistics Dashboard Ppt PowerPoint Presentation Professional Styles
This is a inventory and logistics dashboard ppt powerpoint presentation professional styles. This is a four stage process. The stages in this process are finance, marketing, management, investment, analysis.

Inventory Planning Kpi Dashboard Ppt PowerPoint Presentation Summary Layout Ideas
This is a inventory planning kpi dashboard ppt powerpoint presentation summary layout ideas. This is a two stage process. The stages in this process are finance, marketing, management, investment, analysis.

Project Management Monthly Growth Dashboard Ppt PowerPoint Presentation Pictures Guide
This is a project management monthly growth dashboard ppt powerpoint presentation pictures guide. This is a four stage process. The stages in this process are finance, marketing, management, investment, analysis.

Quality Control Kpi Dashboard Ppt PowerPoint Presentation Slides Topics
This is a quality control kpi dashboard ppt powerpoint presentation slides topics. This is a four stage process. The stages in this process are finance, marketing, management, investment, analysis.
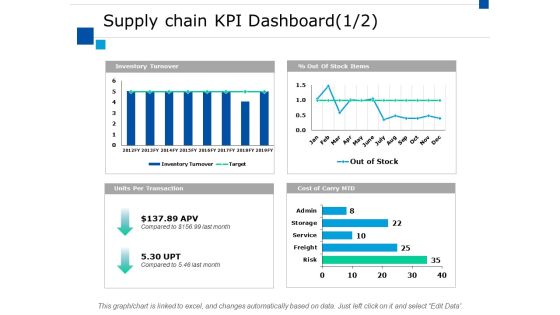
Supply Chain Kpi Dashboard Ppt PowerPoint Presentation Styles Clipart
This is a supply chain kpi dashboard ppt powerpoint presentation styles clipart. This is a four stage process. The stages in this process are finance, marketing, analysis, investment, million.
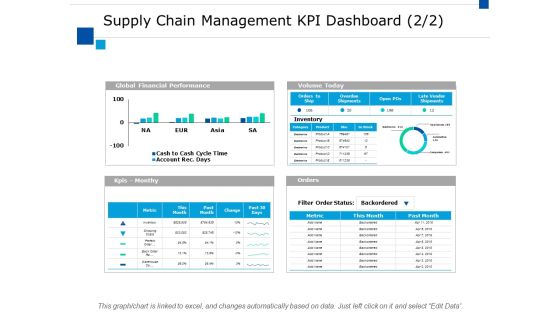
Supply Chain Management Kpi Dashboard Ppt PowerPoint Presentation File Slides
This is a supply chain management kpi dashboard ppt powerpoint presentation file slides. This is a four stage process. The stages in this process are finance, marketing, analysis, investment, million.

Loyalty Program Performance Dashboard Ppt Powerpoint Presentation Gallery Inspiration
This is a loyalty program performance dashboard ppt powerpoint presentation gallery inspiration. This is a six stage process. The stages in this process are finance, marketing, analysis, investment, strategy.

Logistics KPI Metrics And Analytics Dashboard Ppt Slides Images PDF
Persuade your audience using this Logistics KPI Metrics And Analytics Dashboard Ppt Slides Images PDF. This PPT design covers four stages, thus making it a great tool to use. It also caters to a variety of topics including Logistics KPI, Metrics And Analytics, Dashboard. Download this PPT design now to present a convincing pitch that not only emphasizes the topic but also showcases your presentation skills.

Customer Deal Tracking In Sales Pipeline Dashboard Topics PDF
This slide covers information regarding dashboard for tracking various customer deals in sales pipeline. Presenting Customer Deal Tracking In Sales Pipeline Dashboard Topics PDF to provide visual cues and insights. Share and navigate important information on four stages that need your due attention. This template can be used to pitch topics like Customer Conversion, Average, Customer Deal Tracking. In addtion, this PPT design contains high resolution images, graphics, etc, that are easily editable and available for immediate download.

ADC Cosmetics Company Dashboard With Variables Summary PDF
This slide shows a cosmetics and skin care sales dashboard with KPIs such as Profit Margin in 2021, Cross Selling Rate , Market Size , Stock Turnover Rate , Social Media Usage, Revenue etc. Presenting adc cosmetics company dashboard with variables summary pdf to provide visual cues and insights. Share and navigate important information on eight stages that need your due attention. This template can be used to pitch topics like profit margin, cross selling rate, market size, revenue, stock turnover rate. In addtion, this PPT design contains high resolution images, graphics, etc, that are easily editable and available for immediate download.
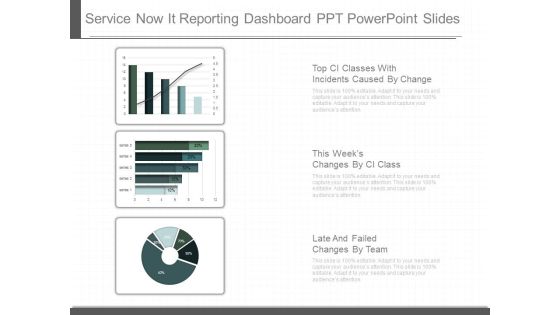
Service Now It Reporting Dashboard Ppt Powerpoint Slides
This is a service now it reporting dashboard ppt powerpoint slides. This is a three stage process. The stages in this process are top ci classes with incidents caused by change, this weeks changes by ci class, late and failed changes by team.

Loyalty Program Performance Dashboard Ppt PowerPoint Presentation Summary Grid
This is a loyalty program performance dashboard ppt powerpoint presentation summary grid. This is a six stage process. The stages in this process are average sale by loyalty member type, average award by customer, all orders by promotions, average sale by loyalty segment, sales by channel.

Appliances Energy And Cost Consumption Statistics Dashboard Download PDF
This graph or chart is linked to excel, and changes automatically based on data. Just left click on it and select edit data. Presenting Appliances Energy And Cost Consumption Statistics Dashboard Download PDF to dispense important information. This template comprises ten stages. It also presents valuable insights into the topics including Water Heater, Electric Vehicle, Pool Pump. This is a completely customizable PowerPoint theme that can be put to use immediately. So, download it and address the topic impactfully.

Optimizing Online Stores Customer Checkout Behavior KPI Dashboard Brochure PDF
This slide represents the dashboard to help management in analyzing the point at which customers leave the checkout process. It includes details related to KPIs such as shipping drop-off, payment drop-off etc. Slidegeeks is here to make your presentations a breeze with Optimizing Online Stores Customer Checkout Behavior KPI Dashboard Brochure PDF With our easy-to-use and customizable templates, you can focus on delivering your ideas rather than worrying about formatting. With a variety of designs to choose from, youre sure to find one that suits your needs. And with animations and unique photos, illustrations, and fonts, you can make your presentation pop. So whether youre giving a sales pitch or presenting to the board, make sure to check out Slidegeeks first.
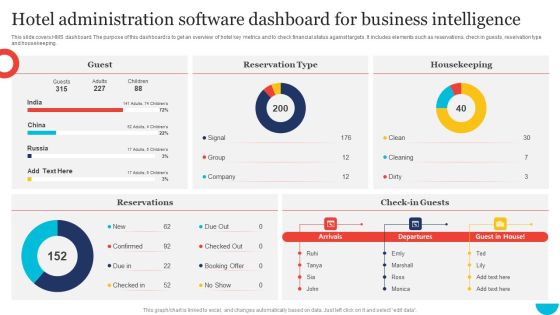
Hotel Administration Software Dashboard For Business Intelligence Infographics PDF
This slide covers HMS dashboard. The purpose of this dashboard is to get an overview of hotel key metrics and to check financial status against targets. It includes elements such as reservations, check in guests, reservation type and housekeeping. Pitch your topic with ease and precision using this Hotel Administration Software Dashboard For Business Intelligence Infographics PDF. This layout presents information on Guest, Housekeeping, Reservation Type. It is also available for immediate download and adjustment. So, changes can be made in the color, design, graphics or any other component to create a unique layout.
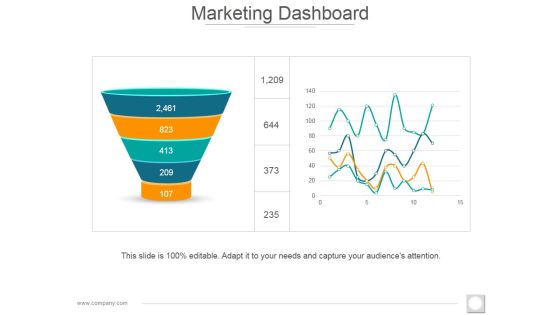
Marketing Dashboard Ppt PowerPoint Presentation Infographic Template Clipart
This is a marketing dashboard ppt powerpoint presentation infographic template clipart. This is a two stage process. The stages in this process are funnel, filter, step, business, marketing.
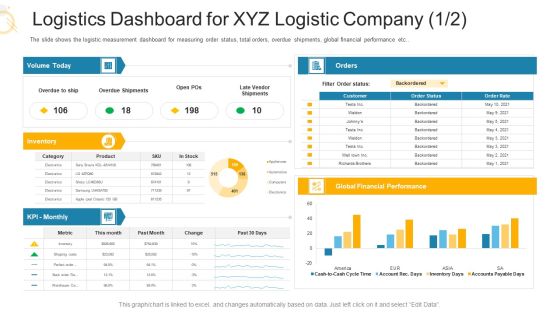
Logistics Dashboard For XYZ Logistic Company Performance Ppt Portfolio Slides PDF
The slide shows the logistic measurement dashboard for measuring order status, total orders, overdue shipments, global financial performance etc. Deliver an awe inspiring pitch with this creative logistics dashboard for XYZ logistic company performance ppt portfolio slides pdf bundle. Topics like financial performance, product, logistics dashboard for XYZ logistic company can be discussed with this completely editable template. It is available for immediate download depending on the needs and requirements of the user.
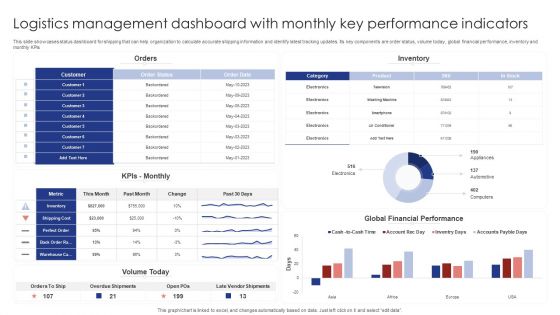
Logistics Management Dashboard With Monthly Key Performance Indicators Rules PDF
This slide showcases status dashboard for shipping that can help organization to calculate accurate shipping information and identify latest tracking updates. Its key components are order status, volume today, global financial performance, inventory and monthly KPIs. Pitch your topic with ease and precision using this Logistics Management Dashboard With Monthly Key Performance Indicators Rules PDF. This layout presents information on Orders, Inventory, Kpis Monthly. It is also available for immediate download and adjustment. So, changes can be made in the color, design, graphics or any other component to create a unique layout.

Business Sales And Revenue Summary Dashboard Brochure PDF
This slide exhibits sales report dashboards that provides information of sales activities and performance in financial year. It includes elements such as average weekly sales revenue, customer acquisition cost, customer lifetime value and sales target. Pitch your topic with ease and precision using this Business Sales And Revenue Summary Dashboard Brochure PDF. This layout presents information on Average Revenue, Customer Lifetime, Customer Acquisition. It is also available for immediate download and adjustment. So, changes can be made in the color, design, graphics or any other component to create a unique layout.
Gross Profit Margin Dashboard With Revenue Vs Expenses Icons PDF
This slide showcases dashboard that can help organization to evaluate the revenue generated and expenses incurred in conducting operations. It also showcases gross profit and margin of last financial year. Pitch your topic with ease and precision using this Gross Profit Margin Dashboard With Revenue Vs Expenses Icons PDF. This layout presents information on Gross Profit Margin, EBITDA Margin, Net Profit Margin. It is also available for immediate download and adjustment. So, changes can be made in the color, design, graphics or any other component to create a unique layout.
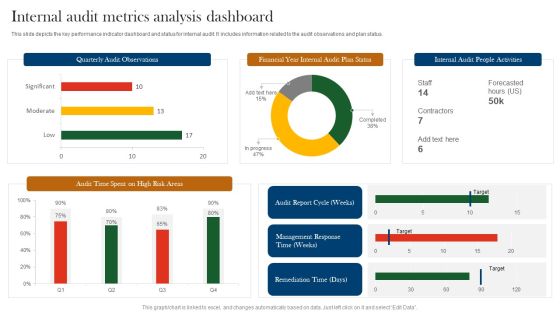
Internal Audit Metrics Analysis Dashboard Ppt Ideas Clipart Images PDF
This slide depicts the key performance indicator dashboard and status for internal audit. It includes information related to the audit observations and plan status. Pitch your topic with ease and precision using this Internal Audit Metrics Analysis Dashboard Ppt Ideas Clipart Images PDF. This layout presents information on Quarterly Audit Observations, Financial Year Internal, Audit Plan Status. It is also available for immediate download and adjustment. So, changes can be made in the color, design, graphics or any other component to create a unique layout.

Budget Vs Actual Dashboard For Finance Department Brochure PDF
The slide illustrates the dashboard showing the income and expenses incurred by the finance department. The purpose of this slide is compare the budgeted figures with the actual cost, enabling effective analysis of financial activities. It include income budget, expense budget, and difference. Showcasing this set of slides titled Budget Vs Actual Dashboard For Finance Department Brochure PDF. The topics addressed in these templates are Income, Expenses, Expense Budget. All the content presented in this PPT design is completely editable. Download it and make adjustments in color, background, font etc. as per your unique business setting.

Dashboard Showing Earning Potential From Corporate Trends Demonstration PDF
This slide illustrates facts and figures related to five years of corporate financial figures for evaluation of expected profit. It includes yearly revenue and EBITDA, PAT and PAT margin, net worth and return on net worth etc. Showcasing this set of slides titled Dashboard Showing Earning Potential From Corporate Trends Demonstration PDF. The topics addressed in these templates are Potential From Corporate Trends, Dashboard Showing Earning. All the content presented in this PPT design is completely editable. Download it and make adjustments in color, background, font etc. as per your unique business setting.
Leads Tracking Dashboard With Conversion Funnel Ideas PDF
This slide showcases dashboard that can help organization to identify the total number of customers acquired from the sales and marketing qualified lead. It also showcases financial KPIs that are cost per lead, cost per customer, customer lifetine value and return on marketing investment. Pitch your topic with ease and precision using this Leads Tracking Dashboard With Conversion Funnel Ideas PDF. This layout presents information on Audience, Prospects, Conversion Funnel. It is also available for immediate download and adjustment. So, changes can be made in the color, design, graphics or any other component to create a unique layout.
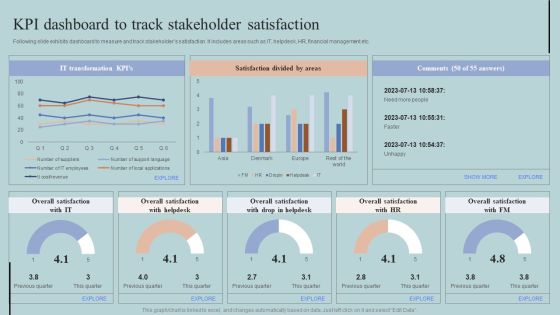
KPI Dashboard To Track Stakeholder Satisfaction Structure PDF
Following slide exhibits dashboard to measure and track stakeholders satisfaction. It includes areas such as IT, helpdesk, HR, financial management etc. The best PPT templates are a great way to save time, energy, and resources. Slidegeeks have 100 percent editable powerpoint slides making them incredibly versatile. With these quality presentation templates, you can create a captivating and memorable presentation by combining visually appealing slides and effectively communicating your message. Download KPI Dashboard To Track Stakeholder Satisfaction Structure PDF from Slidegeeks and deliver a wonderful presentation.
Sales Product Performance Dashboard Ppt PowerPoint Presentation Summary Icon
This is a sales product performance dashboard ppt powerpoint presentation infographics samples. This is a four stage process. The stages in this process are top products in revenue, incremental sales campaign, sales product performance, cost of goods sold.

Project Management Dashboard Ppt PowerPoint Presentation Outline Summary
This is a project management dashboard ppt powerpoint presentation outline summary. This is a three stage process. The stages in this process are overall task status, budget, pending items, complete, overdue.
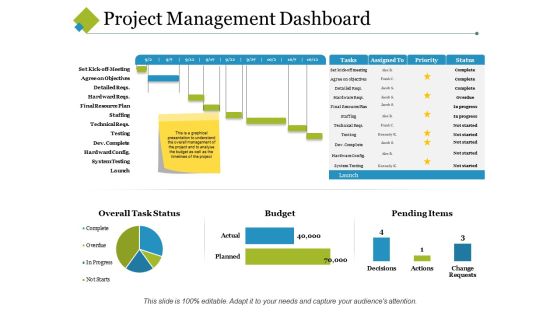
Project Management Dashboard Ppt PowerPoint Presentation Model Graphics Template
This is a project management dashboard ppt powerpoint presentation model graphics template. This is a four stage process. The stages in this process are assigned to, task, priority, cost, budget.
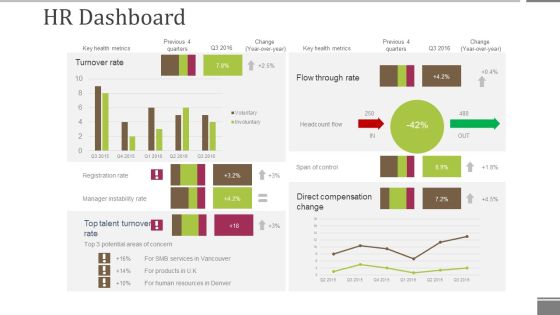
Hr Dashboard Template 2 Ppt PowerPoint Presentation File Grid
This is a hr dashboard template 2 ppt powerpoint presentation file grid. This is a four stage process. The stages in this process are turnover rate, direct compensation change, span of control, headcount flow, flow through rate.

Business Executive Summary KPI Dashboard For Year 2023 Graphics PDF
The following slide highlights the overall business performance for the financial year 2021 to assess variations and trace accuracy. It includes KPIs such as total income, expenditures, revenue and expense breakdown, fund structure etc. Pitch your topic with ease and precision using this Business Executive Summary KPI Dashboard For Year 2023 Graphics PDF. This layout presents information on Revenue Breakdown, Revenue Category, Expense Breakdown. It is also available for immediate download and adjustment. So, changes can be made in the color, design, graphics or any other component to create a unique layout.

Organizational Expense Management With Kpi Dashboard Slides PDF
The following slide highlights the key metrics to assess the organizational expenses and meet financial goals. It includes KPIs such as quarterly and annual business expense details, expenditure breakdown etc. Showcasing this set of slides titled Organizational Expense Management With Kpi Dashboard Slides PDF. The topics addressed in these templates are Annual Expenses, Expense Details, Expense Breakdown. All the content presented in this PPT design is completely editable. Download it and make adjustments in color, background, font etc. as per your unique business setting.
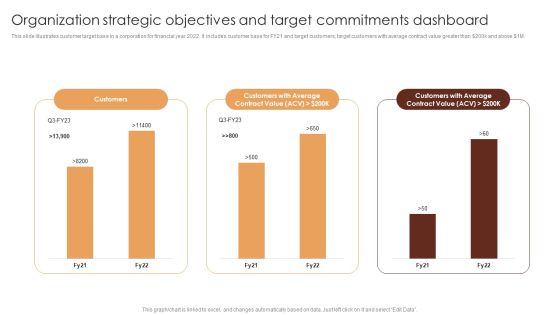
Organization Strategic Objectives And Target Commitments Dashboard Themes PDF
This slide illustrates customer target base in a corporation for financial year 2022. It includes customer base for FY21 and target customers, target customers with average contract value greater than dollar 200k and above dollar 1M. Pitch your topic with ease and precision using this Organization Strategic Objectives And Target Commitments Dashboard Themes PDF. This layout presents information on Customers Average, Contract Value, Customers. It is also available for immediate download and adjustment. So, changes can be made in the color, design, graphics or any other component to create a unique layout.
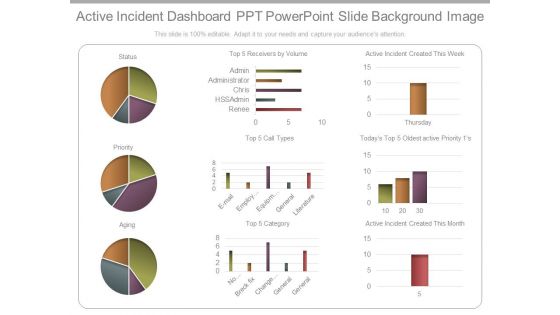
Active Incident Dashboard Ppt Powerpoint Slide Background Image
This is a active incident dashboard ppt powerpoint slide background image. This is a three stage process. The stages in this process are status, priority, aging, receivers by volume, renee, hssadmin, chris, administrator, admin, category, email, employee setup, equipment, general, literature, no category, breck fix, change management, general, active incident created this week, oldest active priority, active incident created this month, thursday.

Marketing And Advertising Analysis Dashboard Based On Demographic Data Demonstration PDF
This slide defines the dashboard analyzing the marketing and advertising based on demographic status. It includes information related to the impression gender, age and designated market area DMA. Showcasing this set of slides titled Marketing And Advertising Analysis Dashboard Based On Demographic Data Demonstration PDF. The topics addressed in these templates are Gender, Impressions, Demographic Data All the content presented in this PPT design is completely editable. Download it and make adjustments in color, background, font etc. as per your unique business setting.
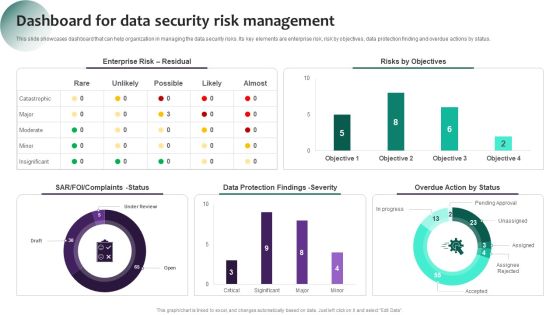
Information Systems Security And Risk Management Plan Dashboard For Data Security Risk Management Information PDF
This slide showcases dashboard that can help organization in managing the data security risks. Its key elements are enterprise risk, risk by objectives, data protection finding and overdue actions by status. If you are looking for a format to display your unique thoughts, then the professionally designed Information Systems Security And Risk Management Plan Dashboard For Data Security Risk Management Information PDF is the one for you. You can use it as a Google Slides template or a PowerPoint template. Incorporate impressive visuals, symbols, images, and other charts. Modify or reorganize the text boxes as you desire. Experiment with shade schemes and font pairings. Alter, share or cooperate with other people on your work. Download Information Systems Security And Risk Management Plan Dashboard For Data Security Risk Management Information PDF and find out how to give a successful presentation. Present a perfect display to your team and make your presentation unforgettable.

Software Implementation Strategy Digital Marketing Software Key Metrics Dashboard Template PDF
This slide represents the dashboard to track and measure the performance and efficiency of digital marketing software. It includes details related to KPIs such as social media followers, Facebook demographics etc. Crafting an eye catching presentation has never been more straightforward. Let your presentation shine with this tasteful yet straightforward Software Implementation Strategy Digital Marketing Software Key Metrics Dashboard Template PDF template. It offers a minimalistic and classy look that is great for making a statement. The colors have been employed intelligently to add a bit of playfulness while still remaining professional. Construct the idealSoftware Implementation Strategy Digital Marketing Software Key Metrics Dashboard Template PDF that effortlessly grabs the attention of your audience Begin now and be certain to wow your customers.
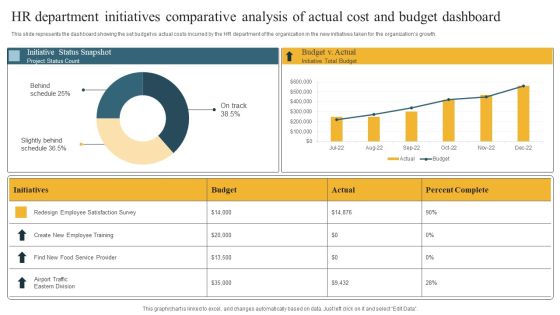
HR Department Initiatives Comparative Analysis Of Actual Cost And Budget Dashboard Introduction PDF
This slide represents the dashboard showing the set budget vs actual costs incurred by the HR department of the organization in the new initiatives taken for the organizations growth. Showcasing this set of slides titled HR Department Initiatives Comparative Analysis Of Actual Cost And Budget Dashboard Introduction PDF. The topics addressed in these templates are Behind Schedule, Slightly Behind Schedule, Initiative Status Snapshot. All the content presented in this PPT design is completely editable. Download it and make adjustments in color, background, font etc. as per your unique business setting.

Call Center Metrics Dashboard To Measure Customer Satisfaction Level Slides PDF
Mentioned slide outlines call center KPI dashboard which will assist various call centers to evaluate the customer satisfaction level. The critical KPIs mentioned in the template are total revenue earned, cost per support, average time taken to solve an issue etc. Showcasing this set of slides titled Call Center Metrics Dashboard To Measure Customer Satisfaction Level Slides PDF. The topics addressed in these templates are Total Revenue, Support Costs, Customer Satisfaction. All the content presented in this PPT design is completely editable. Download it and make adjustments in color, background, font etc. as per your unique business setting.

Call Center Metrics And Metrics Dashboard With Tickets Raised Graphics PDF
Mentioned slide outlines a KPI dashboard showcasing the call center performance. The metrics covered in the slide are total dropped calls, waiting calls, total calls, team performance, recurring calls, tickets raised. Showcasing this set of slides titled Call Center Metrics And Metrics Dashboard With Tickets Raised Graphics PDF. The topics addressed in these templates are Call Management Data, Monthly Statics, Performance Records. All the content presented in this PPT design is completely editable. Download it and make adjustments in color, background, font etc. as per your unique business setting.

KPI Dashboard To Assess Deals In Mergers And Acquisitions Strategy Rules PDF
Following slide showcases dashboard for mergers and acquisitions to measure effects of milestones to confirm integration plan accordingly. It presents information related to deals by types, country, etc. Pitch your topic with ease and precision using this KPI Dashboard To Assess Deals In Mergers And Acquisitions Strategy Rules PDF. This layout presents information on Status, Strategy, Minority Equity Stake. It is also available for immediate download and adjustment. So, changes can be made in the color, design, graphics or any other component to create a unique layout.
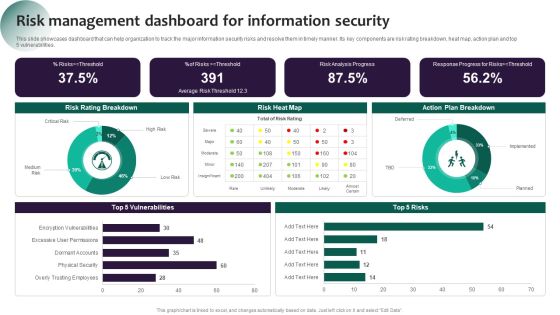
Information Systems Security And Risk Management Plan Risk Management Dashboard For Information Security Pictures PDF
This slide showcases dashboard that can help organization to track the major information security risks and resolve them in timely manner. Its key components are risk rating breakdown, heat map, action plan and top 5 vulnerabilities. The best PPT templates are a great way to save time, energy, and resources. Slidegeeks have 100 percent editable powerpoint slides making them incredibly versatile. With these quality presentation templates, you can create a captivating and memorable presentation by combining visually appealing slides and effectively communicating your message. Download Information Systems Security And Risk Management Plan Risk Management Dashboard For Information Security Pictures PDF from Slidegeeks and deliver a wonderful presentation.
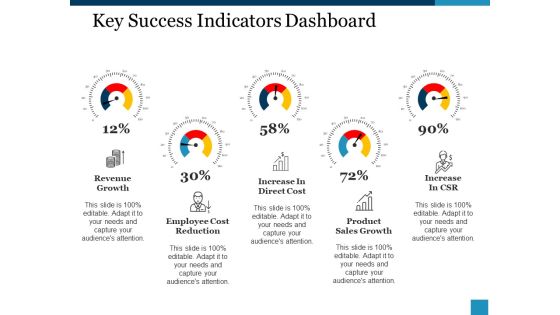
Key Success Indicators Dashboard Ppt PowerPoint Presentation Inspiration Guide
This is a key success indicators dashboard ppt powerpoint presentation inspiration guide. This is a five stage process. The stages in this process are revenue growth, increase in direct cost, increase in csr, employee cost reduction, product, sales growth.

Digital Transition Plan For Managing Business Dashboard Depicting Kpis To Track Sales Performance Guidelines PDF
This slide covers the dashboard that depicts metrics to track company sales performance that focuses on number of sales, cost breakdown, accumulated revenues, incremental sales, etc. Are you in need of a template that can accommodate all of your creative concepts This one is crafted professionally and can be altered to fit any style. Use it with Google Slides or PowerPoint. Include striking photographs, symbols, depictions, and other visuals. Fill, move around, or remove text boxes as desired. Test out color palettes and font mixtures. Edit and save your work, or work with colleagues. Download Digital Transition Plan For Managing Business Dashboard Depicting Kpis To Track Sales Performance Guidelines PDF and observe how to make your presentation outstanding. Give an impeccable presentation to your group and make your presentation unforgettable.
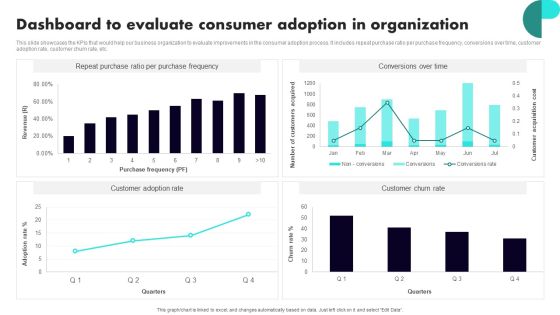
Implementing Client Onboarding Process Dashboard To Evaluate Consumer Adoption In Organization Diagrams PDF
This slide showcases the KPIs that would help our business organization to evaluate improvements in the consumer adoption process. It includes repeat purchase ratio per purchase frequency, conversions over time, customer adoption rate, customer churn rate, etc. Do you have an important presentation coming up Are you looking for something that will make your presentation stand out from the rest Look no further than Implementing Client Onboarding Process Dashboard To Evaluate Consumer Adoption In Organization Diagrams PDF. With our professional designs, you can trust that your presentation will pop and make delivering it a smooth process. And with Slidegeeks, you can trust that your presentation will be unique and memorable. So why wait Grab Implementing Client Onboarding Process Dashboard To Evaluate Consumer Adoption In Organization Diagrams PDF today and make your presentation stand out from the rest.

Analysis Plan For E Commerce Promotion Tactics Dashboard To Assess Social Posts Content Quality Sample PDF
This slide indicates the Dashboard to Assess Social Posts Content Quality. It provides information regarding the top published articles, story turnaround time, average number of comments per article and digital subscribers gained. This modern and well arranged Analysis Plan For E Commerce Promotion Tactics Dashboard To Assess Social Posts Content Quality Sample PDF provides lots of creative possibilities. It is very simple to customize and edit with the Powerpoint Software. Just drag and drop your pictures into the shapes. All facets of this template can be edited with Powerpoint no extra software is necessary. Add your own material, put your images in the places assigned for them, adjust the colors, and then you can show your slides to the world, with an animated slide included.
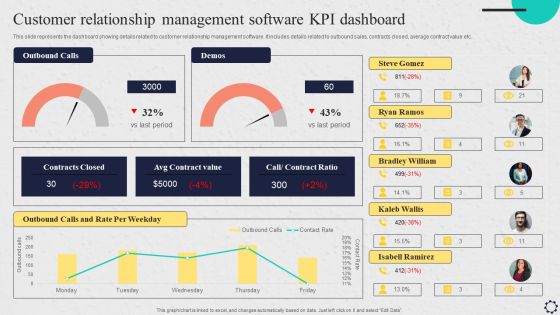
Software Implementation Strategy Customer Relationship Management Software Kpi Dashboard Clipart PDF
This slide represents the dashboard showing details related to customer relationship management software. It includes details related to outbound sales, contracts closed, average contract value etc. Are you in need of a template that can accommodate all of your creative concepts This one is crafted professionally and can be altered to fit any style. Use it with Google Slides or PowerPoint. Include striking photographs, symbols, depictions, and other visuals. Fill, move around, or remove text boxes as desired. Test out color palettes and font mixtures. Edit and save your work, or work with colleagues. Download Software Implementation Strategy Customer Relationship Management Software Kpi Dashboard Clipart PDF and observe how to make your presentation outstanding. Give an impeccable presentation to your group and make your presentation unforgettable.
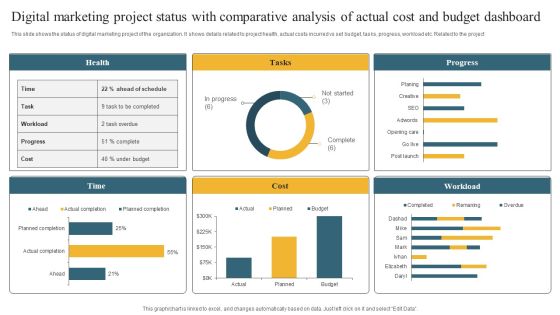
Digital Marketing Project Status With Comparative Analysis Of Actual Cost And Budget Dashboard Information PDF
This slide shows the status of digital marketing project of the organization. It shows details related to project health, actual costs incurred vs set budget, tasks, progress, workload etc. Related to the project Pitch your topic with ease and precision using this Digital Marketing Project Status With Comparative Analysis Of Actual Cost And Budget Dashboard Information PDF. This layout presents information on Health, Tasks, Progress. It is also available for immediate download and adjustment. So, changes can be made in the color, design, graphics or any other component to create a unique layout.
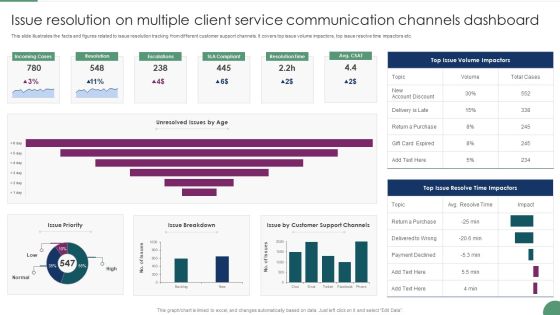
Issue Resolution On Multiple Client Service Communication Channels Dashboard Microsoft PDF
This slide illustrates the facts and figures related to issue resolution tracking from different customer support channels. It covers top issue volume impactors, top issue resolve time impactors etc. Pitch your topic with ease and precision using this Issue Resolution On Multiple Client Service Communication Channels Dashboard Microsoft PDF This layout presents information on Incoming Cases, Resolution, Escalations. It is also available for immediate download and adjustment. So, changes can be made in the color, design, graphics or any other component to create a unique layout.

Crm Dashboard Actual Vs Target Revenue Ppt PowerPoint Presentation Guidelines
This is a crm dashboard actual vs target revenue ppt powerpoint presentation guidelines. This is a three stage process. The stages in this process are actual, target.

Sales Dashboard Template 1 Ppt PowerPoint Presentation Samples
This is a sales dashboard template 1 ppt powerpoint presentation samples. This is a one stage process. The stages in this process are sales and percent growth of product, revenue, product, percent growth.
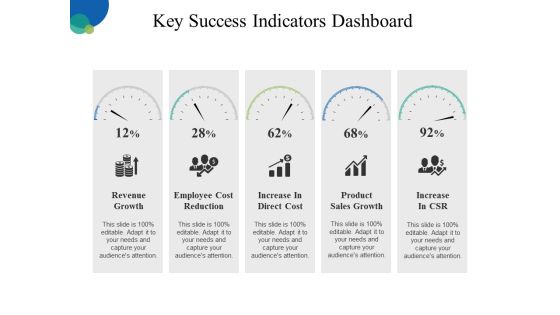
Key Success Indicators Dashboard Ppt PowerPoint Presentation Outline Slideshow
This is a key success indicators dashboard ppt powerpoint presentation outline slideshow. This is a five stage process. The stages in this process are revenue growth, employee cost reduction, increase in direct cost, product sales growth, increase in csr.

Co Variety Advertisement Partners Performance Assessment Dashboard Introduction PDF
This slide provides information regarding the dashboard for partners performance assessment in terms of revenue generated, etc. Presenting co variety advertisement partners performance assessment dashboard introduction pdf to provide visual cues and insights. Share and navigate important information on three stages that need your due attention. This template can be used to pitch topics like revenue generated, marketing progress, plan. In addition, this PPT design contains high-resolution images, graphics, etc, that are easily editable and available for immediate download.

ADC Cosmetics Company Dashboard With Variables Introduction PDF
This slide shows a cosmetics and skin care sales dashboard with KPIs such as Profit Margin in 2021, Cross Selling Rate, Market Size, Stock Turnover Rate, Social Media Usage, Revenue etc. Presenting adc cosmetics company dashboard with variables introduction pdf to provide visual cues and insights. Share and navigate important information on eight stages that need your due attention. This template can be used to pitch topics like profit margin, revenue, market size, social media, promotor score. In addition, this PPT design contains high-resolution images, graphics, etc, that are easily editable and available for immediate download.

Customer Attrition Rate Dashboard For IBN Outsourcing Company Infographics PDF
This slide shows a Customer Attrition Rate Dashboard with KPIs such as Company Revenue , Customer Attrition Rate in 2021 , Annual Growth Rate , Average Customer Queue Time , Onboarding Process Effectiveness etc. This is a customer attrition rate dashboard for ibn outsourcing company infographics pdf template with various stages. Focus and dispense information on eight stages using this creative set, that comes with editable features. It contains large content boxes to add your information on topics like company revenue, annual growth, customer satisfaction, onboarding process, service adoption. You can also showcase facts, figures, and other relevant content using this PPT layout. Grab it now.

Equity Capital Funding Dashboard Ppt Model Show PDF
Deliver an awe-inspiring pitch with this creative equity capital funding dashboard ppt model show pdf bundle. Topic like dashboard can be discussed with this completely editable template. It is available for immediate download depending on the needs and requirements of the user.

Bi Dashboard Design For Solutions Ppt Powerpoint Slides
This is a bi dashboard design for solutions ppt powerpoint slides. This is a four stage process. The stages in this process are total understand, total brands, total revenue, total sales.

Sales Highlights Ideas Analysis Dashboard Powerpoint Slide Ideas
This is a sales highlights ideas analysis dashboard powerpoint slide ideas. This is a four stage process. The stages in this process are lead sources revenue share, opportunities total sales by probability, total sale amount, total sales by month, opportunity name, total sale amount.
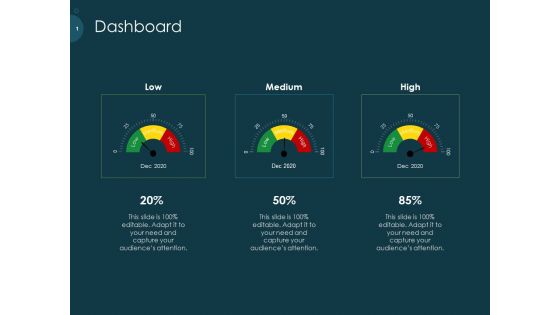
Raise Funding From Pre Seed Capital Dashboard Professional PDF
Showcasing this set of slides titled raise funding from pre seed capital dashboard professional pdf. The topics addressed in these templates is dashboard. All the content presented in this PPT design is completely editable. Download it and make adjustments in color, background, font etc. as per your unique business setting.
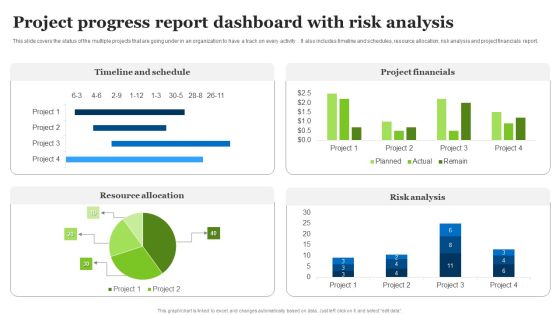
Project Progress Report Dashboard With Risk Analysis Ppt Examples PDF
This slide covers the status of the multiple projects that are going under in an organization to have a track on every activity . It also includes timeline and schedules, resource allocation, risk analysis and project financials report. Pitch your topic with ease and precision using this Project Progress Report Dashboard With Risk Analysis Ppt Examples PDF. This layout presents information on Timeline And Schedule, Project Financials, Risk Analysis. It is also available for immediate download and adjustment. So, changes can be made in the color, design, graphics or any other component to create a unique layout.
Modifying Banking Functionalities Dashboard Tracking Customer Retention Rate Partner Structure PDF
This slide contains dashboard that will allow bank to track the retention rate of customer within span of 6 months. Number of accounts that are successfully retained by the bank. It will also bank in tracking accounts that are cancelled. Deliver an awe inspiring pitch with this creative enhancing financial institution operations dashboard tracking customer retention rate partner introduction pdf bundle. Topics like dashboard tracking customer retention rate can be discussed with this completely editable template. It is available for immediate download depending on the needs and requirements of the user.

Funding Pitch Deck To Obtain Long Term Debt From Banks Business Statistics Related To Operations And Financial Statements Graphics PDF
This slide provides information about some of the company financial and operational details such as Revenue, Worldwide Monthly Users, Global Market Share, Data Centers, number of consumers globally etc. This is a funding pitch deck to obtain long term debt from banks business statistics related to operations and financial statements graphics pdf template with various stages. Focus and dispense information on one stage using this creative set, that comes with editable features. It contains large content boxes to add your information on topics like revenue, social media, net income, global market share, data centres worldwide. You can also showcase facts, figures, and other relevant content using this PPT layout. Grab it now.

Bar Chart With Magnifying Glass And Dollar Symbol For Financial Analysis Ppt PowerPoint Presentation File Structure PDF
Presenting this set of slides with name bar chart with magnifying glass and dollar symbol for financial analysis ppt powerpoint presentation file structure pdf. This is a one stage process. The stages in this process is bar chart with magnifying glass and dollar symbol for financial analysis. This is a completely editable PowerPoint presentation and is available for immediate download. Download now and impress your audience.

Dashboard Marketing Ppt PowerPoint Presentation Infographic Template Background Designs
Presenting this set of slides with name dashboard marketing ppt powerpoint presentation infographic template background designs. The topics discussed in these slides are financial, marketing, management, investment, analysis. This is a completely editable PowerPoint presentation and is available for immediate download. Download now and impress your audience.
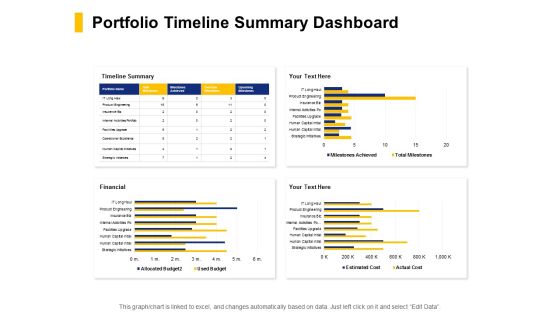
Portfolio Timeline Summary Dashboard Ppt PowerPoint Presentation Outline Themes
Presenting this set of slides with name portfolio timeline summary dashboard ppt powerpoint presentation outline themes. The topics discussed in these slides are strategic initiatives, financial, insurance biz, product engineering. This is a completely editable PowerPoint presentation and is available for immediate download. Download now and impress your audience.
Infrastructure KPI Dashboard Showing Resource Allocation Icons PDF
Deliver an awe-inspiring pitch with this creative infrastructure kpi dashboard showing resource allocation icons pdf bundle. Topics like project financial, resource allocation, delivery timeline, resources can be discussed with this completely editable template. It is available for immediate download depending on the needs and requirements of the user.
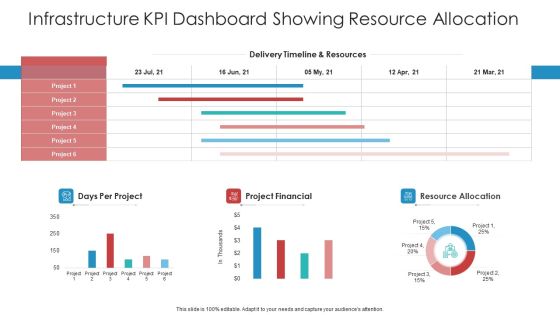
Infrastructure KPI Dashboard Showing Resource Allocation Themes PDF
Deliver an awe inspiring pitch with this creative infrastructure kpi dashboard showing resource allocation themes pdf bundle. Topics like days per project, project financial, resource allocation can be discussed with this completely editable template. It is available for immediate download depending on the needs and requirements of the user.

Assessing Stocks In Financial Market Relative Valuation Approach For Equity Research Ppt PowerPoint Presentation Ideas Graphics Tutorials PDF
Presenting this set of slides with name assessing stocks in financial market relative valuation approach for equity research ppt powerpoint presentation ideas graphics tutorials pdf. This is a three stage process. The stages in this process are market data, financial data, valuation. This is a completely editable PowerPoint presentation and is available for immediate download. Download now and impress your audience.
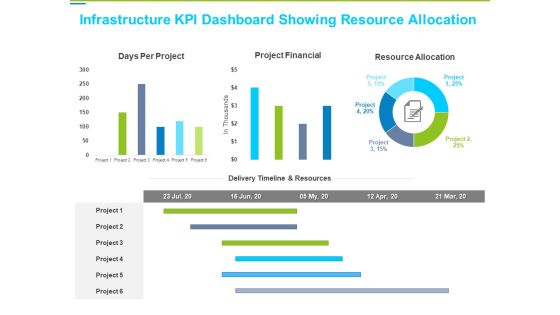
Framework Administration Infrastructure KPI Dashboard Showing Resource Allocation Brochure PDF
This is a framework administration infrastructure kpi dashboard showing resource allocation brochure pdf template with various stages. Focus and dispense information on six stages using this creative set, that comes with editable features. It contains large content boxes to add your information on topics like project financial, resource allocation, days per project. You can also showcase facts, figures, and other relevant content using this PPT layout. Grab it now.
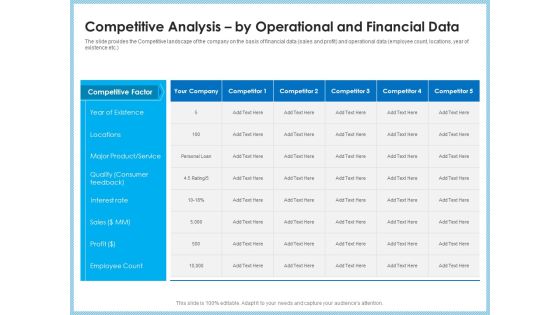
Investment Pitch To Generating Capital From Mezzanine Credit Competitive Analysis By Operational And Financial Data Inspiration PDF
The slide provides the Competitive landscape of the company on the basis of financial data sales and profit and operational data employee count, locations, year of existence etc. Deliver and pitch your topic in the best possible manner with this investment pitch to generating capital from mezzanine credit competitive analysis by operational and financial data inspiration pdf. Use them to share invaluable insights on competitive factor, year existence, locations, major product, service, quality consumer, interest rate and impress your audience. This template can be altered and modified as per your expectations. So, grab it now.

Investor Pitch Deck To Collect Capital From Subordinated Loan Competitive Analysis By Operational And Financial Data Diagrams PDF
The slide provides the Competitive landscape of the company on the basis of financial data sales and profit and operational data employee count, locations, year of existence etc. Deliver an awe-inspiring pitch with this creative investor pitch deck to collect capital from subordinated loan competitive analysis by operational and financial data diagrams pdf bundle. Topics like year existence, locations, major product service, interest rate, sales, employee count, profit can be discussed with this completely editable template. It is available for immediate download depending on the needs and requirements of the user.
