Financial Dashboard

Product Performance Dashboard Post Revenue Building Strategy Brochure PDF
Following slide outlines company product performance KPI dashboard post implementing revenue building strategy. The KPIs covered in the slide are revenue by different months, top five customers and products by revenue, MTD overview by different product lines etc. Showcasing this set of slides titled product performance dashboard post revenue building strategy brochure pdf. The topics addressed in these templates are revenue, target, profit margin. All the content presented in this PPT design is completely editable. Download it and make adjustments in color, background, font etc. as per your unique business setting.

Revenue Dashboard Of Digital Consultation Service Ppt Designs
This template shows the revenue generation dashboard of an online consulting business. The purpose of this slide is to measure the current and past revenue generation with new clients. It includes KPIs such as average comparison with revenue, CAC, etc. Pitch your topic with ease and precision using this Revenue Dashboard Of Digital Consultation Service Ppt Designs. This layout presents information on Revenue, Digital, Consultation. It is also available for immediate download and adjustment. So, changes can be made in the color, design, graphics or any other component to create a unique layout.

Business Revenue And Client Retention Analytics Dashboard Brochure PDF
This slide shows dashboard of service department of firm to make business decisions using customer analytics and covers essential KPIs of customer. It includes request answered, revenue, support cost, customer satisfaction and retention, average time to solve issue. Showcasing this set of slides titled Business Revenue And Client Retention Analytics Dashboard Brochure PDF. The topics addressed in these templates are Customer Satisfaction, Customer Retention, Revenue. All the content presented in this PPT design is completely editable. Download it and make adjustments in color, background, font etc. as per your unique business setting.

Client Support KPI Dashboard With Revenue Churn Information PDF
This slides shows dashboard which can be used by company to track revenue generated from customer service delivery. It includes KPIs such as customer churn, retention, MRP growth, etc. Showcasing this set of slides titled Client Support KPI Dashboard With Revenue Churn Information PDF. The topics addressed in these templates are Customer Churn, Loyal Customers, Premium Users. All the content presented in this PPT design is completely editable. Download it and make adjustments in color, background, font etc. as per your unique business setting.

E Commerce Project Planning And Revenue Management Dashboard Introduction PDF
The following slide highlights the ecommerce project planning and revenue management dashboard illustrating key headings which includes product and marketing channel plan, revenue and conversion rate by product, revenue by channel, conversion rate by channel and revenue by state. Showcasing this set of slides titled E Commerce Project Planning And Revenue Management Dashboard Introduction PDF. The topics addressed in these templates are New Customers, Ecommerce Revenue, Repeat Purchase Rate. All the content presented in this PPT design is completely editable. Download it and make adjustments in color, background, font etc. as per your unique business setting.

Revenue And Customer Acquisition Analysis Strategic Administration Dashboard Clipart PDF
This slide shows the dashboard representing analysis of the revenue and customers acquired by the organization. It shows comparison between current and previous year revenue and customer acquisition.Pitch your topic with ease and precision using this Revenue And Customer Acquisition Analysis Strategic Administration Dashboard Clipart PDF This layout presents information on Revenue Customer, Compared Previous, Customer Acquisition It is also available for immediate download and adjustment. So, changes can be made in the color, design, graphics or any other component to create a unique layout.
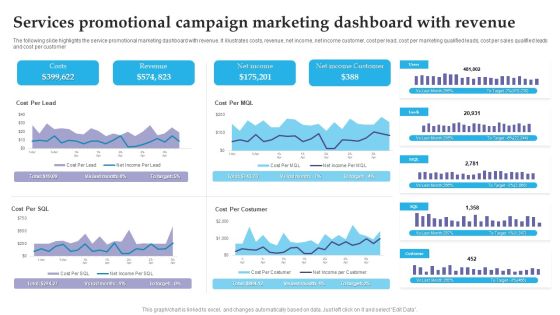
Services Promotional Campaign Marketing Dashboard With Revenue Brochure PDF
The following slide highlights the service promotional marketing dashboard with revenue. It illustrates costs, revenue, net income, net income customer, cost per lead, cost per marketing qualified leads, cost per sales qualified leads and cost per customer. Pitch your topic with ease and precision using this Services Promotional Campaign Marketing Dashboard With Revenue Brochure PDF. This layout presents information on Costs, Revenue, Net Income. It is also available for immediate download and adjustment. So, changes can be made in the color, design, graphics or any other component to create a unique layout.
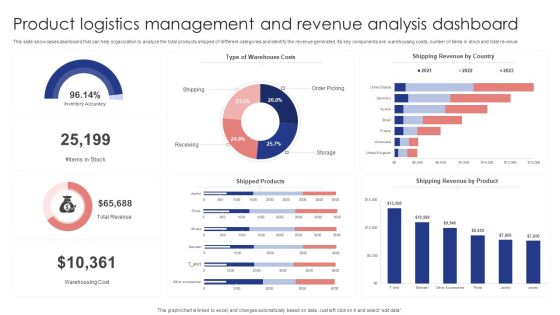
Product Logistics Management And Revenue Analysis Dashboard Demonstration PDF
This slide showcases dashboard that can help organization to analyze the total products shipped of different categories and identify the revenue generated. Its key components are warehousing costs, number of items in stock and total revenue. Pitch your topic with ease and precision using this Product Logistics Management And Revenue Analysis Dashboard Demonstration PDF. This layout presents information on Warehouse Costs, Shipping Revenue Country, Shipped Products . It is also available for immediate download and adjustment. So, changes can be made in the color, design, graphics or any other component to create a unique layout.

Dashboard Showcasing Business Revenue Target Vs Accomplishment Assessment Information PDF
This slide represents dashboard showcasing company revenue target vs achievement analysis which helps track business growth. It provides information regarding metrics such as monthly production targets, business revenue targets and generated, monthly budgeted cost and expenses per lead. Showcasing this set of slides titled Dashboard Showcasing Business Revenue Target Vs Accomplishment Assessment Information PDF. The topics addressed in these templates are Total Revenue, Target, Achievement. All the content presented in this PPT design is completely editable. Download it and make adjustments in color, background, font etc. as per your unique business setting.

Yearly Sales Assessment Dashboard With Total Revenue Introduction PDF
This slide represent annual sales review dashboard of various products sold by an organization through various selling platform with comparison and product wise revenue generated .It includes product, unit sold and total revenue. Showcasing this set of slides titled Yearly Sales Assessment Dashboard With Total Revenue Introduction PDF. The topics addressed in these templates are Product Sold, Inventory Outstanding, Average. All the content presented in this PPT design is completely editable. Download it and make adjustments in color, background, font etc. as per your unique business setting.

Order Logistics Management Dashboard With Revenue Generated Slides PDF
This slide showcases shipment tracking dashboard that can help company to track the status of order in real time and revenue earned in last quarter. It also includes no of orders and email feedback received. Showcasing this set of slides titled Order Logistics Management Dashboard With Revenue Generated Slides PDF. The topics addressed in these templates are Total Revenue, Emails Feedback, Orders Graph. All the content presented in this PPT design is completely editable. Download it and make adjustments in color, background, font etc. as per your unique business setting.

Omnichannel Marketing Dashboard With Revenue And Total Spend Structure PDF
This slide shows an Omnichannel Marketing Dashboard with marketing spend by channel, total spend, revenue, total impressions, cost per impression, weekly social media engagement by channel etc. Deliver and pitch your topic in the best possible manner with this omnichannel marketing dashboard with revenue and total spend structure pdf. Use them to share invaluable insights on marketing spend by channel, weekly engagement by channel, cost per impression and impress your audience. This template can be altered and modified as per your expectations. So, grab it now.

Annual Revenue And Cost Budget Deficit KPI Dashboard Ideas PDF
The following slide depicts the yearly budget variance to compare projected and actual results. It includes elements such as net income, service revenues, profit margin, payroll cost, cost of goods sold etc. Showcasing this set of slides titled Annual Revenue And Cost Budget Deficit KPI Dashboard Ideas PDF. The topics addressed in these templates are Cost Budget, Deficit KPI Dashboard. All the content presented in this PPT design is completely editable. Download it and make adjustments in color, background, font etc. as per your unique business setting.

Dashboard To Track Ecommerce Website Revenue And Traffic Rules PDF
This slide showcases dashboard that can help organization to track the traffic and revenue of ecommerce website. Its key elements are ecommerce conversion rate, average order value, performance by traffic source, top product, performance by device category. There are so many reasons you need a Dashboard To Track Ecommerce Website Revenue And Traffic Rules PDF. The first reason is you can not spend time making everything from scratch, Thus, Slidegeeks has made presentation templates for you too. You can easily download these templates from our website easily.
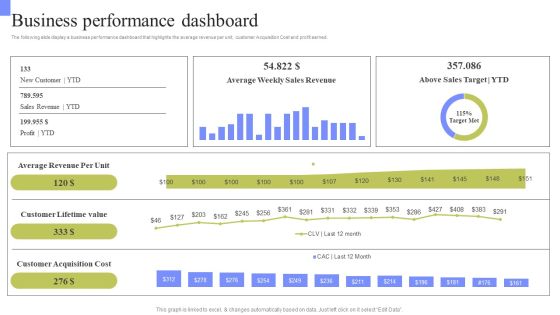
Periodic Revenue Model Business Performance Dashboard Rules PDF
The following slide display a business performance dashboard that highlights the average revenue per unit, customer Acquisition Cost and profit earned. This Periodic Revenue Model Business Performance Dashboard Rules PDF from Slidegeeks makes it easy to present information on your topic with precision. It provides customization options, so you can make changes to the colors, design, graphics, or any other component to create a unique layout. It is also available for immediate download, so you can begin using it right away. Slidegeeks has done good research to ensure that you have everything you need to make your presentation stand out. Make a name out there for a brilliant performance.
Project Metrics Dashboard With Revenues And Expenses Icons PDF
This slide shows the project management dashboard which covers the name, priorities, indicators and status which includes strategic priorities, research and development, administration, performance management, etc. With purchases in last 30 days and tasks. Showcasing this set of slides titled Project Metrics Dashboard With Revenues And Expenses Icons PDF. The topics addressed in these templates are Performance Management, Research And Development, Strategic Priorities. All the content presented in this PPT design is completely editable. Download it and make adjustments in color, background, font etc. as per your unique business setting.

6 Months Company Revenue Comparison Dashboard Graphics PDF
This slide showcases the half yearly profit comparison dashboard. It also includes comparison kp is such as monthly profit, profit margin growth, branch profit percentage, top 3 profitable products, etc. Showcasing this set of slides titled 6 Months Company Revenue Comparison Dashboard Graphics PDF. The topics addressed in these templates are Growth Rate, Overall Profit Margin, Branch Profit. All the content presented in this PPT design is completely editable. Download it and make adjustments in color, background, font etc. as per your unique business setting.
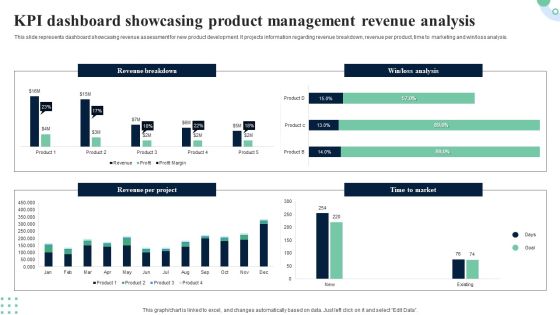
KPI Dashboard Showcasing Product Management Revenue Analysis Portrait PDF
This slide provides dashboard showcasing product development project overview with completion status. It provides information regarding cash flow statements, completion progress, project overview and product approval status. Pitch your topic with ease and precision using this KPI Dashboard Showcasing Product Management Revenue Analysis Portrait PDF. This layout presents information on Completion Progress, Product Approval Status, Cash Flow Statements. It is also available for immediate download and adjustment. So, changes can be made in the color, design, graphics or any other component to create a unique layout.
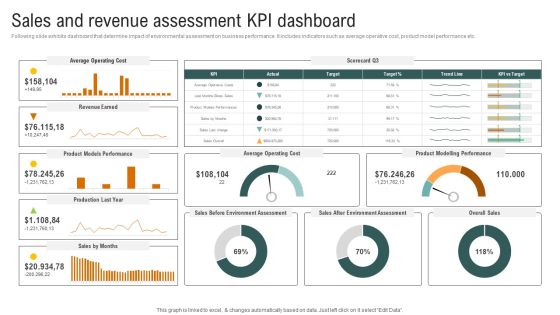
Sales And Revenue Assessment Kpi Dashboard Brochure PDF
Following slide exhibits dashboard that determine impact of environmental assessment on business performance. It includes indicators such as average operative cost, product model performance etc. If your project calls for a presentation, then Slidegeeks is your go-to partner because we have professionally designed, easy-to-edit templates that are perfect for any presentation. After downloading, you can easily edit Sales And Revenue Assessment Kpi Dashboard Brochure PDF and make the changes accordingly. You can rearrange slides or fill them with different images. Check out all the handy templates

Investment Crowdfunding Dashboard With Capital Raising Pitch Status Sample PDF
The following slide exhibits equity crowdfunding dashboard which can be used by business startups to check their capital raising pitch status. It includes information about investment, inventors, opportunities, live, valuation, target, raised, time left, etc.Presenting Investment Crowdfunding Dashboard With Capital Raising Pitch Status Sample PDF to dispense important information. This template comprises three stages. It also presents valuable insights into the topics including Total Investments, Total Investors, Current Opportunities. This is a completely customizable PowerPoint theme that can be put to use immediately. So, download it and address the topic impactfully.

ESG Data Reporting And Management Dashboard Download PDF
The following slide showcases a dashboard for tracking and managing data of economic, social and global goals. It provides information about ESG score breakdown by region, MV weight and MTD return by sector, fund vs. sector ESG score, lowest rated companies with MV weight over 1 percent, etc. Formulating a presentation can take up a lot of effort and time, so the content and message should always be the primary focus. The visuals of the PowerPoint can enhance the presenters message, so our ESG Data Reporting And Management Dashboard Download PDF was created to help save time. Instead of worrying about the design, the presenter can concentrate on the message while our designers work on creating the ideal templates for whatever situation is needed. Slidegeeks has experts for everything from amazing designs to valuable content, we have put everything into ESG Data Reporting And Management Dashboard Download PDF.

KPI Dashboard For Modernizing Hospitality Business Inspiration PDF
The following slide showcases dashboard to track data and perform analytics for managing staff, ordering supplies and to maintain customer satisfaction. It presents information related to expenses, sales, etc. Pitch your topic with ease and precision using this KPI Dashboard For Modernizing Hospitality Business Inspiration PDF. This layout presents information on Fiscal Year, Labor, Modernizing Hospitality. It is also available for immediate download and adjustment. So, changes can be made in the color, design, graphics or any other component to create a unique layout.

Ecommerce Data Driven Marketing Performance Analysis Dashboard Professional PDF
This slide represents the key metrics dashboard to track and analyze the performance of ecommerce business after implementing data driven marketing strategies. It includes details related to key metrics such as ecommerce revenue, new customers, repeat purchase rate etc. Get a simple yet stunning designed Ecommerce Data Driven Marketing Performance Analysis Dashboard Professional PDF. It is the best one to establish the tone in your meetings. It is an excellent way to make your presentations highly effective. So, download this PPT today from Slidegeeks and see the positive impacts. Our easy-to-edit Ecommerce Data Driven Marketing Performance Analysis Dashboard Professional PDF can be your go-to option for all upcoming conferences and meetings. So, what are you waiting for Grab this template today.

Prospective Buyer Retention Dashboard With Key Performance Indicators Themes PDF
This slide shows the dashboard representing the key performance metrics for retention of potential customers of the organization. It shows no. of active users, churn rate, cost of customer acquisition, their life time value, monthly recurring revenue etc.Pitch your topic with ease and precision using this Prospective Buyer Retention Dashboard With Key Performance Indicators Themes PDF. This layout presents information on Recurring Revenue, Revenue Growth, Customer Acquisition. It is also available for immediate download and adjustment. So, changes can be made in the color, design, graphics or any other component to create a unique layout.
Monthly Sales Performance Tracking And Monitoring Dashboard Diagrams PDF
This slide showcases a dashboard presenting various metrics to measure and analyze sales performance for revenue growth. It includes key components such as number of sales, revenue, profit, cost, sales revenue, sales increment, cost analysis and cross sell. Make sure to capture your audiences attention in your business displays with our gratis customizable Monthly Sales Performance Tracking And Monitoring Dashboard Diagrams PDF. These are great for business strategies, office conferences, capital raising or task suggestions. If you desire to acquire more customers for your tech business and ensure they stay satisfied, create your own sales presentation with these plain slides.
Monthly Sales Performance Tracking And Monitoring Dashboard Designs PDF
This slide showcases a dashboard presenting various metrics to measure and analyze sales performance for revenue growth. It includes key components such as number of sales, revenue, profit, cost, sales revenue, sales increment, cost analysis and cross sell. Make sure to capture your audiences attention in your business displays with our gratis customizable Monthly Sales Performance Tracking And Monitoring Dashboard Designs PDF. These are great for business strategies, office conferences, capital raising or task suggestions. If you desire to acquire more customers for your tech business and ensure they stay satisfied, create your own sales presentation with these plain slides.

Dashboard To Track Organizational Managing Business Cash Position Mockup PDF
This slide depicts a dashboard to track organizational cash flow management position and analyse the trends of cash flows. The key elements are revenue, cost of goods sold, operating expenses, capital expenses and cash flow from activities. Showcasing this set of slides titled Dashboard To Track Organizational Managing Business Cash Position Mockup PDF. The topics addressed in these templates are Revenue, Working Capital, Free Cash Flow. All the content presented in this PPT design is completely editable. Download it and make adjustments in color, background, font etc. as per your unique business setting.
Monthly Sales Performance Tracking And Monitoring Dashboard Sample PDF
This slide showcases a dashboard presenting various metrics to measure and analyze sales performance for revenue growth. It includes key components such as number of sales, revenue, profit, cost, sales revenue, sales increment, cost analysis and cross sell. Do you have to make sure that everyone on your team knows about any specific topic I yes, then you should give Monthly Sales Performance Tracking And Monitoring Dashboard Sample PDF a try. Our experts have put a lot of knowledge and effort into creating this impeccable Monthly Sales Performance Tracking And Monitoring Dashboard Sample PDF. You can use this template for your upcoming presentations, as the slides are perfect to represent even the tiniest detail. You can download these templates from the Slidegeeks website and these are easy to edit. So grab these today.
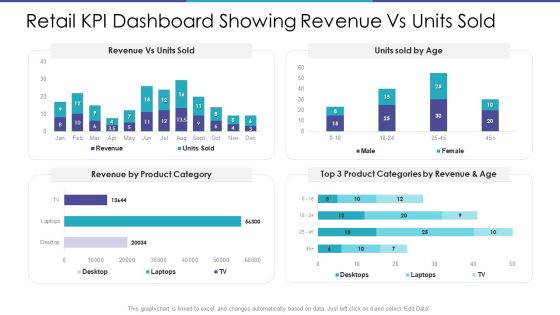
Retail KPI Dashboard Showing Revenue Vs Units Sold Guidelines PDF
Deliver and pitch your topic in the best possible manner with this retail kpi dashboard showing revenue vs units sold guidelines pdf. Use them to share invaluable insights on revenue vs units sold, revenue by product category and impress your audience. This template can be altered and modified as per your expectations. So, grab it now.
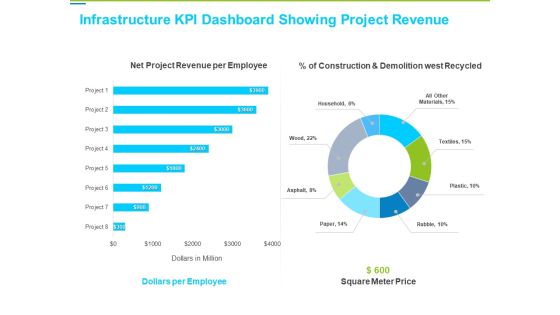
Framework Administration Infrastructure KPI Dashboard Showing Project Revenue Background PDF
Deliver an awe-inspiring pitch with this creative framework administration infrastructure kpi dashboard showing project revenue background pdf bundle. Topics like net project revenue per employee, dollars per employee, square meter price can be discussed with this completely editable template. It is available for immediate download depending on the needs and requirements of the user.

Customer Relationship Management Procedure CRM Application Dashboard Revenue Template PDF
Deliver and pitch your topic in the best possible manner with this customer relationship management procedure CRM application dashboard revenue template pdf. Use them to share invaluable insights on lead source, revenue this month, negotiation review, show me the deals by each stage, need analysis and impress your audience. This template can be altered and modified as per your expectations. So, grab it now.

Retail KPI Dashboard Showing Revenue Vs Units Sold Designs PDF
Deliver and pitch your topic in the best possible manner with this retail KPI dashboard showing revenue vs units sold designs pdf. Use them to share invaluable insights on revenue vs units sold, male female and impress your audience. This template can be altered and modified as per your expectations. So, grab it now.

CRM Application Dashboard Revenue Ppt Infographics Example File PDF
Deliver and pitch your topic in the best possible manner with this crm application dashboard revenue ppt infographics example file pdf. Use them to share invaluable insights on source, analysis, price and impress your audience. This template can be altered and modified as per your expectations. So, grab it now.
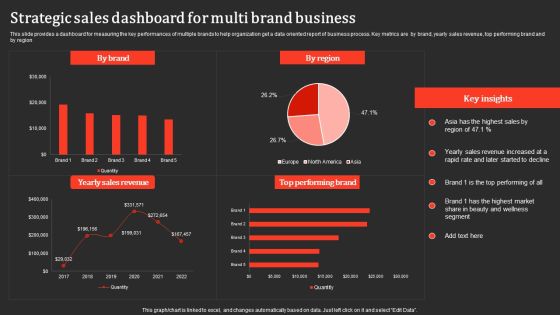
Strategic Sales Dashboard For Multi Brand Business Professional PDF
This slide provides a dashboard for measuring the key performances of multiple brands to help organization get a data oriented report of business process. Key metrics are by brand, yearly sales revenue, top performing brand and by region. Pitch your topic with ease and precision using this Strategic Sales Dashboard For Multi Brand Business Professional PDF. This layout presents information on Yearly Sales Revenue, Performing Brand. It is also available for immediate download and adjustment. So, changes can be made in the color, design, graphics or any other component to create a unique layout.

Dashboard Tracking Essential Kpis For Ecommerce Performance Slides PDF
This slide provides information regarding essential KPIs for ecommerce performance dashboard tracking average bounce rate, new vs. old customers, channel revenue vs. channel acquisitions costs, channel revenue vs. sales, average conversion rate, etc. Deliver an awe inspiring pitch with this creative Dashboard Tracking Essential Kpis For Ecommerce Performance Slides PDF bundle. Topics like Average Bounce Rate, Channel Acquisition Costs, Channel Revenue can be discussed with this completely editable template. It is available for immediate download depending on the needs and requirements of the user.

Business Key Performance Metrics Review Dashboard Portrait PDF
The following slide shows a dashboard of sales strategy review of firm that can be used by marketing, product, finance managers for reviewing the business. It further includes KPI that are revenue, new customer, gross profit purchaser satisfaction, income comparison, sales categories and profitability. Showcasing this set of slides titled Business Key Performance Metrics Review Dashboard Portrait PDF. The topics addressed in these templates are Sales, Revenue Comparison, Profitability. All the content presented in this PPT design is completely editable. Download it and make adjustments in color, background, font etc. as per your unique business setting.

Ecommerce Marketing Activities KPI Dashboard To Analyse Performance Guidelines PDF
This slide covers ecommerce marketing KPI dashboard to track performance. It involves details such as ecommerce revenue generated, number of new customers, repeat buying rate, attribute revenue and conversion rate and attributed revenue and conversion rate by marketing channel.Pitch your topic with ease and precision using this Ecommerce Marketing Activities KPI Dashboard To Analyse Performance Guidelines PDF. This layout presents information on Revenue Generated, Ecommerce Revenue, Generate Conversion. It is also available for immediate download and adjustment. So, changes can be made in the color, design, graphics or any other component to create a unique layout.
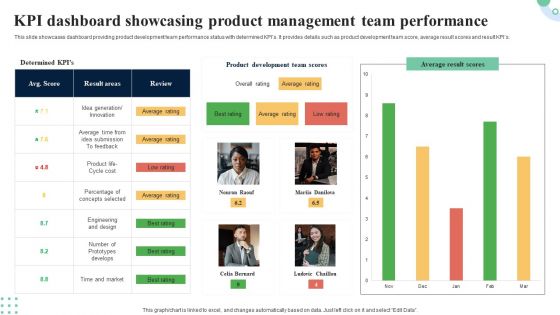
KPI Dashboard Showcasing Product Management Team Performance Demonstration PDF
This slide represents dashboard showcasing revenue assessment for new product development. It projects information regarding revenue breakdown, revenue per product, time to marketing and win or loss analysis. Showcasing this set of slides titled KPI Dashboard Showcasing Product Management Team Performance Demonstration PDF. The topics addressed in these templates are Revenue Per Project, Revenue Breakdown, Loss Analysis. All the content presented in this PPT design is completely editable. Download it and make adjustments in color, background, font etc. as per your unique business setting.

Assessment Of Fixed Assets Fixed Asset Dashboard Cost Portrait PDF
Presenting this set of slides with name assessment of fixed assets fixed asset dashboard cost portrait pdf. The topics discussed in these slides are fixed assets, value, fiscal year. This is a completely editable PowerPoint presentation and is available for immediate download. Download now and impress your audience.
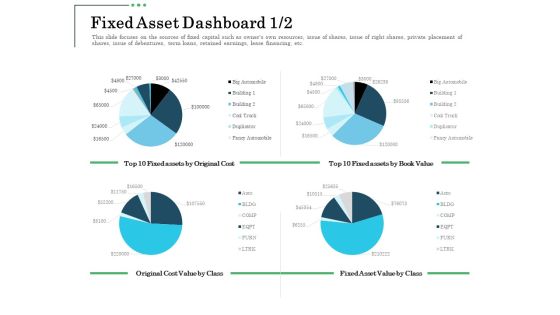
Non Current Assets Reassessment Fixed Asset Dashboard Cost Mockup PDF
Presenting this set of slides with name non current assets reassessment fixed asset dashboard cost mockup pdf. The topics discussed in these slides are fixed assets, value, fiscal year. This is a completely editable PowerPoint presentation and is available for immediate download. Download now and impress your audience.

Funds Requisite Evaluation Fixed Asset Dashboard Brochure Demonstration PDF
Presenting this set of slides with name funds requisite evaluation fixed asset dashboard brochure demonstration pdf. The topics discussed in these slides are fixed assets, value, fiscal year. This is a completely editable PowerPoint presentation and is available for immediate download. Download now and impress your audience.
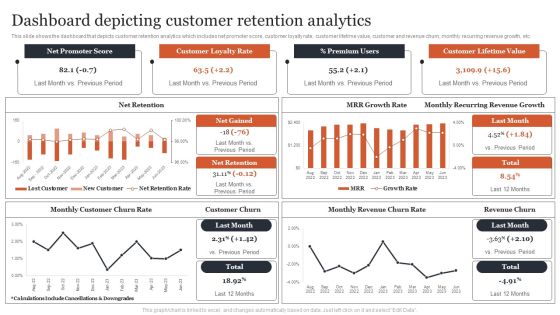
Managing Customer Attrition Dashboard Depicting Customer Retention Analytics Formats PDF
This slide shows the dashboard that depicts customer retention analytics which includes net promoter score, customer loyalty rate, customer lifetime value, customer and revenue churn, monthly recurring revenue growth, etc. Get a simple yet stunning designed Managing Customer Attrition Dashboard Depicting Customer Retention Analytics Formats PDF. It is the best one to establish the tone in your meetings. It is an excellent way to make your presentations highly effective. So, download this PPT today from Slidegeeks and see the positive impacts. Our easy-to-edit Managing Customer Attrition Dashboard Depicting Customer Retention Analytics Formats PDF can be your go-to option for all upcoming conferences and meetings. So, what are you waiting for Grab this template today.

Dashboard Depicting Sales And Customer Analytics Professional PDF
This slide focuses on dashboard that depicts sales and customer analytics which covers sales revenue, average transaction rate, out of stock items, sales by division, monthly visitors, etc. Make sure to capture your audiences attention in your business displays with our gratis customizable Dashboard Depicting Sales And Customer Analytics Professional PDF. These are great for business strategies, office conferences, capital raising or task suggestions. If you desire to acquire more customers for your tech business and ensure they stay satisfied, create your own sales presentation with these plain slides.

Saas Company Management Dashboard With Key Kpl Template PDF
The purpose of this slide is to showcase various metrics of SaaS company in the form of dashboard. The metrics could be, Paying customers, monthly recurring revenue MRR, customer acquisition cost CAC, etc. Showcasing this set of slides titled Saas Company Management Dashboard With Key Kpl Template PDF. The topics addressed in these templates are Monthly Recurring Revenue, Customer Acquisition Cost, Customer Lifetime Value, Average Revenue Per Unit. All the content presented in this PPT design is completely editable. Download it and make adjustments in color, background, font etc. as per your unique business setting.

KPI Dashboard To Assess Impact On Staff Productivity Infographics PDF
This slide covers dashboard to assess impact on employee performance by training and motivation program. It involves details such as absenteeism rate, training costs and overall labor effectiveness. Make sure to capture your audiences attention in your business displays with our gratis customizable KPI Dashboard To Assess Impact On Staff Productivity Infographics PDF. These are great for business strategies, office conferences, capital raising or task suggestions. If you desire to acquire more customers for your tech business and ensure they stay satisfied, create your own sales presentation with these plain slides.

Capital Consumption Adjustment Fixed Asset Dashboard Cost Introduction PDF
Presenting this set of slides with name capital consumption adjustment fixed asset dashboard cost introduction pdf. The topics discussed in these slides are cost, value, original, fixed asset. This is a completely editable PowerPoint presentation and is available for immediate download. Download now and impress your audience.
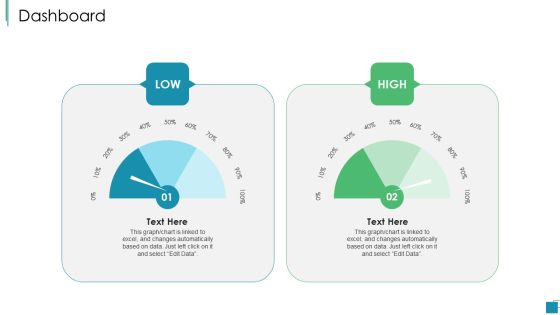
Venture Capital Pitch Decks For Private Companies Dashboard Themes PDF
Deliver and pitch your topic in the best possible manner with this venture capital pitch decks for private companies dashboard themes pdf. Use them to share invaluable insights on low, high and impress your audience. This template can be altered and modified as per your expectations. So, grab it now.
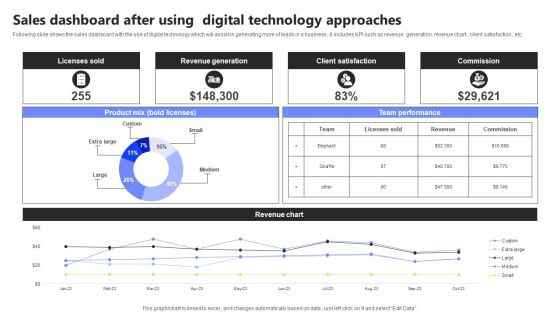
Sales Dashboard After Using Digital Technology Approaches Infographics PDF
Following slide shows the sales dashboard with the use of digital technology which will assist in generating more of leads in a business . It includes KPI such as revenue generation, revenue chart , client satisfaction , etc. Showcasing this set of slides titled Sales Dashboard After Using Digital Technology Approaches Infographics PDF. The topics addressed in these templates are Licenses Sold, Revenue Generation, Client Satisfaction. All the content presented in this PPT design is completely editable. Download it and make adjustments in color, background, font etc. as per your unique business setting.
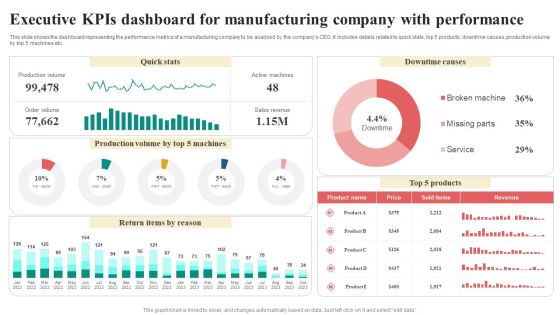
Executive Kpis Dashboard For Manufacturing Company With Performance Infographics PDF
This slide shows the dashboard representing the performance metrics of a manufacturing company to be analyzed by the companys CEO. It includes details related to quick stats, top 5 products, downtime causes, production volume by top 5 machines etc. Showcasing this set of slides titled Executive Kpis Dashboard For Manufacturing Company With Performance Infographics PDF. The topics addressed in these templates are Return Items By Reason, Quick Stats, Downtime Causes, Revenue. All the content presented in this PPT design is completely editable. Download it and make adjustments in color, background, font etc. as per your unique business setting.

Business Referral Marketing Program Performance Metrics Dashboard Introduction PDF
This slide shows KPI dashboard to effectively track performance of business referral program in order to attract more leads and potential customers to the busines. It includes details related to key metrics such as referral participation rate, referred customers, referral conversion rate and total revenue generated. Showcasing this set of slides titled Business Referral Marketing Program Performance Metrics Dashboard Introduction PDF. The topics addressed in these templates are Referral Participation Rate, Referred Customers, Referral Conversion Rate, Total Revenue Generated. All the content presented in this PPT design is completely editable. Download it and make adjustments in color, background, font etc. as per your unique business setting.

Dashboard To Measure Workflow Performance Post RPA Implementation Demonstration PDF
This slide presents a dashboard to measure the overall operation performance after RPA implementation. It includes return on investment, bot numbers, saved hours, capital, bots runtime, time saved by bots, and workflow processes. If you are looking for a format to display your unique thoughts, then the professionally designed Dashboard To Measure Workflow Performance Post RPA Implementation Demonstration PDF is the one for you. You can use it as a Google Slides template or a PowerPoint template. Incorporate impressive visuals, symbols, images, and other charts. Modify or reorganize the text boxes as you desire. Experiment with shade schemes and font pairings. Alter, share or cooperate with other people on your work. Download Dashboard To Measure Workflow Performance Post RPA Implementation Demonstration PDF and find out how to give a successful presentation. Present a perfect display to your team and make your presentation unforgettable.

Kpi Dashboard To Track Digital Transformation Initiatives Formats PDF
Following slide provides dashboard that can be used by the businesses to measure the performance of digital transformation initiatives with the help of different KPIs. KPIs covered are social presence, click through rate, sales revenue, churn amount etc. Crafting an eye catching presentation has never been more straightforward. Let your presentation shine with this tasteful yet straightforward Kpi Dashboard To Track Digital Transformation Initiatives Formats PDF template. It offers a minimalistic and classy look that is great for making a statement. The colors have been employed intelligently to add a bit of playfulness while still remaining professional. Construct the ideal Kpi Dashboard To Track Digital Transformation Initiatives Formats PDF that effortlessly grabs the attention of your audience Begin now and be certain to wow your customers.

Dashboard Depicting Sales Kpis To Track Current Status Structure PDF
This slide shows the dashboard that depicts sales KPIs to track current status which involves won and lost opportunities, revenues and pipeline by territory, sales by different products, etc. Deliver and pitch your topic in the best possible manner with this Dashboard Depicting Sales Kpis To Track Current Status Structure PDF. Use them to share invaluable insights on Total Opportunities, Revenue By Territory, Sales By Product and impress your audience. This template can be altered and modified as per your expectations. So, grab it now.

Dashboard Highlighting Product Kpis For Enhancement Strategy Structure PDF
This slide illustrates dashboard indicating product kpis for improvement plan which can be referred by organizations to review sales campaign performance. It includes information about top products in revenue, online vs. Offline transactions, increased sales by campaign and cost of products sold. Showcasing this set of slides titled Dashboard Highlighting Product Kpis For Enhancement Strategy Structure PDF. The topics addressed in these templates are Revenue, Products, Cost. All the content presented in this PPT design is completely editable. Download it and make adjustments in color, background, font etc. as per your unique business setting.
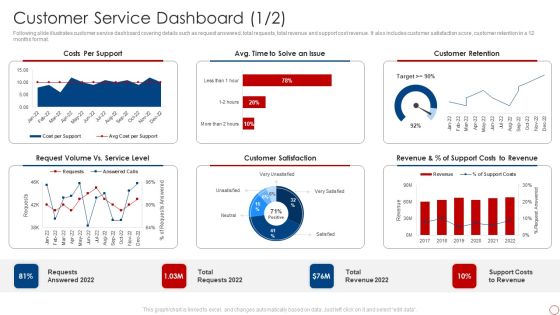
Kpis For Evaluating Business Sustainability Customer Service Dashboard Designs PDF
Following slide illustrates customer service dashboard covering details such as request answered, total requests, total revenue and support cost revenue. It also includes customer satisfaction score, customer retention in a 12 months format. Deliver and pitch your topic in the best possible manner with this Kpis For Evaluating Business Sustainability Customer Service Dashboard Designs PDF. Use them to share invaluable insights on Costs Per Support, Customer Retention, Customer Satisfaction and impress your audience. This template can be altered and modified as per your expectations. So, grab it now.

Restaurant Promotion Marketing Analysis Dashboard For Hospitality Company Microsoft PDF
This slide shows the dashboard to be used by the hospitality company for analyzing the restaurant marketing. It includes details related to revenue, cost of revenue, net income, food and beverage revenue by location and type etc.Showcasing this set of slides titled Restaurant Promotion Marketing Analysis Dashboard For Hospitality Company Microsoft PDF The topics addressed in these templates are Beverage Revenue, Food Beverage, Expenses Account All the content presented in this PPT design is completely editable. Download it and make adjustments in color, background, font etc. as per your unique business setting.

Dashboard For Tracking Sales Target Metrics Introduction PDF
This slide presents KPI dashboard for tracking Sales Target Metrics achievement monthly and region wise helpful in adjusting activities as per ongoing performance. It includes average weekly sales revenue, average sales target, annual sales growth, regional sales performance and average revenue per unit that should be regularly tracked. Showcasing this set of slides titled Dashboard For Tracking Sales Target Metrics Introduction PDF. The topics addressed in these templates are Average Revenue, Per Unit, Average Weekly, Sales Revenue. All the content presented in this PPT design is completely editable. Download it and make adjustments in color, background, font etc. as per your unique business setting.

Sales Work Action Plan Analysis Dashboard Brochure PDF
This slide covers the dashboard for analyzing the sales plan implemented in an organization. The purpose of this template is to assess strategical and operational aspects of the company. It includes key performance indicators such as number of sales, revenue, profit, cost, etc. Showcasing this set of slides titled Sales Work Action Plan Analysis Dashboard Brochure PDF. The topics addressed in these templates are Sales Revenue, Cost Breakdown, Accumulated Revenue. All the content presented in this PPT design is completely editable. Download it and make adjustments in color, background, font etc. as per your unique business setting.

Company Payout Dashboard For Transaction Data Collection Themes PDF
The slide covers a dashboard to highlight the status of current and previous transactions. Various elements included are card details, my cash, my savings, money sent, amount transfers, transaction history, etc. Pitch your topic with ease and precision using this Company Payout Dashboard For Transaction Data Collection Themes PDF. This layout presents information on Amount Transfers, Earning Month, Previous Transaction. It is also available for immediate download and adjustment. So, changes can be made in the color, design, graphics or any other component to create a unique layout.

Dashboard For Measuring Information Technology Framework Service Performance Ideas PDF
This slide provides a dashboard for measuring key performance indicators of a IT service provider. Key components are ROI, weekly revenue, successful cloud deployments, service type used, monthly visitors and net promoter score. Showcasing this set of slides titled Dashboard For Measuring Information Technology Framework Service Performance Ideas PDF. The topics addressed in these templates are Service Type Used, Weekly Revenue, Net Promoter Score. All the content presented in this PPT design is completely editable. Download it and make adjustments in color, background, font etc. as per your unique business setting.

 Home
Home