Financial Dashboard

Omnichannel Services Solution In Financial Sector Strategies To Improve Banking IVR Designs PDF
This slide covers strategies to enhance interactive voice response technology for contacting banks customer service. The purpose of this template is to provide action steps for improving customer experience. It includes ways such as customizing IVR menu options, use of customer data to prioritize customers, avoid using stale IVR scripts, gathering customer feedback, etc. Are you in need of a template that can accommodate all of your creative concepts This one is crafted professionally and can be altered to fit any style. Use it with Google Slides or PowerPoint. Include striking photographs, symbols, depictions, and other visuals. Fill, move around, or remove text boxes as desired. Test out color palettes and font mixtures. Edit and save your work, or work with colleagues. Download Omnichannel Services Solution In Financial Sector Strategies To Improve Banking IVR Designs PDF and observe how to make your presentation outstanding. Give an impeccable presentation to your group and make your presentation unforgettable.

Adjusting Financial Strategies And Planning Quarterly Income Statement For Monitoring Business Profitability Infographics PDF
This slide provides glimpse about quarterly profit and loss statement that can help our business to calculate net profit or loss. It includes revenue, net sales, cost of goods sold, operating expenses, operating profit, etc. The Adjusting Financial Strategies And Planning Quarterly Income Statement For Monitoring Business Profitability Infographics PDF is a compilation of the most recent design trends as a series of slides. It is suitable for any subject or industry presentation, containing attractive visuals and photo spots for businesses to clearly express their messages. This template contains a variety of slides for the user to input data, such as structures to contrast two elements, bullet points, and slides for written information. Slidegeeks is prepared to create an impression.

Revenue Contribution From Top Engineering Products Engineering Company Financial Analysis Report Infographics PDF
The following slide highlights the revenue contribution of engineering products, It shows sales amount form the top five products in millions along with key insights. This Revenue Contribution From Top Engineering Products Engineering Company Financial Analysis Report Infographics PDF from Slidegeeks makes it easy to present information on your topic with precision. It provides customization options, so you can make changes to the colors, design, graphics, or any other component to create a unique layout. It is also available for immediate download, so you can begin using it right away. Slidegeeks has done good research to ensure that you have everything you need to make your presentation stand out. Make a name out there for a brilliant performance.
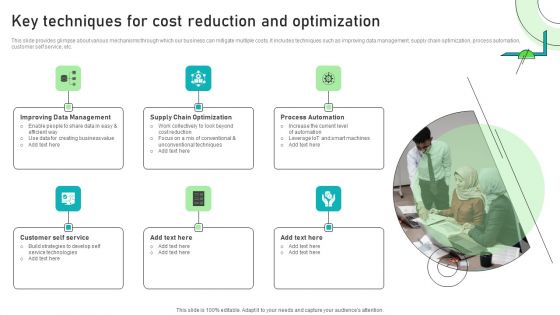
Adjusting Financial Strategies And Planning Key Techniques For Cost Reduction And Optimization Topics PDF
This slide provides glimpse about various mechanisms through which our business can mitigate multiple costs. It includes techniques such as improving data management, supply chain optimization, process automation, customer self service, etc. Slidegeeks is one of the best resources for PowerPoint templates. You can download easily and regulate Adjusting Financial Strategies And Planning Key Techniques For Cost Reduction And Optimization Topics PDF for your personal presentations from our wonderful collection. A few clicks is all it takes to discover and get the most relevant and appropriate templates. Use our Templates to add a unique zing and appeal to your presentation and meetings. All the slides are easy to edit and you can use them even for advertisement purposes.
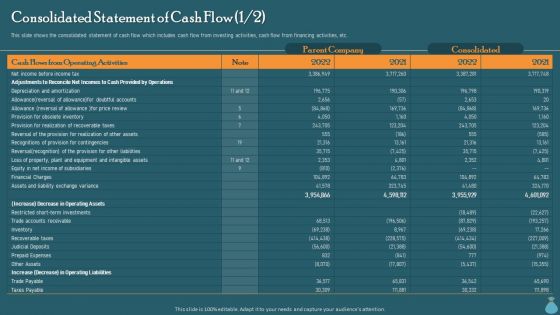
Financial Data Revelation To Varied Stakeholders Consolidated Statement Of Cash Flow Diagrams PDF
This slide shows the consolidated statement of cash flow which includes cash flow from investing activities, cash flow from financing activities, etc. Are you in need of a template that can accommodate all of your creative concepts This one is crafted professionally and can be altered to fit any style. Use it with Google Slides or PowerPoint. Include striking photographs, symbols, depictions, and other visuals. Fill, move around, or remove text boxes as desired. Test out color palettes and font mixtures. Edit and save your work, or work with colleagues. Download Financial Data Revelation To Varied Stakeholders Consolidated Statement Of Cash Flow Diagrams PDF and observe how to make your presentation outstanding. Give an impeccable presentation to your group and make your presentation unforgettable.
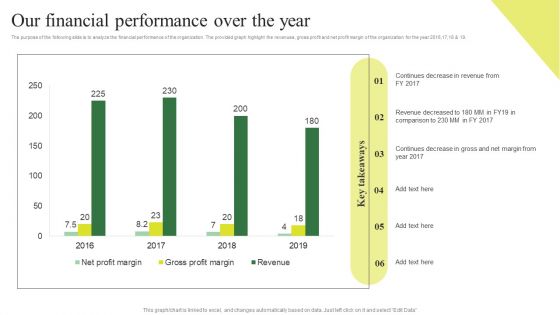
Consumption Based Pricing Model Our Financial Performance Over The Year Elements PDF
The purpose of the following slide is to analyze the financial performance of the organization. The provided graph highlight the revenues, gross profit and net profit margin of the organization for the year 2016,17,18 and 19. This Consumption Based Pricing Model Key Metrices For Forecasting In Recurring Revenue Model Clipart PDF is perfect for any presentation, be it in front of clients or colleagues. It is a versatile and stylish solution for organizing your meetings. The Consumption Based Pricing Model Key Metrices For Forecasting In Recurring Revenue Model Clipart PDF features a modern design for your presentation meetings. The adjustable and customizable slides provide unlimited possibilities for acing up your presentation. Slidegeeks has done all the homework before launching the product for you. So, do not wait, grab the presentation templates today
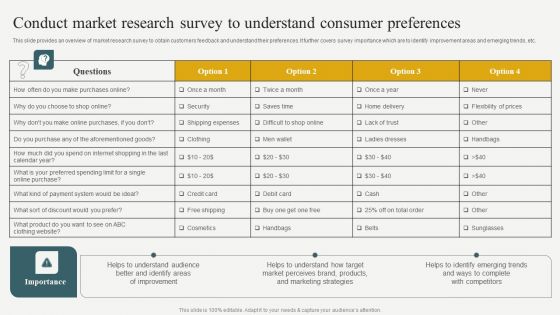
Evaluating Financial Position Of E Commerce Company Conduct Market Research Survey To Understand Consumer Elements PDF
This slide provides an overview of market research survey to obtain customers feedback and understand their preferences. It further covers survey importance which are to identify improvement areas and emerging trends, etc. Slidegeeks is one of the best resources for PowerPoint templates. You can download easily and regulate Evaluating Financial Position Of E Commerce Company Competitive Analysis Of Raw Material Suppliers Structure PDF for your personal presentations from our wonderful collection. A few clicks is all it takes to discover and get the most relevant and appropriate templates. Use our Templates to add a unique zing and appeal to your presentation and meetings. All the slides are easy to edit and you can use them even for advertisement purposes.

Adjusting Financial Strategies And Planning Measuring Business Earnings With Profitability Ratios Download PDF
This slide provides glimpse about profitability ratio analysis for calculating our firms business earnings and net profit margin. It includes quarterly gross profit margin, quarterly net profit margin, key insights, etc. The Adjusting Financial Strategies And Planning Measuring Business Earnings With Profitability Ratios Download PDF is a compilation of the most recent design trends as a series of slides. It is suitable for any subject or industry presentation, containing attractive visuals and photo spots for businesses to clearly express their messages. This template contains a variety of slides for the user to input data, such as structures to contrast two elements, bullet points, and slides for written information. Slidegeeks is prepared to create an impression.

Goals And Objectives Based On Industry Strategy For Launching A Financial Strategy SS V
This slide showcases various operational metrics of finance industry that are to be achieved by business. It includes KPIs such as customer acquisition, retention, revenue growth, customer service quality and risk management. Are you in need of a template that can accommodate all of your creative concepts This one is crafted professionally and can be altered to fit any style. Use it with Google Slides or PowerPoint. Include striking photographs, symbols, depictions, and other visuals. Fill, move around, or remove text boxes as desired. Test out color palettes and font mixtures. Edit and save your work, or work with colleagues. Download Goals And Objectives Based On Industry Strategy For Launching A Financial Strategy SS V and observe how to make your presentation outstanding. Give an impeccable presentation to your group and make your presentation unforgettable.
Adjusting Financial Strategies And Planning Tracking The Cashflow Improvements With Cash Management Diagrams PDF
This slide showcases the KPIs that would help our business organization to track the improvements in the new cash management process. It includes quick ratio, cash balance, current ratio, days inventory outstanding, etc. Retrieve professionally designed Adjusting Financial Strategies And Planning Tracking The Cashflow Improvements With Cash Management Diagrams PDF to effectively convey your message and captivate your listeners. Save time by selecting pre made slideshows that are appropriate for various topics, from business to educational purposes. These themes come in many different styles, from creative to corporate, and all of them are easily adjustable and can be edited quickly. Access them as PowerPoint templates or as Google Slides themes. You do not have to go on a hunt for the perfect presentation because Slidegeeks got you covered from everywhere.
Tracking The Cashflow Improvements Cash Assessing Corporate Financial Techniques Clipart Pdf
This slide showcases the KPIs that would help our business organization to track the improvements in the new cash management process. It includes quick ratio, cash balance, current ratio, days inventory outstanding, etc. Slidegeeks is one of the best resources for PowerPoint templates. You can download easily and regulate Tracking The Cashflow Improvements Cash Assessing Corporate Financial Techniques Clipart Pdf for your personal presentations from our wonderful collection. A few clicks is all it takes to discover and get the most relevant and appropriate templates. Use our Templates to add a unique zing and appeal to your presentation and meetings. All the slides are easy to edit and you can use them even for advertisement purposes.
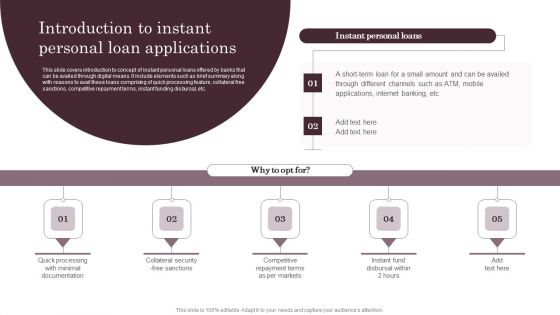
Omnichannel Services Solution In Financial Sector Introduction To Instant Personal Loan Applications Pictures PDF
This slide covers introduction to concept of instant personal loans offered by banks that can be availed through digital means. It include elements such as brief summary along with reasons to avail these loans comprising of quick processing feature, collateral free sanctions, competitive repayment terms, instant funding disbursal, etc. The Omnichannel Services Solution In Financial Sector Introduction To Instant Personal Loan Applications Pictures PDF is a compilation of the most recent design trends as a series of slides. It is suitable for any subject or industry presentation, containing attractive visuals and photo spots for businesses to clearly express their messages. This template contains a variety of slides for the user to input data, such as structures to contrast two elements, bullet points, and slides for written information. Slidegeeks is prepared to create an impression.

Shape To Represent 16 Variable In It Ppt Business Financial Planning PowerPoint Templates
We present our shape to represent 16 variable in it ppt business financial planning PowerPoint templates.Present our Marketing PowerPoint Templates because Our PowerPoint Templates and Slides offer you the widest possible range of options. Download and present our Finance PowerPoint Templates because Our PowerPoint Templates and Slides will let Your superior ideas hit the target always and everytime. Present our Layers PowerPoint Templates because Our PowerPoint Templates and Slides will give you great value for your money. Be assured of finding the best projection to highlight your words. Present our Triangles PowerPoint Templates because These PowerPoint Templates and Slides will give the updraft to your ideas. See them soar to great heights with ease. Present our Pyramids PowerPoint Templates because our PowerPoint Templates and Slides will give your ideas the shape.Use these PowerPoint slides for presentations relating to Pyramid, chart, paper, origami, compare, advertisement, sequence, step, layout, triangle, tutorial, business, concept, sign, hierarchy, presentation, glossy, bright, gradation, template, cone, data, clean, process, element, workflow, shape, modern, creative, economic, rhythm, options, shiny, futuristic, web, design, trendy, blue, text, composition, choice, info, five, version, progress, menu, information, promotion, infographics. The prominent colors used in the PowerPoint template are Blue, Gray, Black.
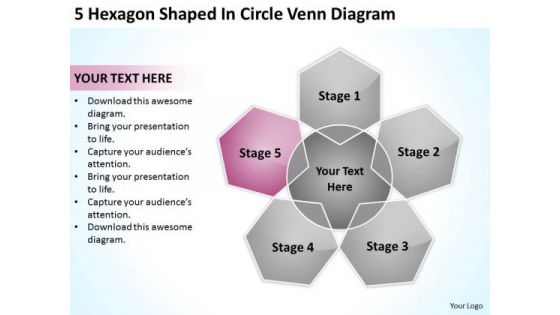
5 Hexagon Shaped In Circle Venn Diagram Ppt Business Financial Plan PowerPoint Templates
We present our 5 hexagon shaped in circle venn diagram ppt business financial plan PowerPoint templates.Download and present our Circle Charts PowerPoint Templates because Our PowerPoint Templates and Slides will let you Leave a lasting impression to your audiences. They possess an inherent longstanding recall factor. Use our Marketing PowerPoint Templates because These PowerPoint Templates and Slides will give the updraft to your ideas. See them soar to great heights with ease. Use our Business PowerPoint Templates because our PowerPoint Templates and Slides are the string of your bow. Fire of your ideas and conquer the podium. Download our Shapes PowerPoint Templates because Our PowerPoint Templates and Slides help you pinpoint your timelines. Highlight the reasons for your deadlines with their use. Download and present our Process and Flows PowerPoint Templates because Our PowerPoint Templates and Slides are Clear and concise. Use them and dispel any doubts your team may have.Use these PowerPoint slides for presentations relating to Flow, chart, business concept, step, future, business, vector, sign, presentation, symbol, template, process, flowchart, report, title, shape, abstract, illustration, system, strategy, project, catalog, round, color full, web, solution, design, color, text, motion, hexagon, structure . The prominent colors used in the PowerPoint template are Pink, Gray, Black.

Structre 7 Staged For Independent Process Ppt Financial Advisor Business Plan PowerPoint Slides
We present our structre 7 staged for independent process ppt financial advisor business plan PowerPoint Slides.Download our Pyramids PowerPoint Templates because Our PowerPoint Templates and Slides will embellish your thoughts. See them provide the desired motivation to your team. Download and present our Process and Flows PowerPoint Templates because Our PowerPoint Templates and Slides are the chords of your song. String them along and provide the lilt to your views. Present our Signs PowerPoint Templates because You should Press the right buttons with our PowerPoint Templates and Slides. They will take your ideas down the perfect channel. Download and present our Layers PowerPoint Templates because Our PowerPoint Templates and Slides offer you the widest possible range of options. Download our Business PowerPoint Templates because you can Break through with our PowerPoint Templates and Slides. Bring down the mental barriers of your audience.Use these PowerPoint slides for presentations relating to pyramidal, pyramid, chart, 3d, vector, leadership, statistics, green, triangle, red, business, hierarchy, ranking, presentation, symbol, template, diagram, data, multilevel, marketing, level, top, abstract, management, graph, illustration, icon, stage, object, strategy, seven, group, growth, text, organization, progress, construction, structure, results, performance. The prominent colors used in the PowerPoint template are Blue, Black, Gray.
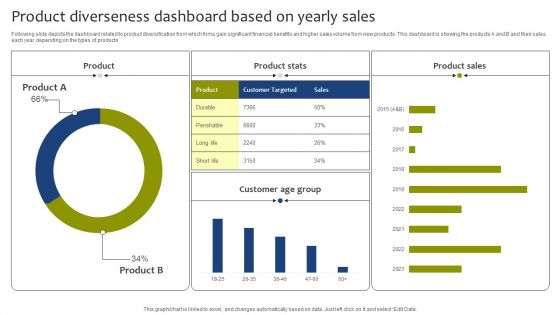
Product Diverseness Dashboard Based On Yearly Sales Graphics PDF
Following slide depicts the dashboard related to product diversification from which firms gain significant financial benefits and higher sales volume from new products. This dashboard is showing the products A and B and their sales each year depending on the types of products. Showcasing this set of slides titled Product Diverseness Dashboard Based On Yearly Sales Graphics PDF. The topics addressed in these templates areProduct Stats, Product Sales, Customer Age Group . All the content presented in this PPT design is completely editable. Download it and make adjustments in color, background, font etc. as per your unique business setting.
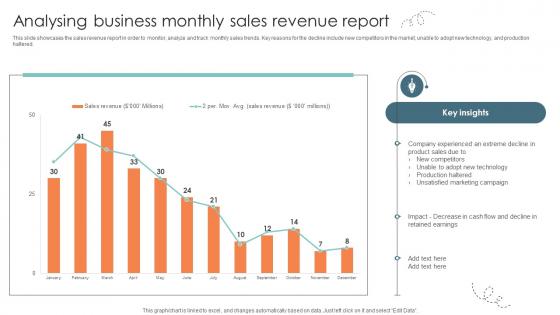
Analysing Business Monthly Sales Revenue Report Strategic Approaches To Corporate Financial
This slide showcases the sales revenue report in order to monitor, analyze and track monthly sales trends. Key reasons for the decline include new competitors in the market, unable to adopt new technology, and production haltered. Boost your pitch with our creative Analysing Business Monthly Sales Revenue Report Strategic Approaches To Corporate Financial. Deliver an awe-inspiring pitch that will mesmerize everyone. Using these presentation templates you will surely catch everyones attention. You can browse the ppts collection on our website. We have researchers who are experts at creating the right content for the templates. So you do not have to invest time in any additional work. Just grab the template now and use them.

Project Budget Planning Dashboard With Income Statement Breakdown Professional PDF
This slide covers a dashboard which will help project managers for taking financial business decision by examining the income statement, income statement breakdown, cash flow and internal rate of return. Pitch your topic with ease and precision using this project budget planning dashboard with income statement breakdown professional pdf. This layout presents information on income statement, income statement breakdown, cash flow, internal rate of return . It is also available for immediate download and adjustment. So, changes can be made in the color, design, graphics or any other component to create a unique layout.
Determine IT Project Portfolio Management Tracking Dashboard Clipart PDF
This slide provides information regarding IT project portfolio management tracking dashboard including details about allocated budget across portfolios, used budget percentage, estimated vs. actual cost, etc. Deliver an awe inspiring pitch with this creative Determine IT Project Portfolio Management Tracking Dashboard Clipart PDF bundle. Topics like Financials, Estimated Cost Across Portfolios, Actual Cost Across Portfolios can be discussed with this completely editable template. It is available for immediate download depending on the needs and requirements of the user.

Healthcare Financial Analysis Scorecard With Target And Profit Ppt Gallery Example File PDF
This graph or chart is linked to excel, and changes automatically based on data. Just left click on it and select Edit Data. Deliver an awe inspiring pitch with this creative Avg Nurse Patient, Revenue And Expenses, Avg Treatment Costs bundle. Topics like Average Length Stay, Patient Satisfaction Target, Target Per Month can be discussed with this completely editable template. It is available for immediate download depending on the needs and requirements of the user.

Business Diagram Five Staged Circular Timeline For Financial Report Diagram Presentation Template
This business diagram displays five staged text circles. This diagram is suitable to depict flow of business activities or steps. Download this professional slide to present information in an attractive manner
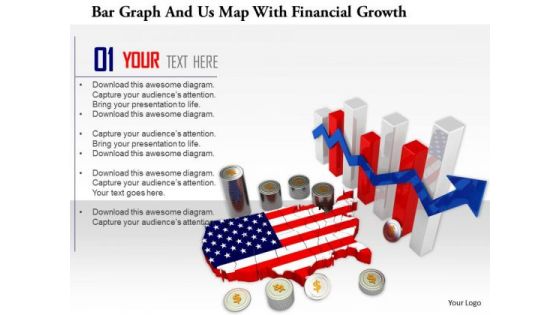
Stock Photo Bar Graph And Us Map With Financial Growth PowerPoint Slide
This image displays American map with business graph in background. This image slide contains the concept of American economy, business growth and reports. Use this amazing slide to make professional presentations.

Product Development Plan Dashboard With Key Resources Summary PDF
This slide represents the dashboard of product development roadmap. It include product launches, financials and key resources. Showcasing this set of slides titled Product Development Plan Dashboard With Key Resources Summary PDF. The topics addressed in these templates are Product Launches, 2023 Financials, Key Resources. All the content presented in this PPT design is completely editable. Download it and make adjustments in color, background, font etc. as per your unique business setting.
Stock Inventory Acquisition Dashboard For Managing Warehouse Operations Icons PDF
This slide showcases dashboard that can help organization to manage and track the warehouse operations. Its key elements are order, volume, inventory, monthly KPIs and global financial performance. Explore a selection of the finest Stock Inventory Acquisition Dashboard For Managing Warehouse Operations Icons PDF here. With a plethora of professionally designed and pre-made slide templates, you can quickly and easily find the right one for your upcoming presentation. You can use our Stock Inventory Acquisition Dashboard For Managing Warehouse Operations Icons PDF to effectively convey your message to a wider audience. Slidegeeks has done a lot of research before preparing these presentation templates. The content can be personalized and the slides are highly editable. Grab templates today from Slidegeeks.
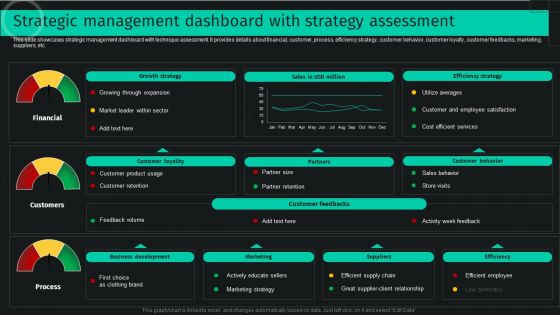
Strategic Management Dashboard With Strategy Assessment Sample PDF
This slide showcases strategic management dashboard with technique assessment. It provides details about financial, customer, process, efficiency strategy, customer behavior, customer loyalty, customer feedbacks, marketing, suppliers, etc. Do you have to make sure that everyone on your team knows about any specific topic I yes, then you should give Strategic Management Dashboard With Strategy Assessment Sample PDF a try. Our experts have put a lot of knowledge and effort into creating this impeccable Strategic Management Dashboard With Strategy Assessment Sample PDF. You can use this template for your upcoming presentations, as the slides are perfect to represent even the tiniest detail. You can download these templates from the Slidegeeks website and these are easy to edit. So grab these today.

Dashboard Marketing Planning Ppt PowerPoint Presentation Slides Slideshow
This is a dashboard marketing planning ppt powerpoint presentation slides slideshow. This is a three stage process. The stages in this process are dashboard, finance, analysis, business, investment.

Crm Marketing Dashboard Ppt PowerPoint Presentation Gallery Tips
This is a crm marketing dashboard ppt powerpoint presentation gallery tips. This is a two stage process. The stages in this process are leads per week, leads this week.
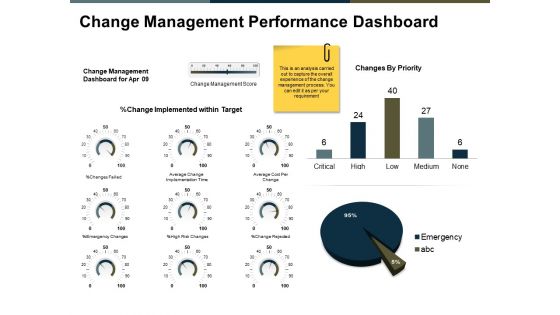
Change Management Performance Dashboard Ppt PowerPoint Presentation Professional Portrait
This is a change management performance dashboard ppt powerpoint presentation professional portrait. This is a three stage process. The stages in this process are finance, marketing, analysis, business, investment.

Strategies To Tackle Operational Risk In Banking Institutions Operational Risk Management Dashboard Structure PDF
This slide illustrates dashboard for operational risk management. It includes information about total risk events, financial impact, risks by rating and risks by month. Deliver an awe inspiring pitch with this creative strategies to tackle operational risk in banking institutions operational risk management dashboard structure pdf bundle. Topics like financial impact, operational risk management dashboard can be discussed with this completely editable template. It is available for immediate download depending on the needs and requirements of the user.
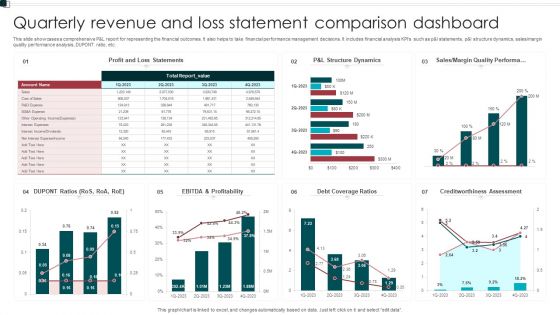
Quarterly Revenue And Loss Statement Comparison Dashboard Portrait PDF
This slide showcases a comprehensive P and L report for representing the financial outcomes. It also helps to take financial performance management decisions. It includes financial analysis KPIs such as p and l statements, p and l structure dynamics, sales or margin quality performance analysis, DUPONT ratio, etc. Showcasing this set of slides titled Quarterly Revenue And Loss Statement Comparison Dashboard Portrait PDF. The topics addressed in these templates are Profitability, Debt Coverage Ratios, Margin Quality Performa. All the content presented in this PPT design is completely editable. Download it and make adjustments in color, background, font etc. as per your unique business setting.

Data Quality Dashboard For Linked Data Download PDF
This slide describes the data quality dashboard for linked data by covering details of account information quality, contact details quality, financial data quality, and missing account information. Deliver an awe inspiring pitch with this creative Data Quality Dashboard For Linked Data Download PDF bundle. Topics like Account Data Quality, Contact Data Quality, Financial Data Quality can be discussed with this completely editable template. It is available for immediate download depending on the needs and requirements of the user.
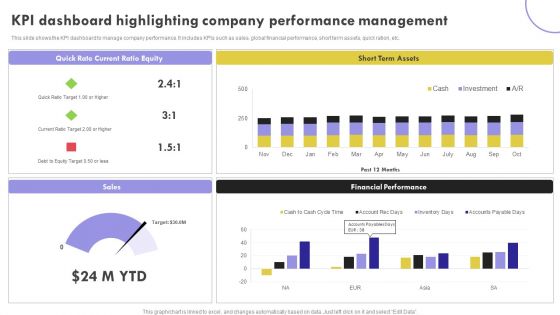
KPI Dashboard Highlighting Company Performance Management Inspiration PDF
This slide shows the KPI dashboard to manage company performance. It includes KPIs such as sales, global financial performance, short term assets, quick ration, etc.Showcasing this set of slides titled KPI Dashboard Highlighting Company Performance Management Inspiration PDF. The topics addressed in these templates are Current Ratio, Term Assets, Financial Performance. All the content presented in this PPT design is completely editable. Download it and make adjustments in color, background, font etc. as per your unique business setting.
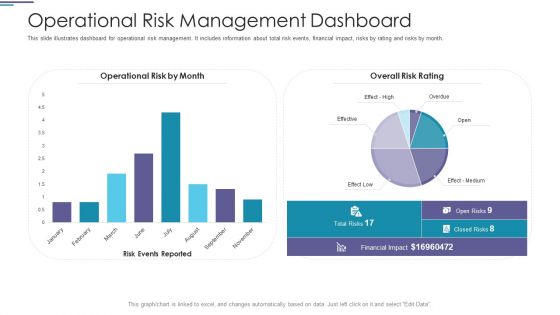
Operational Risk Management Dashboard Ppt PowerPoint Presentation Styles Pictures PDF
This slide illustrates dashboard for operational risk management. It includes information about total risk events, financial impact, risks by rating and risks by month.Deliver an awe-inspiring pitch with this creative operational risk management dashboard ppt powerpoint presentation styles pictures pdf. bundle. Topics like financial impact, operational risk by month, overall risk rating can be discussed with this completely editable template. It is available for immediate download depending on the needs and requirements of the user.
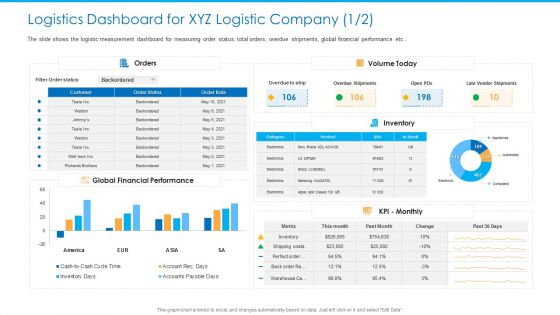
Logistics Dashboard For XYZ Logistic Company Orders Slides PDF
The slide shows the logistic measurement dashboard for measuring order status, total orders, overdue shipments, global financial performance etc.Deliver and pitch your topic in the best possible manner with this logistics dashboard for xyz logistic company orders slides pdf. Use them to share invaluable insights on global financial performance, overdue shipments, late vendor shipments and impress your audience. This template can be altered and modified as per your expectations. So, grab it now.
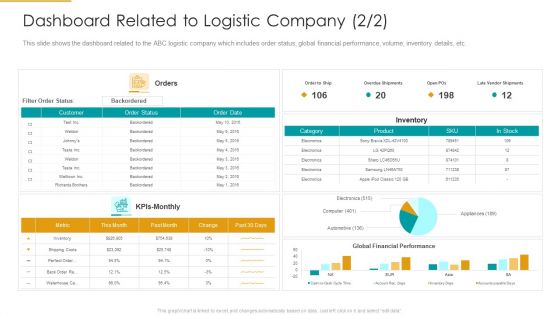
Dashboard Related To Logistic Company Electronics Ideas PDF
This slide shows the dashboard related to the ABC logistic company which includes order status, global financial performance, volume, inventory details, etc. Deliver an awe inspiring pitch with this creative dashboard related to logistic company electronics ideas pdf bundle. Topics like inventory, global financial performance, product can be discussed with this completely editable template. It is available for immediate download depending on the needs and requirements of the user.
Performance Dashboard Management Ppt PowerPoint Presentation Icon Themes
This is a performance dashboard management ppt powerpoint presentation icon themes. This is a four stage process. The stages in this process are finance, marketing, analysis, business, investment.

Performance Dashboard Marketing Ppt PowerPoint Presentation Show Microsoft
This is a performance dashboard marketing ppt powerpoint presentation show microsoft. This is a four stage process. The stages in this process are finance, marketing, analysis, business, investment.
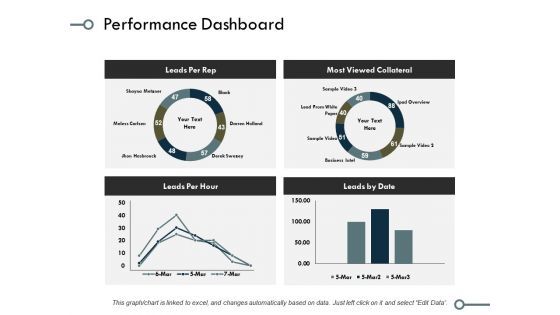
Performance Dashboard Ppt PowerPoint Presentation Model Graphics Example
This is a performance dashboard ppt powerpoint presentation model graphics example. This is a four stage process. The stages in this process are finance, marketing, analysis, business, investment.

Dashboard Design And Development For Travel Diagram Background
This is a dashboard design and development for travel diagram background. This is a five stage process. The stages in this process are number of trips, sales, delayed flights, regional load, flight expense.
Sales Performance Dashboard Ppt PowerPoint Presentation Pictures Icons
This is a sales performance dashboard ppt powerpoint presentation pictures icons. This is a six stage process. The stages in this process are top selling plans, top opportunities, new customer, sales funnel, top sales reps.
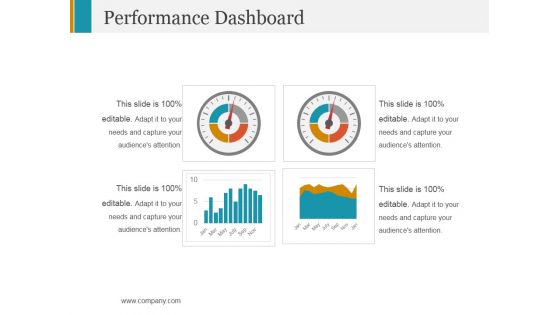
Performance Dashboard Template 2 Ppt PowerPoint Presentation Model Format
This is a performance dashboard template 2 ppt powerpoint presentation model format. This is a four stage process. The stages in this process are dashboard, finance, business, marketing.
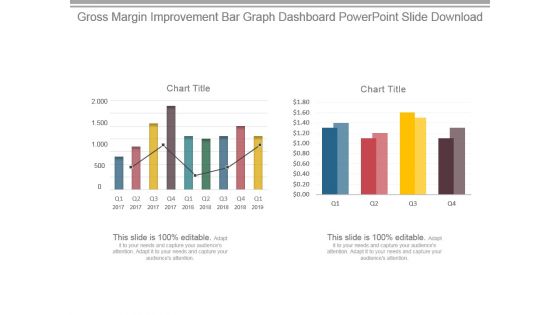
Gross Margin Improvement Bar Graph Dashboard Powerpoint Slide Download
This is a gross margin improvement bar graph dashboard powerpoint slide download. This is a two stage process. The stages in this process are chart title.

Sales Dashboard Slide Template 1 Ppt PowerPoint Presentation Layouts
This is a sales dashboard slide template 1 ppt powerpoint presentation layouts. This is a three stage process. The stages in this process are business, marketing, product, year.
Labour Effectiveness Dashboard Ppt PowerPoint Presentation Icon Vector
This is a labour effectiveness dashboard ppt powerpoint presentation icon vector.This is a three stage process. The stages in this process are finance, marketing, management, investment, analysis.

Successful Mobile Strategies For Business App Metrics Dashboard Microsoft PDF
Presenting successful mobile strategies for business app metrics dashboard microsoft pdf to provide visual cues and insights. Share and navigate important information on six stages that need your due attention. This template can be used to pitch topics like app metrics dashboard. In addtion, this PPT design contains high resolution images, graphics, etc, that are easily editable and available for immediate download.
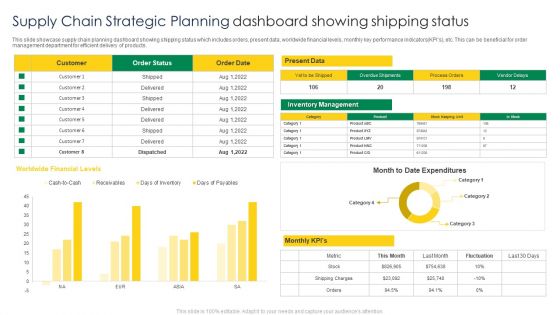
Supply Chain Strategic Planning Dashboard Showing Shipping Status Structure PDF
This slide showcase supply chain planning dashboard showing shipping status which includes orders, present data, worldwide financial levels, monthly key performance indicators KPIs, etc. This can be beneficial for order management department for efficient delivery of products. Showcasing this set of slides titled Supply Chain Strategic Planning Dashboard Showing Shipping Status Structure PDF. The topics addressed in these templates are Worldwide Financial Levels, Present Data, Customer. All the content presented in this PPT design is completely editable. Download it and make adjustments in color, background, font etc. as per your unique business setting.
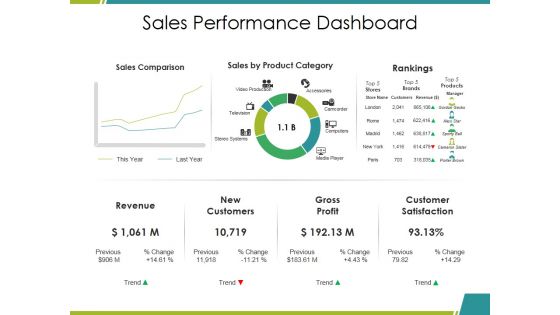
Sales Performance Dashboard Ppt PowerPoint Presentation Infographics Mockup
This is a sales performance dashboard ppt powerpoint presentation infographics mockup. This is a three stage process. The stages in this process are sales comparison, sales by product category, rankings, revenue, gross profit.

Project Management Dashboard Budget Ppt PowerPoint Presentation Slides Templates
This is a project management dashboard budget ppt powerpoint presentation slides templates. This is a two stage process. The stages in this process are finanace, management, strategy, analysis, marketing.
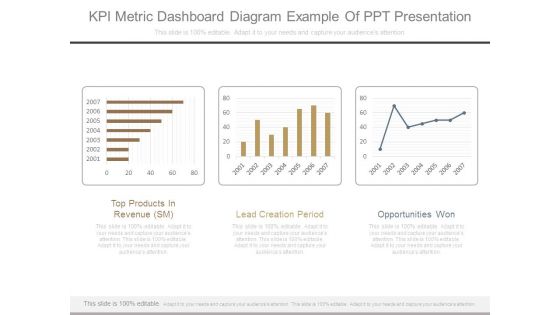
Kpi Metric Dashboard Diagram Example Of Ppt Presentation
This is a kpi metric dashboard diagram example of ppt presentation. This is a three stage process. The stages in this process are top products in revenue sm, lead creation period, opportunities won.
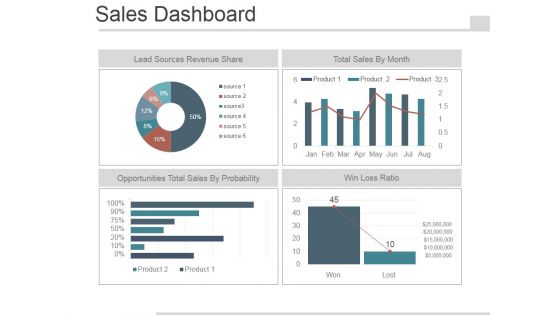
Sales Dashboard Slide Template 2 Ppt PowerPoint Presentation Images
This is a sales dashboard slide template 2 ppt powerpoint presentation images. This is a four stage process. The stages in this process are lead sources revenue share, total sales by month, opportunities total sales by probability, win loss ratio.
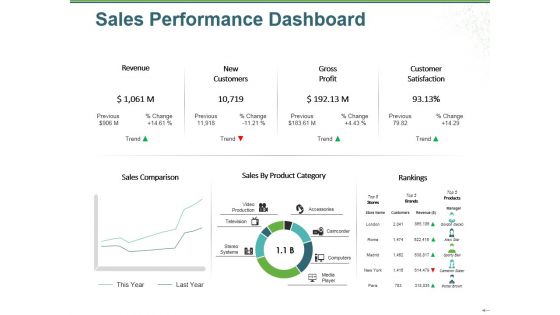
Sales Performance Dashboard Ppt PowerPoint Presentation Outline File Formats
This is a sales performance dashboard ppt powerpoint presentation outline file formats. This is a three stage process. The stages in this process are revenue, new customers, gross profit, customer satisfaction, rankings.

Sales Performance Dashboard Top Opportunities Ppt PowerPoint Presentation Layouts Template
This is a sales performance dashboard top opportunities ppt powerpoint presentation layouts template. This is a eight stage process. The stages in this process are revenue, new customer, gross profit, customer satisfaction, brand profitability.
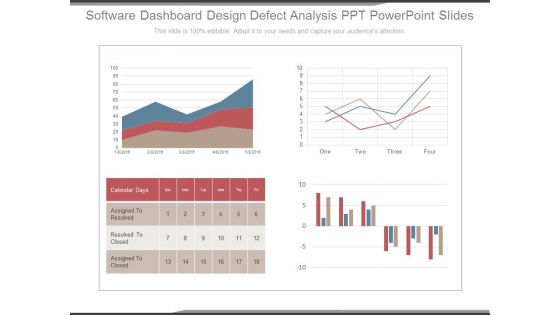
Software Dashboard Design Defect Analysis Ppt Powerpoint Slides
This is a software dashboard design defect analysis ppt powerpoint slides. This is a four stage process. The stages in this process are calendar days, assigned to resolved, resolved to closed, assigned to closed.
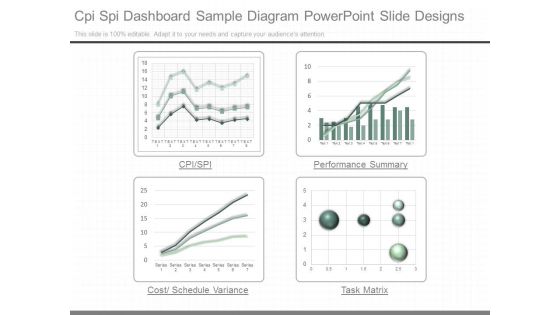
Cpi Spi Dashboard Sample Diagram Powerpoint Slide Designs
This is a cpi spi dashboard sample diagram powerpoint slide designs. This is a four stage process. The stages in this process are cpi spi, performance summary, cost schedule variance, task matrix.

Loyalty Program Performance Dashboard Ppt PowerPoint Presentation Pictures Clipart
This is a loyalty program performance dashboard ppt powerpoint presentation pictures clipart. This is a six stage process. The stages in this process are axis title, award level, sum, active contents, channel.

Project Management Dashboard Planning Ppt PowerPoint Presentation Ideas Graphics Design
This is a project management dashboard planning ppt powerpoint presentation ideas graphics design. This is a four stage process. The stages in this process are business, management, marketing, percentage.
Project Management Dashboard Testing Ppt PowerPoint Presentation Icon File Formats
This is a project management dashboard testing ppt powerpoint presentation icon file formats. This is a three stage process. The stages in this process are business, management, marketing, percentage.
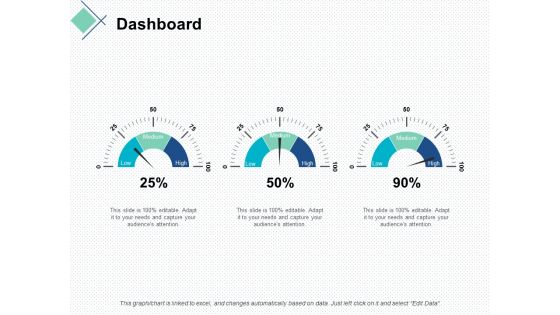
dashboard marketing business ppt powerpoint presentation gallery slide portrait
This is a dashboard marketing business ppt powerpoint presentation gallery slide portrait. This is a three stage process. The stages in this process are finance, marketing, management, investment, analysis.

Employee Engagement Dashboard Ppt PowerPoint Presentation Professional File Formats
This is a employee engagement dashboard ppt powerpoint presentation professional file formats. This is a four stage process. The stages in this process are finance, marketing, management, investment, analysis.

Project Tasks Status Dashboard Ppt PowerPoint Presentation Backgrounds
This is a project tasks status dashboard ppt powerpoint presentation backgrounds. This is a two stage process. The stages in this process are complete tasks, tasks in progress, not started tasks.

 Home
Home