Financial Chart

Data Comparison And Analysis Chart Ppt Powerpoint Presentation File Background Images
This is a data comparison and analysis chart ppt powerpoint presentation file background images. This is a four stage process. The stages in this process are data presentation, content presentation, information presentation.
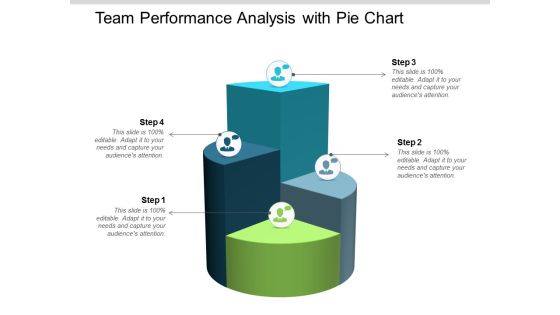
Team Performance Analysis With Pie Chart Ppt Powerpoint Presentation Infographic Template Slideshow
This is a team performance analysis with pie chart ppt powerpoint presentation infographic template slideshow. This is a four stage process. The stages in this process are team performance, member performance, group performance.

Losers Gainers Chart Arrows Marketing PowerPoint Templates And PowerPoint Themes 1012
Deliver amazing Presentations with our above template which contains an image of Losers and Gainers chart arrows. This image depicts the concept of stock market. This image has been conceived to enable you to emphatically communicate your ideas in your Business and Financial PPT presentation. Deliver amazing presentations to mesmerize your audience.
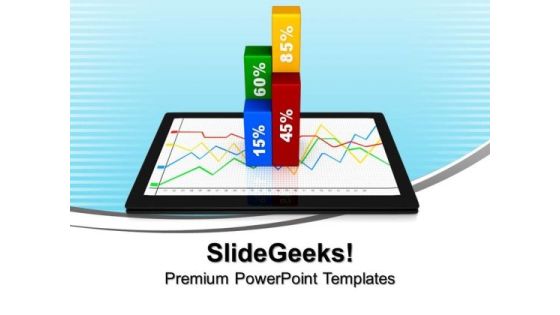
Business Percentage Chart On Tablet PowerPoint Templates And PowerPoint Themes 1012
Deliver amazing Presentations with our above template which contains an image of business chart on tablet. This image represents the concept of marketing and financial accounting. Adjust the above image in your PPT presentations to visually support your content in your Business PPT slideshows economy and statistics PPT presentations. Go ahead add charm and personality to your presentations with our stunning templates.
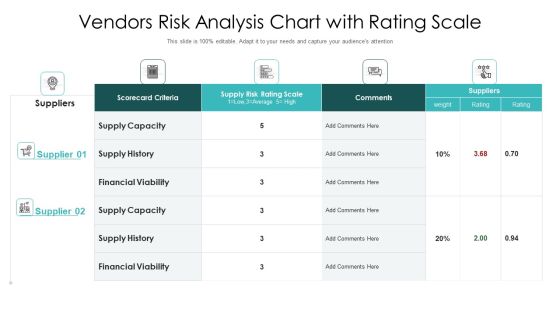
Vendors Risk Analysis Chart With Rating Scale Ppt PowerPoint Presentation Styles Show PDF
Pitch your topic with ease and precision using this vendors risk analysis chart with rating scale ppt powerpoint presentation styles show pdf. This layout presents information on supply history, financial viability, scorecard criteria. It is also available for immediate download and adjustment. So, changes can be made in the color, design, graphics or any other component to create a unique layout.

One Page Plan Chart With Critical View Objectives Ppt PowerPoint Presentation Pictures Images PDF
Presenting this set of slides with name one page plan chart with critical view objectives ppt powerpoint presentation pictures images pdf. The topics discussed in these slides are core values, core purpose, critical few objectives, financial view, customer view, operational view, people view. This is a completely editable PowerPoint presentation and is available for immediate download. Download now and impress your audience.
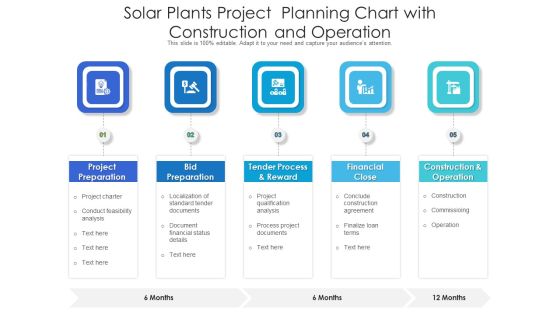
Solar Plants Project Planning Chart With Construction And Operation Ppt Styles Brochure PDF
Showcasing this set of slides titled solar plants project planning chart with construction and operation ppt styles brochure pdf. The topics addressed in these templates are project preparation, financial close, construction and operation. All the content presented in this PPT design is completely editable. Download it and make adjustments in color, background, font etc. as per your unique business setting.

3 Vendor Groups Comparative Assessment Chart For Outsourcing Service Selection Designs PDF
Pitch your topic with ease and precision using this 3 vendor groups comparative assessment chart for outsourcing service selection designs pdf. This layout presents information on financial management, agile process, strategic planning. It is also available for immediate download and adjustment. So, changes can be made in the color, design, graphics or any other component to create a unique layout.

Project Strategy Chart With Market Development Ppt PowerPoint Presentation Visual Aids Deck
Presenting this set of slides with name project strategy chart with market development ppt powerpoint presentation visual aids deck. The topics discussed in these slides are financial system, description, project management, talent, market development. This is a completely editable PowerPoint presentation and is available for immediate download. Download now and impress your audience.
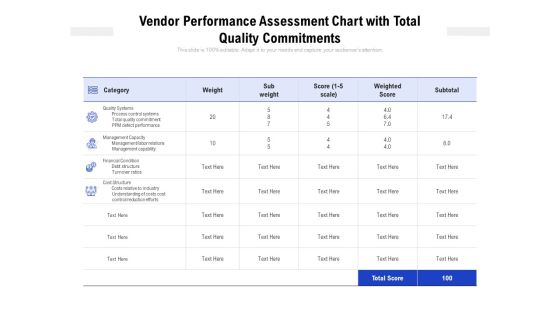
Vendor Performance Assessment Chart With Total Quality Commitments Ppt PowerPoint Presentation Pictures Demonstration PDF
Presenting this set of slides with name vendor performance assessment chart with total quality commitments ppt powerpoint presentation pictures demonstration pdf. The topics discussed in these slides are management capacity, quality systems, financial condition, cost structure. This is a completely editable PowerPoint presentation and is available for immediate download. Download now and impress your audience.
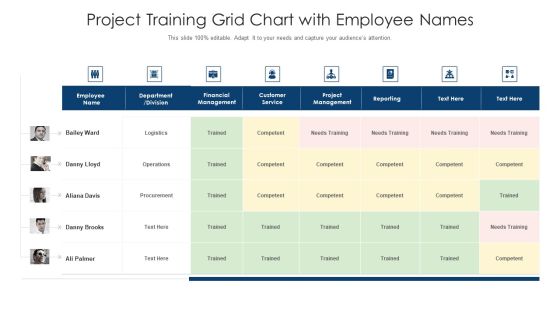
Project Training Grid Chart With Employee Names Ppt PowerPoint Presentation Gallery Outfit PDF
Showcasing this set of slides titled project training grid chart with employee names ppt powerpoint presentation gallery outfit pdf. The topics addressed in these templates are customer service, project management, financial management. All the content presented in this PPT design is completely editable. Download it and make adjustments in color, background, font etc. as per your unique business setting.

Technical Team Training Chart With Leadership Ppt PowerPoint Presentation File Graphics Design PDF
Showcasing this set of slides titled technical team training chart with leadership ppt powerpoint presentation file graphics design pdf. The topics addressed in these templates are financial acumen, project management, customer service. All the content presented in this PPT design is completely editable. Download it and make adjustments in color, background, font etc. as per your unique business setting.
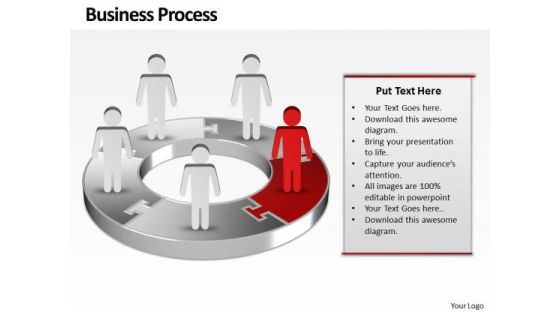
Ppt Red Men Standing On Business PowerPoint Theme Pie Chart Templates
PPT red men standing on business powerpoint theme pie chart Templates-Use this graphical approach to represent global business issues such as financial data, stock market Exchange, increase in sales, corporate presentations and more.-PPT red men standing on business powerpoint theme pie chart Templates-3d, arrow, background, blue, chart, circle, circular, clipart, colorful, connection, continuity, cycle, cyclic, diagram, direction, flow, graph, icon, illustration, isolated, loop, motion, process, progress, recycle, ring, round, step, sticker, symbol, teamwork, template, turn, vector

Budget And Actual Costs Variance Comparison Chart Ppt PowerPoint Presentation Show Graphics Example PDF
This slide illustrates graphical representation of cost variance. It includes monthly data table of financial year 2021 with budget and actual costs etc.Showcasing this set of slides titled Budget And Actual Costs Variance Comparison Chart Ppt PowerPoint Presentation Show Graphics Example PDF. The topics addressed in these templates are Budget And Actual, Costs Variance, Comparison Chart. All the content presented in this PPT design is completely editable. Download it and make adjustments in color, background, font etc. as per your unique business setting.
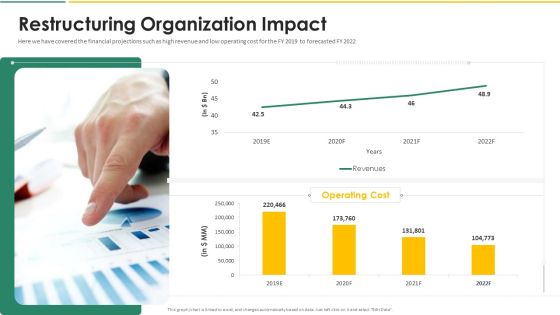
Organization Chart And Corporate Model Transformation Restructuring Organization Impact Structure PDF
Here we have covered the financial projections such as high revenue and low operating cost for the FY 2019 to forecasted FY 2022. Deliver and pitch your topic in the best possible manner with this organization chart and corporate model transformation restructuring organization impact structure pdf. Use them to share invaluable insights on restructuring organization impact and impress your audience. This template can be altered and modified as per your expectations. So, grab it now.

Organizational Structure Chart With President And Directors Ppt PowerPoint Presentation Layouts Diagrams PDF
Persuade your audience using this organizational structure chart with president and directors ppt powerpoint presentation layouts diagrams pdf. This PPT design covers six stages, thus making it a great tool to use. It also caters to a variety of topics including marketing team, financial manager, projects, organizational. Download this PPT design now to present a convincing pitch that not only emphasizes the topic but also showcases your presentation skills.

Business Hierarchy Chart With Governance Ppt PowerPoint Presentation File Model PDF
Persuade your audience using this business hierarchy chart with governance ppt powerpoint presentation file model pdf. This PPT design covers five stages, thus making it a great tool to use. It also caters to a variety of topics including financial services, planning and management, risk and digital assurance. Download this PPT design now to present a convincing pitch that not only emphasizes the topic but also showcases your presentation skills.
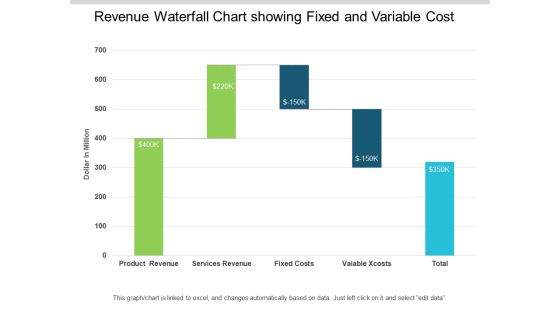
Revenue Waterfall Chart Showing Fixed And Variable Cost Ppt PowerPoint Presentation Infographic Template Images
This is a revenue waterfall chart showing fixed and variable cost ppt powerpoint presentation infographic template images. This is a five stage process. The stages in this process are sales waterfall, waterfall chart, business.

Waterfall Chart With Merchandising Sales Cost And Net Revenue Ppt PowerPoint Presentation Summary Show
This is a waterfall chart with merchandising sales cost and net revenue ppt powerpoint presentation summary show. This is a three stage process. The stages in this process are sales waterfall, waterfall chart, business.

Clustered Bar Chart Percentage Product Ppt PowerPoint Presentation Portfolio Example Introduction
This is a clustered bar chart percentage product ppt powerpoint presentation portfolio example introduction. This is a three stage process. The stages in this process are area chart, finance, marketing, management, investment.

Column Chart Template 2 Ppt PowerPoint Presentation Infographic Template Example Introduction
This is a column chart template 2 ppt powerpoint presentation infographic template example introduction. This is a two stage process. The stages in this process are column chart, finance, analysis, marketing, strategy.
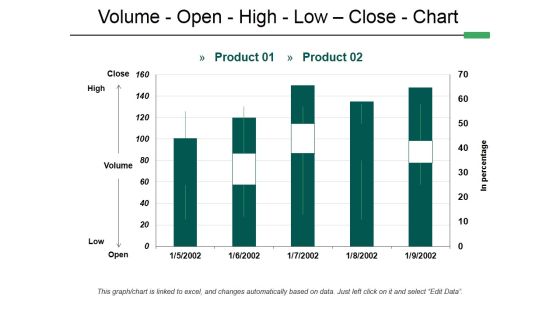
Volume Open High Low Close Chart Ppt PowerPoint Presentation Infographic Template Guidelines
This is a volume open high low close chart ppt powerpoint presentation infographic template guidelines. This is a two stage process. The stages in this process are volume, open, high, low, close, chart.

Area Chart Finance Marketing Ppt PowerPoint Presentation Infographic Template Master Slide
This is a area chart finance marketing ppt powerpoint presentation infographic template master slide. This is a three stage process. The stages in this process are area chart, finance, marketing, analysis, investment.
Waterfall Chart Showing Effective Pricing And Profitability Insight Ppt PowerPoint Presentation Icon Graphics
This is a waterfall chart showing effective pricing and profitability insight ppt powerpoint presentation icon graphics. This is a seven stage process. The stages in this process are sales waterfall, waterfall chart, business.

Volume Open High Low Close Chart Ppt PowerPoint Presentation Pictures Slideshow
This is a volume open high low close chart ppt powerpoint presentation pictures slideshow. This is a two stage process. The stages in this process are volume, open, high, low, close, chart.
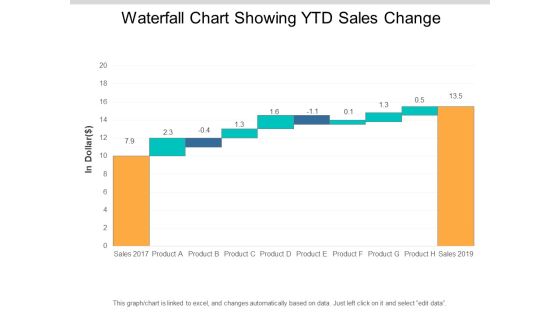
Waterfall Chart Showing Ytd Sales Change Ppt PowerPoint Presentation Professional Format
This is a waterfall chart showing ytd sales change ppt powerpoint presentation professional format. This is a ten stage process. The stages in this process are sales waterfall, waterfall chart, business.

Waterfall Chart With Sales Overheads Interest And Depreciation Ppt PowerPoint Presentation File Display
This is a waterfall chart with sales overheads interest and depreciation ppt powerpoint presentation file display. This is a eight stage process. The stages in this process are sales waterfall, waterfall chart, business.

Gantt Chart For Mergers And Acquisitions Strategy Due Diligence Brochure PDF
The following slide showcases mergers and acquisitions Gantt chart for end-to-end from integration planning through closing. It presents information related to organization, employees, taxes, etc. Showcasing this set of slides titled Gantt Chart For Mergers And Acquisitions Strategy Due Diligence Brochure PDF. The topics addressed in these templates are Organization, Financial Items, Employees. All the content presented in this PPT design is completely editable. Download it and make adjustments in color, background, font etc. as per your unique business setting.

Bubble Chart Companys Business Model Canvas Ppt PowerPoint Presentation Professional Slide Portrait
This is a bubble chart companys business model canvas ppt powerpoint presentation professional slide portrait. This is a three stage process. The stages in this process are.
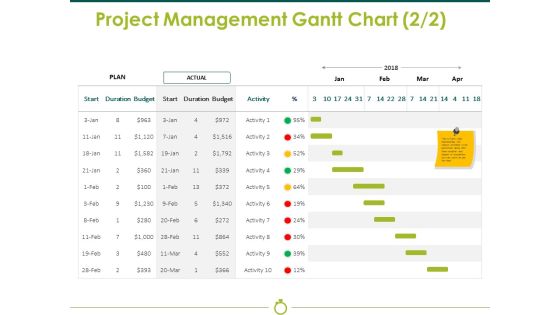
Project Management Gantt Chart Template 2 Ppt PowerPoint Presentation Show Styles
This is a project management gantt chart template 2 ppt powerpoint presentation show styles. This is a two stage process. The stages in this process are plan, actual, budget, duration, start.

Volume High Low Close Chart Ppt PowerPoint Presentation Visual Aids Slides
This is a volume high low close chart ppt powerpoint presentation visual aids slides. This is a two stage process. The stages in this process are bar graph, marketing, strategy, finance, planning.
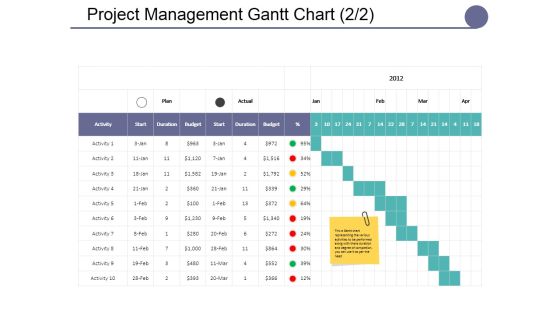
Project Management Gantt Chart Template Ppt PowerPoint Presentation Summary Master Slide
This is a project management gantt chart template ppt powerpoint presentation summary master slide. This is a seven stage process. The stages in this process are lists, table, data, management, marketing.

Volume Open High Low Close Chart Ppt PowerPoint Presentation Ideas Graphics Example
This is a volume open high low close chart ppt powerpoint presentation ideas graphics example. This is a five stage process. The stages in this process are business, bar graph, stock, cost, market.

Project Management Gantt Chart Template 1 Ppt PowerPoint Presentation Gallery Graphics Template
This is a project management gantt chart template 1 ppt powerpoint presentation gallery graphics template. This is a two stage process. The stages in this process are start, duration, complete, business, finance.

Volume Open High Low Close Chart Ppt PowerPoint Presentation File Graphics Template
This is a volume open high low close chart ppt powerpoint presentation file graphics template. This is a two stage process. The stages in this process are close, high, volume, low, open, product.

Data Collection And Analysis Control Chart Ppt PowerPoint Presentation Summary Templates
This is a data collection and analysis control chart ppt powerpoint presentation summary templates. This is a one stage process. The stages in this process are business, marketing, point label, upper limit, lower limit.

Clustered Column Line Chart Finance Ppt PowerPoint Presentation Inspiration Design Templates
This is a clustered column line chart finance ppt powerpoint presentation inspiration design templates. This is a three stage process. The stages in this process are finance, analysis, business, investment, marketing.
Volume High Low Close Chart Ppt PowerPoint Presentation Icon Graphics Pictures
This is a volume high low close chart ppt powerpoint presentation icon graphics pictures. This is a two stage process. The stages in this process are high, volume, low.

Volume Open High Low Close Chart Ppt PowerPoint Presentation Professional Format
This is a volume open high low close chart ppt powerpoint presentation professional format. This is a five stage process. The stages in this process are business, marketing, strategy, finance, planning.

Volume Open High Low Close Chart Ppt PowerPoint Presentation Layouts Background Image
This is a volume open high low close chart ppt powerpoint presentation layouts background image. This is a two stage process. The stages in this process are close, high, volume, low, open.
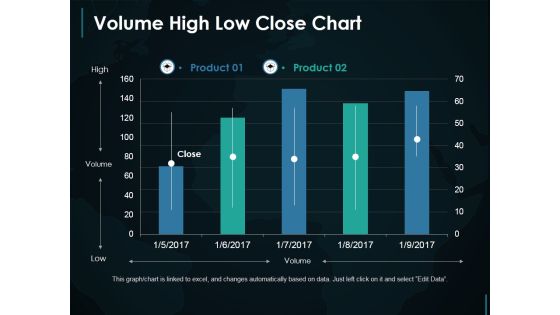
Volume High Low Close Chart Ppt PowerPoint Presentation Slides Example File
This is a volume high low close chart ppt powerpoint presentation slides example file. This is a two stage process. The stages in this process are high, volume, low.
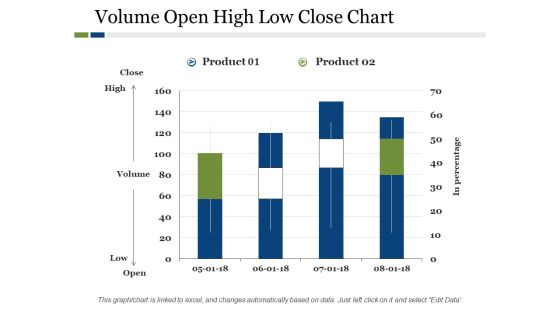
Volume Open High Low Close Chart Ppt PowerPoint Presentation Outline Mockup
This is a volume open high low close chart ppt powerpoint presentation outline mockup. This is a two stage process. The stages in this process are product, high, low, in percentage, volume.

Volume Open High Low Close Chart Ppt PowerPoint Presentation Model Ideas
This is a volume open high low close chart ppt powerpoint presentation model ideas. This is a five stage process. The stages in this process are finance, marketing, analysis, business, investment.

Volume Open High Low Close Chart Ppt PowerPoint Presentation Pictures Tips
This is a volume open high low close chart ppt powerpoint presentation pictures tips. This is a three stage process. The stages in this process are high, volume, low, open, business.

Volume Open High Low Close Chart Finance Ppt PowerPoint Presentation Gallery Graphic Tips
This is a volume open high low close chart finance ppt powerpoint presentation gallery graphic tips. This is a two stage process. The stages in this process are finance, analysis, business, investment, marketing.

Volume Open High Low Close Chart Finance Ppt PowerPoint Presentation Professional Background Image
This is a volume open high low close chart finance ppt powerpoint presentation professional background image. This is a four stage process. The stages in this process are finance, analysis, business, investment, marketing.

Volume Open High Low Close Chart Finance Ppt PowerPoint Presentation Model Graphic Images
This is a volume open high low close chart finance ppt powerpoint presentation model graphic images. This is a three stage process. The stages in this process are finance, analysis, business, investment, marketing.
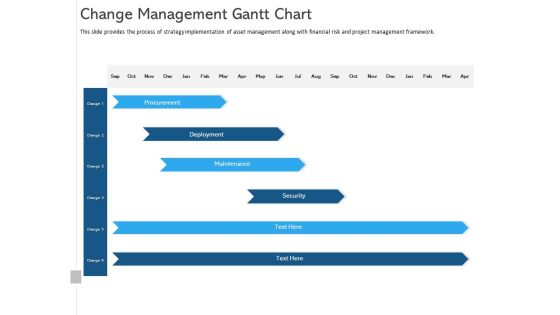
ALM Optimizing The Profit Generated By Your Assets Change Management Gantt Chart Themes PDF
This slide provides the process of strategy implementation of asset management along with financial risk and project management framework. Deliver and pitch your topic in the best possible manner with this alm optimizing the profit generated by your assets change management gantt chart themes pdf. Use them to share invaluable insights on procurement, deployment, maintenance, security and impress your audience. This template can be altered and modified as per your expectations. So, grab it now.
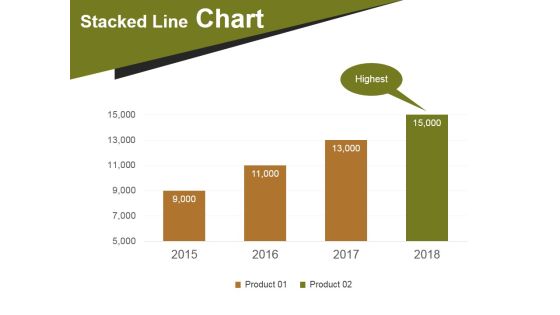
Stacked Line Chart Template 1 Ppt PowerPoint Presentation Infographic Template Layout
This is a stacked line chart template 1 ppt powerpoint presentation infographic template layout. This is a four stage process. The stages in this process are stacked line chart, highest, product.

Data Collection And Analysis Control Chart Ppt PowerPoint Presentation Slide Download
This is a data collection and analysis control chart ppt powerpoint presentation slide download. This is a three stage process. The stages in this process are line chart, finance, marketing, management, investment.
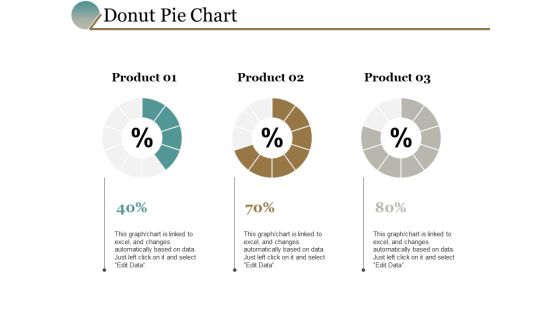
Donut Pie Chart Finance Management Ppt PowerPoint Presentation Portfolio Graphics Design
This is a donut pie chart finance management ppt powerpoint presentation portfolio graphics design. This is a three stage process. The stages in this process are pie chart, finance, marketing, business, analysis.

Org Chart Of A Company With Managers Name Ppt PowerPoint Presentation Layouts Ideas
Presenting this set of slides with name org chart of a company with managers name ppt powerpoint presentation layouts ideas. This is a four stage process. The stages in this process are assets systems, regularly services, infrastructure, information services, financial services, strategic planning, development services, community development. This is a completely editable PowerPoint presentation and is available for immediate download. Download now and impress your audience.

Customer Service Vertical Flow Chart Ppt PowerPoint Presentation File Styles PDF
Persuade your audience using this customer service vertical flow chart ppt powerpoint presentation file styles pdf. This PPT design covers one stages, thus making it a great tool to use. It also caters to a variety of topics including technical department, financial department, customer service. Download this PPT design now to present a convincing pitch that not only emphasizes the topic but also showcases your presentation skills.

5 Years Revenue Comparative Analysis Chart Icon Ppt Inspiration Diagrams PDF
Presenting 5 Years Revenue Comparative Analysis Chart Icon Ppt Inspiration Diagrams PDF to dispense important information. This template comprises three stages. It also presents valuable insights into the topics including 5 Years, Revenue Comparative, Analysis Chart, Icon. This is a completely customizable PowerPoint theme that can be put to use immediately. So, download it and address the topic impactfully.

Deferred Revenue Expenses Chart Vector Icon Ppt PowerPoint Presentation File Format PDF
Presenting deferred revenue expenses chart vector icon ppt powerpoint presentation file format pdf to dispense important information. This template comprises three stages. It also presents valuable insights into the topics including deferred revenue expenses chart vector icon. This is a completely customizable PowerPoint theme that can be put to use immediately. So, download it and address the topic impactfully.

Cost Optimization Action Plan With Pie Chart And Dollar Sign Rules PDF
Presenting cost optimization action plan with pie chart and dollar sign rules pdf to dispense important information. This template comprises four stages. It also presents valuable insights into the topics including cost optimization action plan with pie chart and dollar sign. This is a completely customizable PowerPoint theme that can be put to use immediately. So, download it and address the topic impactfully.
Fuel Increasing Prices Chart Vector Icon Ppt PowerPoint Presentation File Slide Download PDF
Presenting fuel increasing prices chart vector icon ppt powerpoint presentation file slide download pdf to dispense important information. This template comprises three stages. It also presents valuable insights into the topics including fuel increasing prices chart vector icon. This is a completely customizable PowerPoint theme that can be put to use immediately. So, download it and address the topic impactfully.

Chart With Growth Arrow Icon Showing Investment Maturity Ppt PowerPoint Presentation File Tips PDF
Presenting chart with growth arrow icon showing investment maturity ppt powerpoint presentation file tips pdf to dispense important information. This template comprises three stages. It also presents valuable insights into the topics including chart with growth arrow icon showing investment maturity. This is a completely customizable PowerPoint theme that can be put to use immediately. So, download it and address the topic impactfully.
Scatter Chart With Dots Vector Icon Ppt PowerPoint Presentation Infographics Files PDF
Presenting scatter chart with dots vector icon ppt powerpoint presentation infographics files pdf to dispense important information. This template comprises three stages. It also presents valuable insights into the topics including scatter chart with dots vector icon. This is a completely customizable PowerPoint theme that can be put to use immediately. So, download it and address the topic impactfully.
Dollar Note Icon With Chart Depicting Business Expenses Ppt PowerPoint Presentation Gallery Model PDF
Presenting dollar note icon with chart depicting business expenses ppt powerpoint presentation gallery model pdf to dispense important information. This template comprises three stages. It also presents valuable insights into the topics including dollar note icon with chart depicting business expenses. This is a completely customizable PowerPoint theme that can be put to use immediately. So, download it and address the topic impactfully.
 Home
Home