Financial Chart
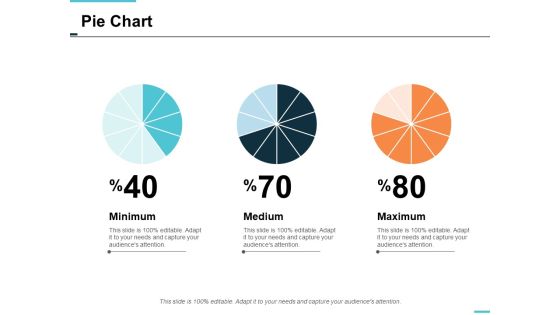
pie chart finance ppt powerpoint presentation styles skills
This is a pie chart finance ppt powerpoint presentation styles skills. This is a three stage process. The stages in this process are finance, marketing, management, investment, analysis.

Clustered Chart Finance Ppt PowerPoint Presentation Summary Guide
This is a clustered chart finance ppt powerpoint presentation summary guide. This is a three stage process. The stages in this process are finance, marketing, management, investment, analysis.

Combo Chart Finance Ppt PowerPoint Presentation Portfolio Guidelines
This is a combo chart finance ppt powerpoint presentation portfolio guidelines. This is a three stage process. The stages in this process are finance, marketing, management, investment, analysis.
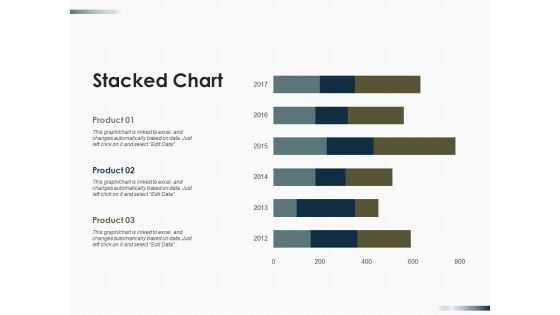
Stacked Chart Finance Ppt PowerPoint Presentation Outline Infographics
This is a stacked chart finance ppt powerpoint presentation outline infographics. This is a three stage process. The stages in this process are finance, marketing, management, investment, analysis.

Stacked Column Chart Ppt PowerPoint Presentation Slides Files
This is a stacked column chart ppt powerpoint presentation slides files. This is a three stage process. The stages in this process are percentage, product, business, marketing.

Area Chart Contribution Ppt PowerPoint Presentation Gallery Structure
This is a area chart contribution ppt powerpoint presentation gallery structure. This is a three stage process. The stages in this process are business, management, strategy, analysis, marketing.

Donut Chart Management Ppt Powerpoint Presentation Slides Aids
This is a donut chart management ppt powerpoint presentation slides aids. This is a six stage process. The stages in this process are finance, marketing, management, investment, analysis.

Column Chart Finance Ppt Powerpoint Presentation Summary Visuals
This is a column chart finance ppt powerpoint presentation summary visuals. This is a four stage process. The stages in this process are finance, marketing, management, investment, analysis.

area chart finance ppt powerpoint presentation layouts ideas
This is a area chart finance ppt powerpoint presentation layouts ideas. This is a three stage process. The stages in this process are finance, marketing, management, investment, analysis.
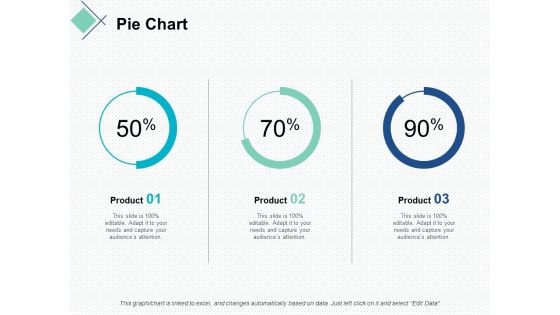
pie chart finance marketing ppt powerpoint presentation slides demonstration
This is a pie chart finance marketing ppt powerpoint presentation slides demonstration. This is a stage process. The stages in this process are finance, marketing, management, investment, analysis.

Column Chart Finance Ppt Powerpoint Presentation Gallery Maker
This is a column chart finance ppt powerpoint presentation gallery maker. This is a two stage process. The stages in this process are finance, marketing, management, investment, analysis.

Stock Chart Graph Ppt PowerPoint Presentation Ideas Demonstration
This is a stock chart graph ppt powerpoint presentation ideas demonstration. This is a three stage process. The stages in this process are finance, marketing, management, investment, analysis.
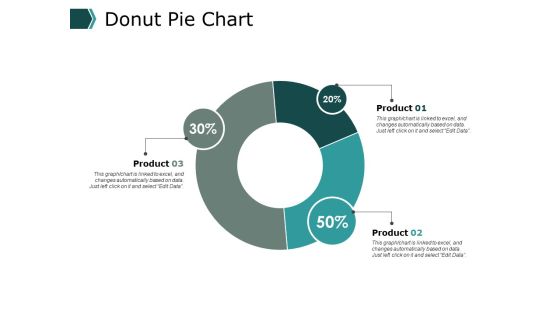
Donut Pie Chart Ppt PowerPoint Presentation Model Deck
This is a donut pie chart ppt powerpoint presentation model deck. This is a three stage process. The stages in this process are finance, marketing, management, investment, analysis.

Column Chart Finance Ppt Powerpoint Presentation Styles Examples
This is a column chart finance ppt powerpoint presentation styles examples. This is a two stage process. The stages in this process are finance, marketing, management, investment, analysis.

Column Chart Finance Ppt PowerPoint Presentation Summary Grid
This is a column chart finance ppt powerpoint presentation summary grid. This is a three stage process. The stages in this process are finance, marketing, management, investment, analysis.

Area Chart Finance Ppt PowerPoint Presentation Summary Structure
This is a area chart finance ppt powerpoint presentation summary structure. This is a two stage process. The stages in this process are finance, marketing, management, investment, analysis.

Pie Chart Finance Ppt PowerPoint Presentation Ideas Templates
This is a pie chart finance ppt powerpoint presentation ideas templates. This is a three stage process. The stages in this process are finance, marketing, management, investment, analysis.
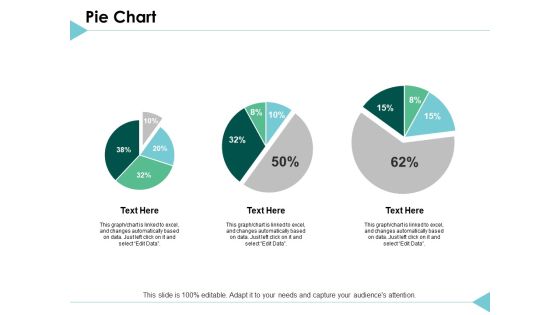
Pie Chart Finance Ppt PowerPoint Presentation Styles Templates
This is a pie chart finance ppt powerpoint presentation styles templates. This is a three stage process. The stages in this process are finance, marketing, analysis, investment, million.

Area Chart Finance Ppt PowerPoint Presentation Outline Structure
This is a area chart finance ppt powerpoint presentation outline structure. This is a three stage process. The stages in this process are finance, marketing, analysis, investment, million.

Clustered Chart Graph Ppt PowerPoint Presentation Gallery Backgrounds
This is a clustered chart graph ppt powerpoint presentation gallery backgrounds. This is a three stage process. The stages in this process are finance, marketing, analysis, investment, million.

Area Chart Finance Ppt PowerPoint Presentation Gallery Information
This is a area chart finance ppt powerpoint presentation gallery information. This is a three stage process. The stages in this process are finance, marketing, analysis, investment, million.

Combo Chart Graph Ppt PowerPoint Presentation Professional Guidelines
This is a combo chart graph ppt powerpoint presentation professional guidelines. This is a three stage process. The stages in this process are finance, marketing, analysis, investment, million.

Pie Chart Bar Ppt PowerPoint Presentation Layouts Examples
This is a pie chart bar ppt powerpoint presentation layouts examples. This is a three stage process. The stages in this process are finance, marketing, analysis, investment, million.

Pie Chart Finance Ppt Powerpoint Presentation Gallery Templates
This is a pie chart finance ppt powerpoint presentation gallery templates. This is a four stage process. The stages in this process are finance, marketing, management, investment, analysis.

Column Chart Finance Ppt Powerpoint Presentation Inspiration Images
This is a column chart finance ppt powerpoint presentation inspiration images. This is a two stage process. The stages in this process are finance, marketing, management, investment, analysis.

Combo Chart Finance Ppt Powerpoint Presentation Ideas Slides
This is a combo chart finance ppt powerpoint presentation ideas slides. This is a three stage process. The stages in this process are finance, marketing, management, investment, analysis.
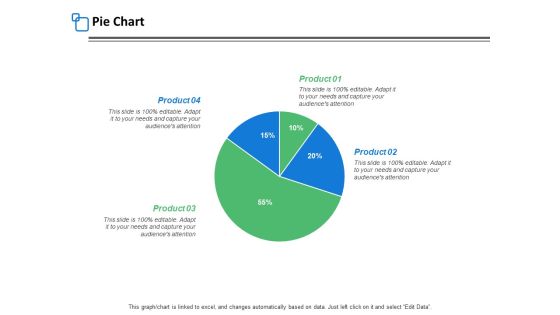
Pie Chart Finance Ppt PowerPoint Presentation Inspiration Templates
This is a pie chart finance ppt powerpoint presentation inspiration templates. This is a four stage process. The stages in this process are finance, marketing, management, investment, analysis.

Monetary Incentive Icon In Programs Chart Ideas PDF
Persuade your audience using this Monetary Incentive Icon In Programs Chart Ideas PDF. This PPT design covers three stages, thus making it a great tool to use. It also caters to a variety of topics including Monetary Incentive Icon, Programs Chart. Download this PPT design now to present a convincing pitch that not only emphasizes the topic but also showcases your presentation skills.

Product Marketing Budget Spend Pie Chart Icon Designs PDF
Presenting Product Marketing Budget Spend Pie Chart Icon Designs PDF to dispense important information. This template comprises Three stages. It also presents valuable insights into the topics including Product Marketing, Budget Spend, Pie Chart Icon. This is a completely customizable PowerPoint theme that can be put to use immediately. So, download it and address the topic impactfully.

Compensation Statement Icon In Incentive Programs Chart Brochure PDF
Presenting Compensation Statement Icon In Incentive Programs Chart Brochure PDF to dispense important information. This template comprises three stages. It also presents valuable insights into the topics including Compensation Statement Icon, Incentive Programs Chart. This is a completely customizable PowerPoint theme that can be put to use immediately. So, download it and address the topic impactfully.
Price Catalogue Chart Icon Of Product Comparison Slides PDF
Presenting price catalogue chart icon of product comparison slides pdf to dispense important information. This template comprises three stages. It also presents valuable insights into the topics including price catalogue chart icon of product comparison. This is a completely customizable PowerPoint theme that can be put to use immediately. So, download it and address the topic impactfully.
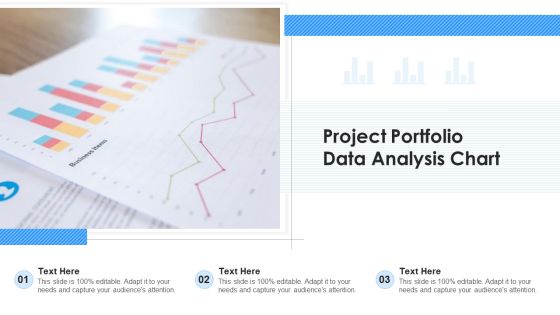
Project Portfolio Data Analysis Chart Ppt Ideas Gallery PDF
Presenting project portfolio data analysis chart ppt ideas gallery pdf to dispense important information. This template comprises three stages. It also presents valuable insights into the topics including project portfolio data analysis chart. This is a completely customizable PowerPoint theme that can be put to use immediately. So, download it and address the topic impactfully.

Reach Your Target Audience Pie Chart Ppt Show Model PDF
This is a reach your target audience pie chart ppt show model pdf template with various stages. Focus and dispense information on four stages using this creative set, that comes with editable features. It contains large content boxes to add your information on topics like pie chart. You can also showcase facts, figures, and other relevant content using this PPT layout. Grab it now.
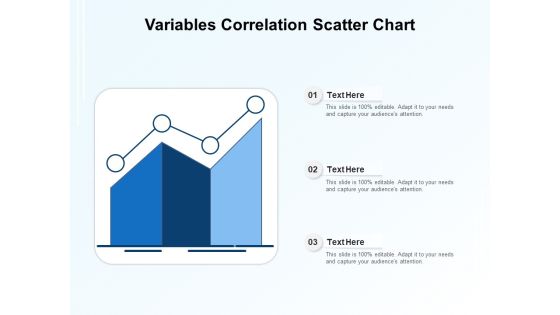
Variables Correlation Scatter Chart Ppt PowerPoint Presentation Model Smartart PDF
Presenting variables correlation scatter chart ppt powerpoint presentation model smartart pdf to dispense important information. This template comprises three stages. It also presents valuable insights into the topics including variables correlation scatter chart. This is a completely customizable PowerPoint theme that can be put to use immediately. So, download it and address the topic impactfully.

Business Objective Presentation Chart Of Provenance Data Download PDF
Presenting business objective presentation chart of provenance data download pdf to dispense important information. This template comprises five stages. It also presents valuable insights into the topics including business objective presentation chart of provenance data. This is a completely customizable PowerPoint theme that can be put to use immediately. So, download it and address the topic impactfully.

Statistical Data Analysis Chart Of Collected Data Formats PDF
Presenting statistical data analysis chart of collected data formats pdf to dispense important information. This template comprises four stages. It also presents valuable insights into the topics including statistical data analysis chart of collected data. This is a completely customizable PowerPoint theme that can be put to use immediately. So, download it and address the topic impactfully.
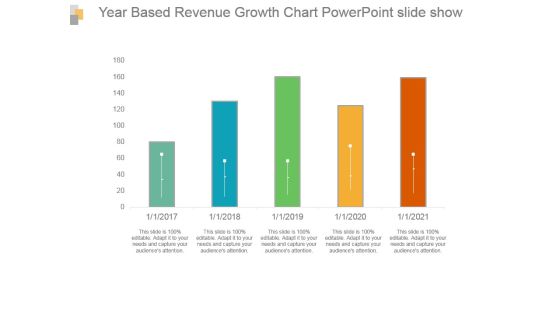
Year Based Revenue Growth Chart Powerpoint Slide Show
This is a year based revenue growth chart powerpoint slide show. This is a five stage process. The stages in this process are bar graph, growth, revenue, year, success.

Column Chart Sample Budget Ppt Ppt PowerPoint Presentation Infographics Brochure
This is a column chart sample budget ppt ppt powerpoint presentation infographics brochure. This is a two stage process. The stages in this process are business, management, strategy, analysis, marketing.

Gantt Chart For Change Management Training Calendar Diagrams PDF
This slide displays Gantt chart for change management training, planning and scheduling in organization. It includes details about target audience, workshops, training and communications. Presenting Gantt Chart For Change Management Training Calendar Diagrams PDF to dispense important information. This template comprises one stages. It also presents valuable insights into the topics including Targeted Audience, Workshops, Training, Communications. This is a completely customizable PowerPoint theme that can be put to use immediately. So, download it and address the topic impactfully.

Scatter Bubble Chart Graph Ppt PowerPoint Presentation Infographic Template Maker
This is a scatter bubble chart graph ppt powerpoint presentation infographic template maker. This is a two stage process. The stages in this process are finance, marketing, management, investment, analysis.

Combo Chart Graph Ppt PowerPoint Presentation Infographic Template Layout Ideas
This is a combo chart graph ppt powerpoint presentation infographic template layout ideas. This is a three stage process. The stages in this process are finance, marketing, analysis, investment, million.

Volume Open High Low Close Chart Ppt PowerPoint Presentation Themes
This is a volume open high low close chart ppt powerpoint presentation themes. This is a five stage process. The stages in this process are high, volume, close, low.

Stacked Line Chart Finance Ppt Powerpoint Presentation Outline Themes
This is a stacked line chart finance ppt powerpoint presentation outline themes. This is a two stage process. The stages in this process are finance, marketing, management, investment, analysis.

Quality Cost Report Trend Chart Ppt PowerPoint Presentation Pictures Themes
This is a quality cost report trend chart ppt powerpoint presentation pictures themes. This is a four stage process. The stages in this process are finance, strategy, marketing, management, business.

Circle Chart For Business Strategy Plan Powerpoint Slides
This PowerPoint template has been designed with four steps circle chart with finance icons. This PPT slide can be used to display business strategy plan. You can download finance PowerPoint template to prepare awesome presentations.

Scatter Bubble Chart Ppt PowerPoint Presentation Diagram Ppt
This is a scatter bubble chart ppt powerpoint presentation diagram ppt. This is a two stage process. The stages in this process are product, in price, highest sale, percentage, business, marketing.

Donut Pie Chart Product Finance Ppt PowerPoint Presentation Diagram Ppt
This is a donut pie chart product finance ppt powerpoint presentation diagram ppt. This is a three stage process. The stages in this process are finance, management, strategy, analysis, marketing.

Bubble Chart Employee Value Proposition Ppt PowerPoint Presentation Icon Sample
This is a bubble chart employee value proposition ppt powerpoint presentation icon sample. This is a two stage process. The stages in this process are business, management, strategy, analysis, marketing.

Combo Chart Marketing Analysis Ppt Powerpoint Presentation Pictures Icons
This is a combo chart marketing analysis ppt powerpoint presentation pictures icons. This is a three stage process. The stages in this process are finance, marketing, management, investment, analysis.

Clustered Bar Chart Finance Ppt Powerpoint Presentation Icon Graphics Template
This is a clustered bar chart finance ppt powerpoint presentation icon graphics template. This is a four stage process. The stages in this process are finance, marketing, management, investment, analysis.

Scatter Bubble Chart Ppt PowerPoint Presentation Inspiration Backgrounds
This is a scatter bubble chart ppt powerpoint presentation inspiration backgrounds. This is a five stage process. The stages in this process are highest sale, in price, business, marketing, success.

Staked Line Chart Ppt PowerPoint Presentation Model Graphics Download
This is a staked line chart ppt powerpoint presentation model graphics download. This is a two stage process. The stages in this process are business, marketing, growth, finance, management.
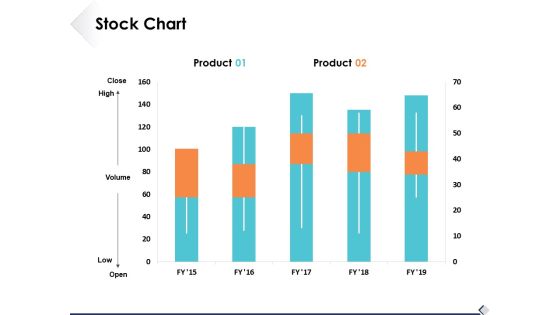
Stock Chart Finance Ppt PowerPoint Presentation Styles Background Image
This is a stock chart finance ppt powerpoint presentation styles background image. This is a two stage process. The stages in this process are analysis, marketing, icons, finance, strategy.

Scatter Bubble Chart Template Ppt PowerPoint Presentation Professional Background
This is a scatter bubble chart template ppt powerpoint presentation professional background. This is a six stage process. The stages in this process are business, marketing, strategy, planning, finance.

Basic Gap Analysis Chart Ppt PowerPoint Presentation Pictures Design Ideas
This is a basic gap analysis chart ppt powerpoint presentation pictures design ideas. This is a five stage process. The stages in this process are business, finance, marketing, analysis, investment.

High Low Close Chart Ppt PowerPoint Presentation Professional Background Images
This is a high low close chart ppt powerpoint presentation professional background images. This is a five stage process. The stages in this process are close, high, volume, low, open.

Volume High Low Close Chart Ppt PowerPoint Presentation Outline Examples
This is a volume high low close chart ppt powerpoint presentation outline examples. This is a five stage process. The stages in this process are high, low, volume, graph, business.

Scatter Bubble Chart Ppt PowerPoint Presentation Infographics Backgrounds
This is a scatter bubble chart ppt powerpoint presentation infographics backgrounds. This is a five stage process. The stages in this process are highest sale, in price, growth, success, business.
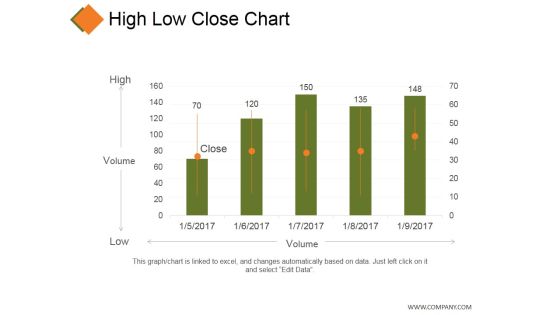
High Low Close Chart Ppt PowerPoint Presentation Model Grid
This is a high low close chart ppt powerpoint presentation model grid. This is a five stage process. The stages in this process are business, high, volume, low, marketing.

Line Bubble Chart Ppt PowerPoint Presentation Professional Infographic Template
This is a line bubble chart ppt powerpoint presentation professional infographic template. This is a five stage process. The stages in this process are product, in price, highest sale, business, finance.
 Home
Home