Financial Chart

Column Chart Ppt PowerPoint Presentation Show Structure
This is a column chart ppt powerpoint presentation show structure. This is a two stage process. The stages in this process are business, financial year in, sales in percentage, marketing, graph.

area chart ppt powerpoint presentation professional elements
This is a area chart ppt powerpoint presentation professional elements. This is a two stage process. The stages in this process are financial year sales in percentage, business, marketing, graph.

Line Chart Ppt PowerPoint Presentation Outline Ideas
This is a line chart ppt powerpoint presentation outline ideas. This is a two stage process. The stages in this process are business, marketing, financial years, sales in percentage, strategy.

Area Chart Ppt PowerPoint Presentation Model Demonstration
This is a area chart ppt powerpoint presentation model demonstration. This is a two stage process. The stages in this process are business, marketing, financial year, in percentage, graph.

Bar Chart Ppt PowerPoint Presentation Icon Demonstration
This is a bar chart ppt powerpoint presentation icon demonstration. This is a seven stage process. The stages in this process are product, sales in percentage, financial year, graph.
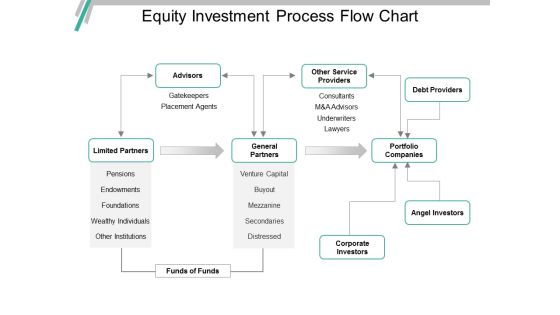
Equity Investment Process Flow Chart Ppt PowerPoint Presentation Ideas
This is a equity investment process flow chart ppt powerpoint presentation ideas. This is a three stage process. The stages in this process are investment, funding, private equity, venture capital.

Bar Chart Ppt PowerPoint Presentation Outline Backgrounds
This is a bar chart ppt powerpoint presentation outline backgrounds. This is a one stage process. The stages in this process are sales in percentage, financial years, product, bar graph, finance.

Four Steps Pyramid Diagram Templates PowerPoint Chart
We present our Four steps Pyramid Diagram templates powerpoint Chart.Present our Finance PowerPoint Templates because this template helps you to delve on these thoughts and brief your team on the value of your depth of understanding of the subject. Download our Business PowerPoint Templates because it helps you to explain your plans in all earnest to your colleagues and raise the bar for all. Use our Shapes PowerPoint Templates because to achieve sureshot success you need to come together at the right time, place and manner. Use our Pyramids PowerPoint Templates because pyramids are a symbol of the continuity of life. Download our Signs PowerPoint Templates because this diagram provides trainers a tool to teach the procedure in a highly visual, engaging way.Use these PowerPoint slides for presentations relating to 3d, Abstract, Business, Chart, Color, Colorful, Concept, Conceptual, Diagram, Financial, Four, Graph, Green, Growth, Hierarchy, Illustration, Increase, Isolated, Layer, Level, Multi-Colored, Multicolored, Orange, Part, Performance, Polychrome, Presentation, Progress, Pyramid, Red, Render, Rendered, Report, Results, Section, Shape, Sliced, Stage, Statistics, Status, Step, Success, Triangle. The prominent colors used in the PowerPoint template are Blue, Red, Green. We assure you our Four steps Pyramid Diagram templates powerpoint Chart are Awesome. Customers tell us our Diagram PowerPoint templates and PPT Slides are Radiant. The feedback we get is that our Four steps Pyramid Diagram templates powerpoint Chart are Clever. We assure you our Conceptual PowerPoint templates and PPT Slides are Fashionable. People tell us our Four steps Pyramid Diagram templates powerpoint Chart are incredible easy to use. We assure you our Colorful PowerPoint templates and PPT Slides are specially created by a professional team with vast experience. They diligently strive to come up with the right vehicle for your brilliant Ideas.

Bar Chart Ppt PowerPoint Presentation Icon Information
This is a bar chart ppt powerpoint presentation icon information. This is a one stage process. The stages in this process are product, sales in percentage, financial years, bar graph, growth.

Column Chart Ppt PowerPoint Presentation Layouts Tips
This is a column chart ppt powerpoint presentation layouts tips. This is a six stage process. The stages in this process are sales in percentage, financial year, bar graph, growth, success.

Line Chart Ppt PowerPoint Presentation Styles Themes
This is a line chart ppt powerpoint presentation styles themes. This is a two stage process. The stages in this process are business, marketing, financial years, sales in percentage.

Line Chart Ppt PowerPoint Presentation Pictures Templates
This is a line chart ppt powerpoint presentation pictures templates. This is a two stage process. The stages in this process are sales in percentage, financial years, business, marketing, growth.

Column Chart Ppt PowerPoint Presentation Slides Smartart
This is a column chart ppt powerpoint presentation slides smartart. This is a two stage process. The stages in this process are sales in percentage, financial year in, business, growth, strategy.
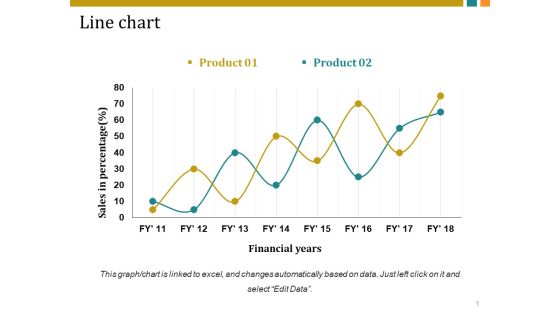
Line Chart Ppt PowerPoint Presentation Inspiration Vector
This is a line chart ppt powerpoint presentation inspiration vector. This is a two stage process. The stages in this process are sales in percentage, financial years, business, marketing, growth.

Column Chart Ppt PowerPoint Presentation Gallery Background
This is a column chart ppt powerpoint presentation gallery background. This is a two stage process. The stages in this process are product, sales in percentage, financial year, graph, success.

Column Chart Ppt PowerPoint Presentation Outline Styles
This is a column chart ppt powerpoint presentation outline styles. This is a two stage process. The stages in this process are sales in percentage, financial year in, business, marketing, graph.

Column Chart Ppt PowerPoint Presentation Gallery Design Inspiration
This is a column chart ppt powerpoint presentation gallery design inspiration. This is a two stage process. The stages in this process are column chart, product, sales in percentage, financial years.
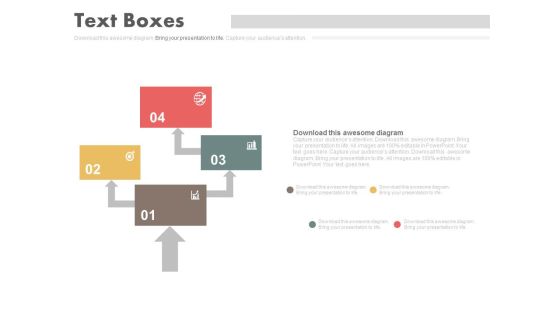
Four Steps Arrow Chart Design Powerpoint Slides
This PowerPoint template has been designed with four steps arrow chart. This PPT slide can be used to prepare presentations for marketing reports and also for financial data analysis. You can download finance PowerPoint template to prepare awesome presentations.

Business Plan Circle Chart Powerpoint Slides Templates
This is a business plan circle chart powerpoint slides templates. This is a six stage process. The stages in this process are information technology plan, human resources plan, production plan, marketing plan, marketing plan, financial plan, management plan.

Area Chart Ppt PowerPoint Presentation Gallery Icons
This is a area chart ppt powerpoint presentation gallery icons. This is a two stage process. The stages in this process are financial year, sales in percentage, product, finance, graph.

Corporate Leadership Skills Chart Presentation Design
This is a corporate leadership skills chart presentation design. This is a six stage process. The stages in this process are planning and organization, social adjustment, advance financial frameworks, management fundamentals, dynamism, strategic skill.

Basic Accounting And Bookkeeping Chart Ppt Slides
This is a basic accounting and bookkeeping chart ppt slides. This is a five stage process. The stages in this process are financial statements, source documents, accounting cycle, journals, ledger, trial balance.

Circular Flow Of Income Chart Ppt Presentation
This is a circular flow of income chart ppt presentation. This is a four stage process. The stages in this process are real estate, government, financial institutions, export import, firms.

Marchandise Management System Chart Ppt Sample
This is a marchandise management system chart ppt sample. This is a seven stage process. The stages in this process are payment management, inspection, marketing, sourcing, channel management, financial management, orders.

Area Chart Ppt PowerPoint Presentation Pictures Files
This is a area chart ppt powerpoint presentation pictures files. This is a two stage process. The stages in this process are product, sales, in percentage, financial year, business.

Line Chart Ppt PowerPoint Presentation Layouts Example
This is a line chart ppt powerpoint presentation layouts example. This is a two stage process. The stages in this process are sales in percentage, product, financial years, growth, success.

Line Chart Ppt PowerPoint Presentation Show Guide
This is a line chart ppt powerpoint presentation show guide. This is a two stage process. The stages in this process are product, sales in percentage, financial years, growth, success.

Column Chart Analysis Ppt PowerPoint Presentation Pictures Sample
Presenting this set of slides with name column chart analysis ppt powerpoint presentation pictures sample. The topics discussed in these slides are column chart, product, financial year, sales, marketing. This is a completely editable PowerPoint presentation and is available for immediate download. Download now and impress your audience.

Cost Comparison Table Chart Powerpoint Slides
Our above PPT slide displays cost comparison table chart. This diagram may be used to display cost comparison and financial analysis. Download this PowerPoint template to leave permanent impression on your audience.

Bar Chart Ppt PowerPoint Presentation Infographic Template Picture
This is a bar chart ppt powerpoint presentation infographic template picture. This is a two stage process. The stages in this process are financial, in percentage, business, marketing, bar chart.

Radar Chart Ppt PowerPoint Presentation Pictures Themes
This is a radar chart ppt powerpoint presentation pictures themes. This is a two stage process. The stages in this process are product, radar chart, finance, business.

Radar Chart Ppt PowerPoint Presentation Styles Themes
This is a radar chart ppt powerpoint presentation styles themes. This is a two stage process. The stages in this process are product, finance, shape, radar chart, business.

Area Chart Ppt PowerPoint Presentation Gallery Information
This is a area chart ppt powerpoint presentation gallery information. This is a two stage process. The stages in this process are product, area chart, business, finance, marketing.

Radar Chart Ppt PowerPoint Presentation Inspiration Rules
This is a radar chart ppt powerpoint presentation inspiration rules. This is a two stage process. The stages in this process are radar chart, business, marketing, finance, management.

Radar Chart Ppt PowerPoint Presentation Background Designs
This is a radar chart ppt powerpoint presentation background designs. This is a two stage process. The stages in this process are radar chart, product, finance, business, shapes.

Radar Chart Ppt PowerPoint Presentation Gallery Templates
This is a radar chart ppt powerpoint presentation gallery templates. This is a two stage process. The stages in this process are radar chart, product, shape, business.

Radar Chart Ppt PowerPoint Presentation Ideas Portrait
This is a radar chart ppt powerpoint presentation ideas portrait. This is a two stage process. The stages in this process are product, radar chart, finance, business, marketing.
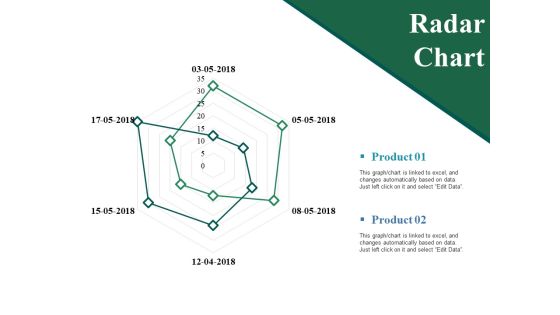
Radar Chart Ppt PowerPoint Presentation Show Guidelines
This is a radar chart ppt powerpoint presentation show guidelines. This is a two stage process. The stages in this process are product, radar chart, business, finance, marketing.

Stock Chart Ppt PowerPoint Presentation Ideas Infographics
This is a stock chart ppt powerpoint presentation ideas infographics. This is a two stage process. The stages in this process are high, volume, low, product, stock chart.
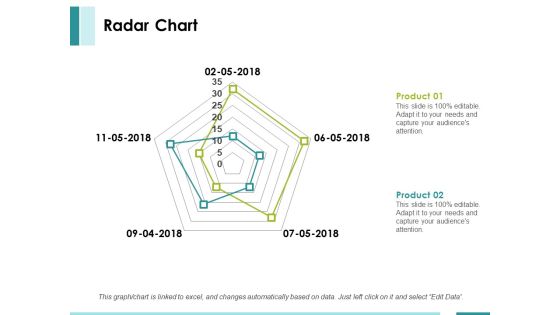
Radar Chart Ppt PowerPoint Presentation Summary Layout
This is a radar chart ppt powerpoint presentation summary layout. This is a two stage process. The stages in this process are product, finance, shape, radar chart, business.

Radar Chart Ppt PowerPoint Presentation File Rules
This is a radar chart ppt powerpoint presentation file rules. This is a two stage process. The stages in this process are product, radar chart, finance.

Bar Chart Ppt PowerPoint Presentation Ideas Deck
This is a bar chart ppt powerpoint presentation ideas deck. This is a two stage process. The stages in this process are product, in percentage, in years, financial, business.
Stock Chart Ppt PowerPoint Presentation Inspiration Icon
This is a stock chart ppt powerpoint presentation inspiration icon. This is a two stage process. The stages in this process are high, volume, low, product, close.
Stock Chart Ppt PowerPoint Presentation Icon Format
This is a stock chart ppt powerpoint presentation icon format. This is a two stage process. The stages in this process are product, close, high, volume, low.
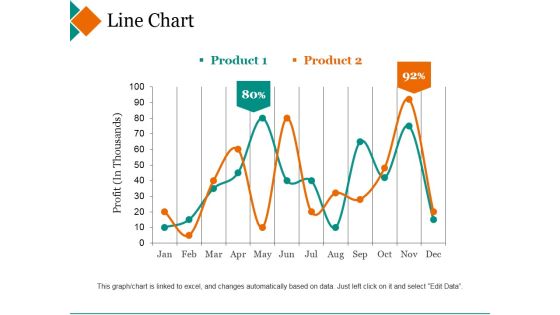
Line Chart Ppt PowerPoint Presentation Inspiration Deck
This is a line chart ppt powerpoint presentation inspiration deck. This is a two stage process. The stages in this process are product, profit, percentage, finance, line graph.
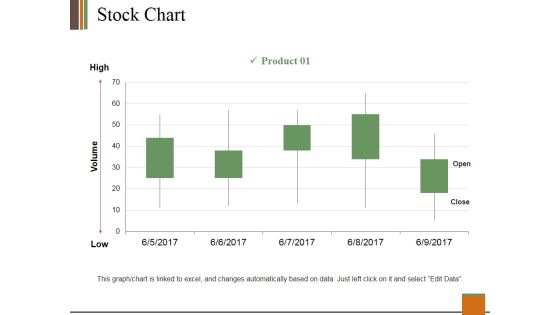
Stock Chart Ppt PowerPoint Presentation Slides Clipart
This is a stock chart ppt powerpoint presentation slides clipart. This is a one stage process. The stages in this process are product, high, volume, low, open, close.

Radar Chart Ppt PowerPoint Presentation Infographics Portfolio
This is a radar chart ppt powerpoint presentation infographics portfolio. This is a two stage process. The stages in this process are product, finance, shapes, business, marketing.

Area Chart Ppt PowerPoint Presentation Professional Grid
This is a area chart ppt powerpoint presentation professional grid. This is a two stage process. The stages in this process are product, sales in percentage, business.

Bar Chart Ppt PowerPoint Presentation Portfolio Inspiration
This is a bar chart ppt powerpoint presentation portfolio inspiration. This is a two stage process. The stages in this process are product, in percentage, in years.

Stock Chart Ppt PowerPoint Presentation Layouts Outfit
This is a stock chart ppt powerpoint presentation layouts outfit. This is a two stage process. The stages in this process are close, high, volume, low, open.

Stock Chart Ppt PowerPoint Presentation Guide
This is a stock chart ppt powerpoint presentation guide. This is a two stage process. The stages in this process are product, close, high, volume, low.

Area Chart Ppt PowerPoint Presentation Summary Model
This is a area chart ppt powerpoint presentation summary model. This is a two stage process. The stages in this process are analysis, finance, marketing, management, investment.

Table Chart For Business Plan Powerpoint Slides
Table chart has been used to design this power point template. This diagram may be used to display business plan. Download this template to leave permanent impression on your audience.
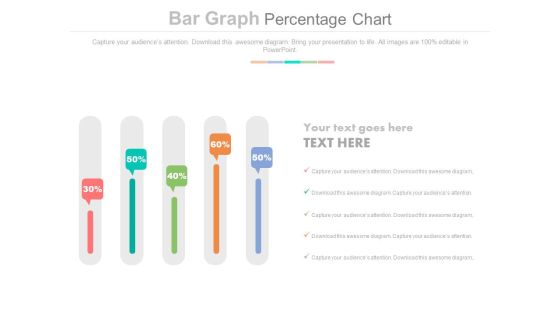
Sliders Percentage Data Chart Powerpoint Slides
This PowerPoint slide has been designed with slider chart and percentage data. This PPT diagram may be used to display business trends. This diagram slide can be used to make impressive presentations.
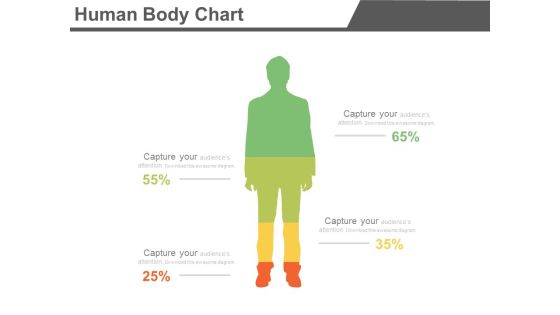
Four Segments Human Body Chart Powerpoint Slides
Create dynamic presentations with our creative template of human body chart with four segments. This diagram may be used to present information in visual manner. Download this template to leave permanent impression on your audience.

Revenue Projections Example Chart Powerpoint Ideas
This is a revenue projections example chart powerpoint ideas. This is a eleven stage process. The stages in this process are brand paid search, non branded paid search, direct load, brand organic search, non brand organic, inbound free links, affiliates, display, comparison shopping, display retargeting, email.

Chart Showing Communication Monitoring Ppt PowerPoint Presentation Model Slideshow
Presenting this set of slides with name chart showing communication monitoring ppt powerpoint presentation model slideshow. The topics discussed in these slides are revenue trend, bar chart, financial. This is a completely editable PowerPoint presentation and is available for immediate download. Download now and impress your audience.

Variance Analysis Line Chart Ppt PowerPoint Presentation Styles Graphics Example
Presenting this set of slides with name variance analysis line chart ppt powerpoint presentation styles graphics example. The topics discussed in these slides are revenue trend, bar chart, financial. This is a completely editable PowerPoint presentation and is available for immediate download. Download now and impress your audience.

Unconstrained Investment Selection Process Chart Diagram
This is a unconstrained investment selection process chart diagram. This is a six stage process. The stages in this process are portfolio decision making, fundamental financial principles, client centric, economic guidance, optimal investment selection, strategic and tactical, allocation, market trends and cycles.

Banking Investment Management Chart Powerpoint Slides
This is a banking investment management chart powerpoint slides. This is a nine stage process. The stages in this process are tax planning, estate and trust planning, us banking and credit capabilities, us business owner planning, banking and cash management, financial literacy, credit strategies, philanthropy, investment management, private client, private client, team.
 Home
Home