Financial Chart

Line Chart Ppt PowerPoint Presentation Gallery Rules
This is a line chart ppt powerpoint presentation gallery rules. This is a two stage process. The stages in this process are financial years, product, sales in percentage, line chart, growth.

Column Chart Ppt PowerPoint Presentation Slides Show
This is a column chart ppt powerpoint presentation slides show. This is a two stage process. The stages in this process are column chart, product, sales in percentage, financial year, growth.

Sequence Of Market Analysis 5 Stages Business Financial Planning PowerPoint Templates
We present our sequence of market analysis 5 stages business financial planning PowerPoint templates.Download our Flow Charts PowerPoint Templates because You can Give birth to your ideas with our PowerPoint Templates and Slides. See them grow big and strong in record time. Use our Process and Flows PowerPoint Templates because Our PowerPoint Templates and Slides will let your team Walk through your plans. See their energy levels rise as you show them the way. Use our Business PowerPoint Templates because You can Rise to the occasion with our PowerPoint Templates and Slides. You will bring your audience on their feet in no time. Use our Marketing PowerPoint Templates because You can Zap them with our PowerPoint Templates and Slides. See them reel under the impact. Present our Shapes PowerPoint Templates because Our PowerPoint Templates and Slides are endowed to endure. Ideas conveyed through them will pass the test of time.Use these PowerPoint slides for presentations relating to Step, process, elements, square, brochure, flow, blank, process, plan, concept, workflow, diagram, rotation,presentation, glossy, bright, symbol, diagram, brochure, element, marketing, blockdiagram, development, abstract, management, manage, illustration,connection, chart, flowchart, strategy, round, section, forum, solution, processchart, direction, design, text, module, workflow diagram, flow diagram, circular flow, present. The prominent colors used in the PowerPoint template are Green lime, White, Gray.

Competitive Analysis Scatter Chart Radar Chart Ppt PowerPoint Presentation Model
This is a competitive analysis scatter chart radar chart ppt powerpoint presentation model. This is a eight stage process. The stages in this process are users interface, data import, example, pricing, support, update, tutorials, easy to use.
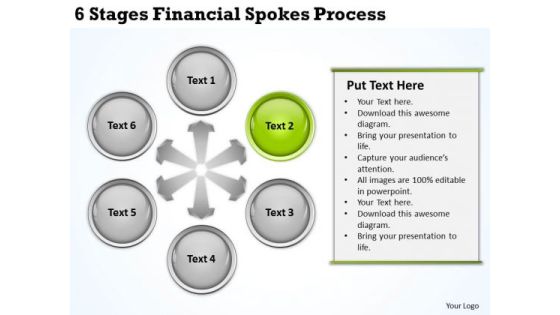
Business Context Diagram 6 Stages Financial Spokes Process Ppt PowerPoint Slides
We present our business context diagram 6 stages financial spokes process ppt PowerPoint Slides.Download our Circle Charts PowerPoint Templates because Our PowerPoint Templates and Slides ensures Effective communication. They help you put across your views with precision and clarity. Use our Ring Charts PowerPoint Templates because Our PowerPoint Templates and Slides are the chords of your song. String them along and provide the lilt to your views. Use our Arrows PowerPoint Templates because You can Connect the dots. Fan expectations as the whole picture emerges. Download and present our Process and Flows PowerPoint Templates because Our PowerPoint Templates and Slides has conjured up a web of all you need with the help of our great team. Use them to string together your glistening ideas. Present our Marketing PowerPoint Templates because It can Conjure up grand ideas with our magical PowerPoint Templates and Slides. Leave everyone awestruck by the end of your presentation.Use these PowerPoint slides for presentations relating to Arrows, blank, business, central, centralized, chart, circle, circular,circulation, concept, conceptual, converging, design, diagram, empty, executive,icon, idea, illustration, management, map, mapping, mba, model, numbers,organization, outwards, pointing, procedure, process, radial, radiating,relationship, resource, sequence, sequential, seven, square, strategy. The prominent colors used in the PowerPoint template are Gray, Green, White.
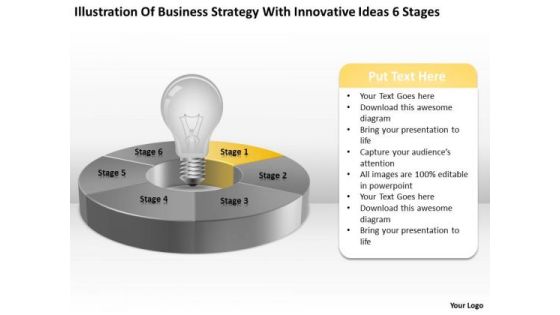
With Innovative Ideas 6 Stages Ppt 2 Financial Business Plan Template PowerPoint Templates
We present our with innovative ideas 6 stages ppt 2 financial business plan template PowerPoint templates.Present our Ring Charts PowerPoint Templates because Our PowerPoint Templates and Slides will weave a web of your great ideas. They are gauranteed to attract even the most critical of your colleagues. Present our Process and Flows PowerPoint Templates because Our PowerPoint Templates and Slides come in all colours, shades and hues. They help highlight every nuance of your views. Download our Light Bulbs PowerPoint Templates because These PowerPoint Templates and Slides will give the updraft to your ideas. See them soar to great heights with ease. Download our Marketing PowerPoint Templates because You can Double your output with our PowerPoint Templates and Slides. They make beating deadlines a piece of cake. Download and present our Flow Charts PowerPoint Templates because It will get your audience in sync.Use these PowerPoint slides for presentations relating to Pie, chart, graphic, white, bulb, vector, symbol, lightbulb, diagram, blue, light, process, element, traditional, idea, graph, illustration, icon, energy, circular,round, clipart, planning, design, clip, set, infographic, transparency, art, background, conceptual. The prominent colors used in the PowerPoint template are Yellow, Gray, Black.

5 Hexagon Shaped In Circle Venn Diagram Ppt Business Financial Plan PowerPoint Templates
We present our 5 hexagon shaped in circle venn diagram ppt business financial plan PowerPoint templates.Download and present our Circle Charts PowerPoint Templates because Our PowerPoint Templates and Slides will let you Leave a lasting impression to your audiences. They possess an inherent longstanding recall factor. Use our Marketing PowerPoint Templates because These PowerPoint Templates and Slides will give the updraft to your ideas. See them soar to great heights with ease. Use our Business PowerPoint Templates because our PowerPoint Templates and Slides are the string of your bow. Fire of your ideas and conquer the podium. Download our Shapes PowerPoint Templates because Our PowerPoint Templates and Slides help you pinpoint your timelines. Highlight the reasons for your deadlines with their use. Download and present our Process and Flows PowerPoint Templates because Our PowerPoint Templates and Slides are Clear and concise. Use them and dispel any doubts your team may have.Use these PowerPoint slides for presentations relating to Flow, chart, business concept, step, future, business, vector, sign, presentation, symbol, template, process, flowchart, report, title, shape, abstract, illustration, system, strategy, project, catalog, round, color full, web, solution, design, color, text, motion, hexagon, structure . The prominent colors used in the PowerPoint template are Pink, Gray, Black.

Consistent Demonstration Of Financial Process Using Stage 8 What Are Business PowerPoint Templates
We present our consistent demonstration of financial process using stage 8 what are business PowerPoint templates.Use our Circle Charts PowerPoint Templates because, It gives a core idea about various enveloping layers. Use our Arrows PowerPoint Templates because,Generation of sales is the core of any business. Use our Shapes PowerPoint Templates because, You know what it takes to keep it fit and healthy. Use our Business PowerPoint Templates because,The great Bald headed Eagle embodies your personality. The eagle eye to seize upon the smallest of oppurtunities Use our Finance PowerPoint Templates because,You envisage some areas of difficulty in the near future. The overall financial situation could be a source of worry.Use these PowerPoint slides for presentations relating to 3d, arrow, background, banner, business, chart, circle, diagram, direction, element, financial, flow, gradient, illustration, isolated, marketing, mirrored, placeholder, presentation, process, steps, success, teamwork, vector. The prominent colors used in the PowerPoint template are Yellow, Brown, Red. People tell us our consistent demonstration of financial process using stage 8 what are business PowerPoint templates are Wistful. The feedback we get is that our background PowerPoint templates and PPT Slides are Cheerful. People tell us our consistent demonstration of financial process using stage 8 what are business PowerPoint templates will help you be quick off the draw. Just enter your specific text and see your points hit home. Presenters tell us our circle PowerPoint templates and PPT Slides are Functional. The feedback we get is that our consistent demonstration of financial process using stage 8 what are business PowerPoint templates are Adorable. Professionals tell us our chart PowerPoint templates and PPT Slides are Upbeat.

Line Chart Ppt PowerPoint Presentation Gallery Example Introduction
This is a line chart ppt powerpoint presentation portfolio shapes. This is a two stage process. The stages in this process are product, financial years, line chart.

Demand Planning Chart Ppt Inspiration
This is a demand planning chart ppt inspiration. This is a one stage process. The stages in this process are jan, feb, mar, apr, may, jun, jul, aug, sep, oct, nov, dec.

Fusion Chart Examples Presentation Powerpoint
This is a fusion chart examples presentation powerpoint. This is a two stage process. The stages in this process are page visits summary for the year 2009, brand, page visits geography for last 60 minutes, brand, qtr.

Bar Chart Ppt PowerPoint Presentation Professional Graphics Download
This is a bar chart ppt powerpoint presentation professional graphics download. This is a seven stage process. The stages in this process are sales in percentage, financial years, chart, business.
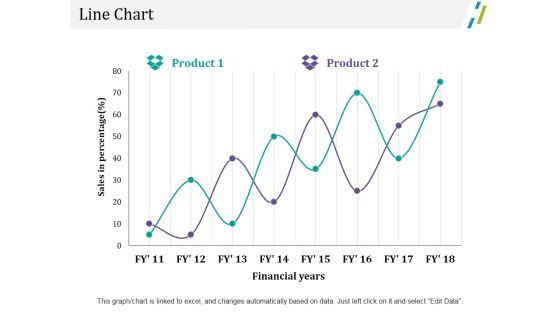
Line Chart Ppt PowerPoint Presentation Outline File Formats
This is a line chart ppt powerpoint presentation outline file formats. This is a two stage process. The stages in this process are business, marketing, sales in percentage, financial years, chart.
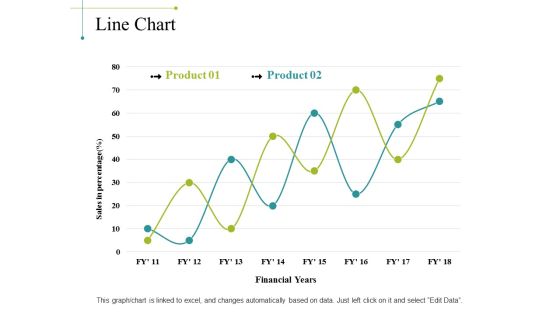
Line Chart Ppt PowerPoint Presentation Portfolio Background Image
This is a line chart ppt powerpoint presentation portfolio background image. This is a two stage process. The stages in this process are sales in percentage, financial years, chart, business, marketing, finance.
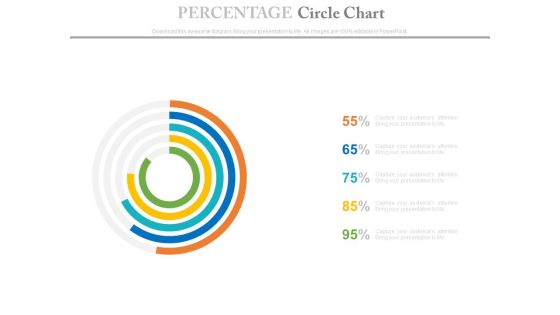
Percentage Data Circle Chart Powerpoint Slides
This PowerPoint template has been designed with circle chart. Download this PPT chart to depict financial ratio analysis. This PowerPoint slide is of great help in the business sector to make realistic presentations and provides effective way of presenting your newer thoughts.

Percentage Data Growth Chart Powerpoint Slides
This PowerPoint template has been designed with percentage data growth chart. Download this PPT chart to depict financial ratio analysis. This PowerPoint slide is of great help in the business sector to make realistic presentations and provides effective way of presenting your newer thoughts.
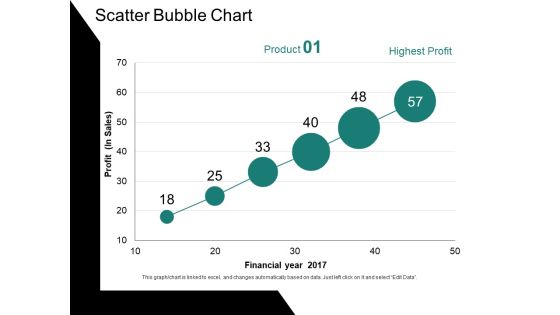
Scatter Bubble Chart Ppt PowerPoint Presentation Ideas Gallery
This is a scatter bubble chart ppt powerpoint presentation ideas gallery. This is a six stage process. The stages in this process are profit, financial year, chart, business, growth.

Line Chart Ppt PowerPoint Presentation Layout
This is a line chart ppt powerpoint presentation layout. This is a two stage process. The stages in this process are business, marketing, line chart, finance, management.

Bar Chart Ppt PowerPoint Presentation Model Good
This is a bar chart ppt powerpoint presentation model good. This is a seven stage process. The stages in this process are business, marketing, bar, success, finance.

Bar Chart Ppt PowerPoint Presentation Infographics Skills
This is a bar chart ppt powerpoint presentation infographics skills. This is a seven stage process. The stages in this process are business, marketing, strategy, finance, bar.

Line Chart Ppt PowerPoint Presentation Professional
This is a line chart ppt powerpoint presentation professional. This is a two stage process. The stages in this process are business, marketing, growth, finance, line chart.

Area Chart Ppt PowerPoint Presentation Examples
This is a area chart ppt powerpoint presentation examples. This is a two stage process. The stages in this process are business, marketing, area chart, analysis, management.
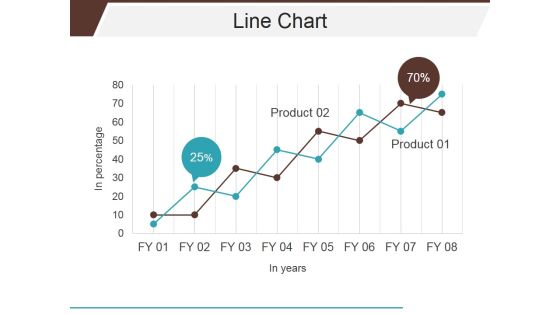
Line Chart Ppt PowerPoint Presentation Layouts Gridlines
This is a line chart ppt powerpoint presentation layouts gridlines. This is a two stage process. The stages in this process are business, marketing, line chart, analysis, growth.

Column Chart Ppt PowerPoint Presentation Show Pictures
This is a column chart ppt powerpoint presentation show pictures. This is a six stage process. The stages in this process are business, finance, planning, years, marketing.

Stock Chart Ppt PowerPoint Presentation Information
This is a stock chart ppt powerpoint presentation information. This is a five stage process. The stages in this process are projects, marketing, high, volume, low.
Line Chart Ppt PowerPoint Presentation Icon Deck
This is a line chart ppt powerpoint presentation icon deck. This is a two stage process. The stages in this process are business, management, growth, product, finance.

Line Chart Ppt PowerPoint Presentation Portfolio Inspiration
This is a line chart ppt powerpoint presentation portfolio inspiration. This is a two stage process. The stages in this process are business, marketing, strategy, planning, finance.
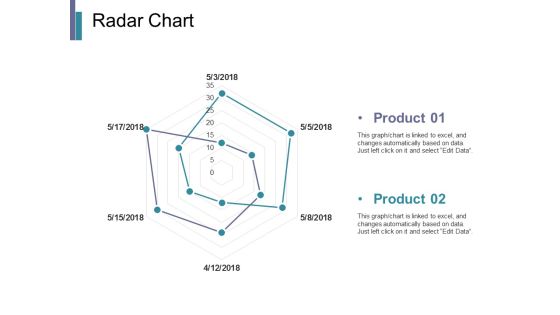
Radar Chart Ppt PowerPoint Presentation Infographics Pictures
This is a radar chart ppt powerpoint presentation infographics pictures. This is a two stage process. The stages in this process are business, marketing, strategy, planning, finance.

Bubble Chart Ppt PowerPoint Presentation Portfolio Show
This is a bubble chart ppt powerpoint presentation portfolio show. This is a two stage process. The stages in this process are business, marketing, strategy, planning, finance.

Bar Chart Ppt PowerPoint Presentation Layouts
This is a bar chart ppt powerpoint presentation layouts. This is a four stage process. The stages in this process are business, strategy, marketing, analysis, finance.

Combo Chart Ppt PowerPoint Presentation Inspiration Images
This is a combo chart ppt powerpoint presentation inspiration images. This is a three stage process. The stages in this process are market size, in years, growth rate, product.
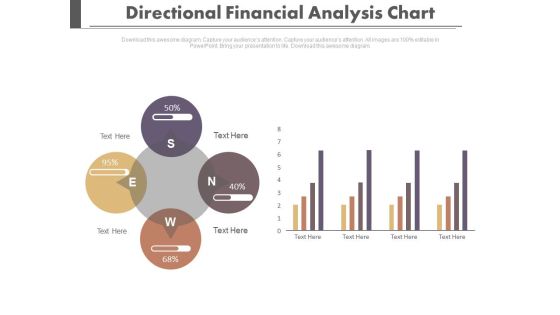
Four Directions Circular Analysis Chart Powerpoint Slides
Our professionally designed business diagram is as an effective tool for communicating business strategy. It contains four directional circular charts. Above slide is also suitable to display financial planning and strategy.
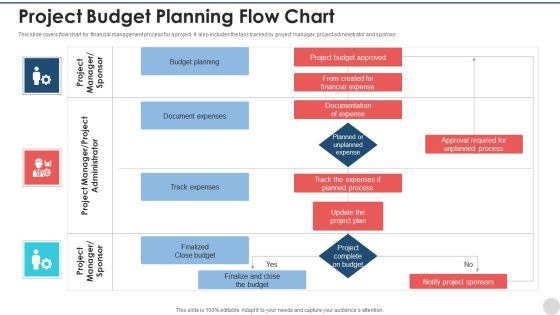
Project Budget Planning Flow Chart Inspiration PDF
This slide covers flow chart for financial management process for a project. It also includes the task tracked by project manager, project administrator and sponsor. Showcasing this set of slides titled project budget planning flow chart inspiration pdf. The topics addressed in these templates are budget planning, document expenses, track expenses, finalized close budget. All the content presented in this PPT design is completely editable. Download it and make adjustments in color, background, font etc. as per your unique business setting.

Pie Chart Infographic Diagram Powerpoint Templates
This Power Point template has been designed with pie chart infographic. This business slide is useful to present financial ratio analysis. Use this diagram to make business presentation. Illustrate these thoughts with this slide.

Pie Chart Ppt PowerPoint Presentation Gallery Skills
This is a pie chart ppt powerpoint presentation gallery skills. This is a four stage process. The stages in this process are business, strategy, analysis, marketing, pie chart.

Column Chart Ppt PowerPoint Presentation File Formats
This is a column chart ppt powerpoint presentation file formats. This is a six stage process. The stages in this process are business, marketing, strategy, finance, bar.

Combo Chart Ppt PowerPoint Presentation Pictures Graphics
This is a combo chart ppt powerpoint presentation pictures graphics. This is a eight stage process. The stages in this process are business, marketing, strategy, finance, bar.
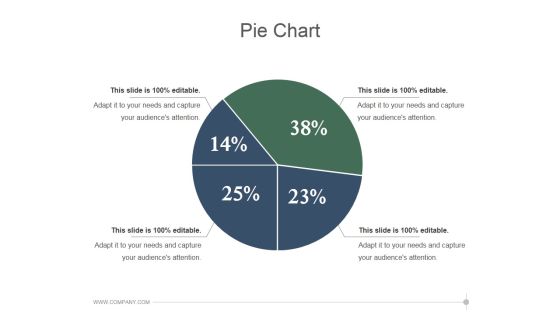
Pie Chart Ppt PowerPoint Presentation Designs
This is a pie chart ppt powerpoint presentation designs. This is a four stage process. The stages in this process are business, marketing, planning, pie chart, finance.

Pie Chart Ppt PowerPoint Presentation Graphics
This is a pie chart ppt powerpoint presentation graphics. This is a six stage process. The stages in this process are business, marketing, finance, pie chart, management.

Line Chart Ppt PowerPoint Presentation Summary
This is a line chart ppt powerpoint presentation summary. This is a two stage process. The stages in this process are business, marketing, line chart, finance, markers.
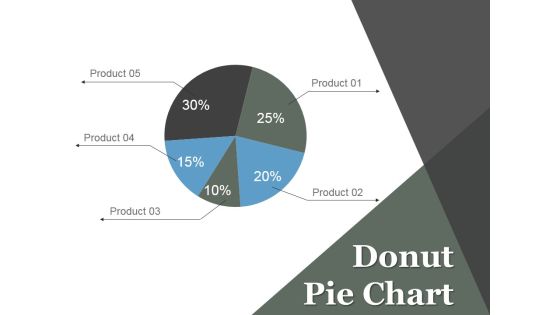
Donut Pie Chart Ppt PowerPoint Presentation Model
This is a donut pie chart ppt powerpoint presentation model. This is a five stage process. The stages in this process are finance, donut, marketing, product, chart, management.

Combo Chart Ppt PowerPoint Presentation Microsoft
This is a combo chart ppt powerpoint presentation microsoft. This is a three stage process. The stages in this process are business, marketing, growth, product, chart.
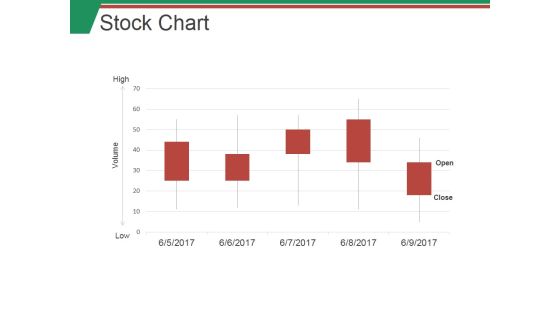
Stock Chart Ppt PowerPoint Presentation Professional Slide
This is a stock chart ppt powerpoint presentation professional slide. This is a five stage process. The stages in this process are graph, finance, analysis, planning, marketing.

Pie Chart Ppt PowerPoint Presentation Visual Aids
This is a pie chart ppt powerpoint presentation visual aids. This is a five stage process. The stages in this process are pie, finance, analysis, division, percentage.

Pie Chart Ppt PowerPoint Presentation Deck
This is a pie chart ppt powerpoint presentation deck. This is a five stage process. The stages in this process are business, pie, finance, percentage, product.
Pie Chart Ppt PowerPoint Presentation Layouts Icons
This is a pie chart ppt powerpoint presentation layouts icons. This is a three stage process. The stages in this process are business, finance, analysis, marketing, strategy.
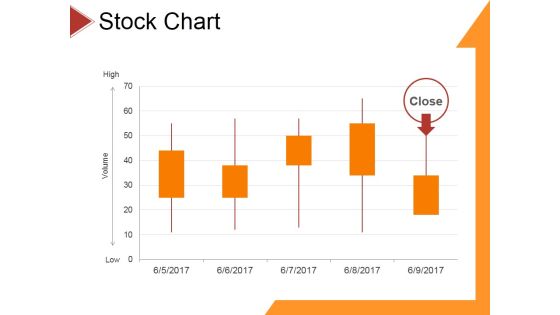
Stock Chart Ppt PowerPoint Presentation File Ideas
This is a stock chart ppt powerpoint presentation file ideas. This is a five stage process. The stages in this process are business, strategy, analysis, pretention, finance.
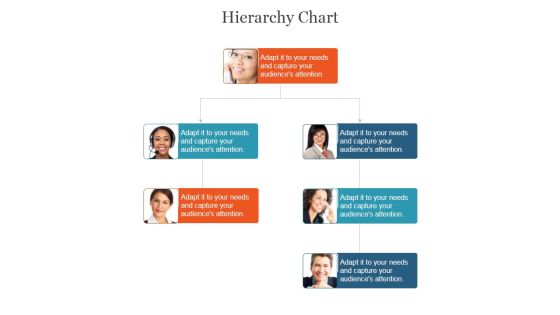
Hierarchy Chart Ppt PowerPoint Presentation Sample
This is a hierarchy chart ppt powerpoint presentation sample. This is a three stage process. The stages in this process are business, marketing, management, strategy, planning.

Column Chart Ppt PowerPoint Presentation Graphics
This is a column chart ppt powerpoint presentation graphics. This is a nine stage process. The stages in this process are business, marketing, growth, timeline, planning.

Area Chart Ppt PowerPoint Presentation Example File
This is a area chart ppt powerpoint presentation example file. This is a two stage process. The stages in this process are business, marketing, growth, planning, management.

Column Chart Ppt PowerPoint Presentation Visuals
This is a column chart ppt powerpoint presentation visuals. This is a two stage process. The stages in this process are business, marketing, growth, strategy, planning.

Donut Pie Chart Ppt PowerPoint Presentation Show
This is a donut pie chart ppt powerpoint presentation show. This is a seven stage process. The stages in this process are business, strategy, analysis, marketing, finance, donut.

Area Chart Ppt PowerPoint Presentation Show Portfolio
This is a area chart ppt powerpoint presentation show portfolio. This is a two stage process. The stages in this process are business, product, finance, growth, management.

Doughnut Chart Ppt PowerPoint Presentation Styles Backgrounds
This is a doughnut chart ppt powerpoint presentation styles backgrounds. This is a three stage process. The stages in this process are percentage, finance, business, marketing, strategy.

Area Chart Ppt PowerPoint Presentation Icon Microsoft
This is a area chart ppt powerpoint presentation icon microsoft. This is a two stage process. The stages in this process are business, strategy, analysis, planning, area chart.

Bubble Chart Ppt PowerPoint Presentation Portfolio Files
This is a bubble chart ppt powerpoint presentation portfolio files. This is a five stage process. The stages in this process are profit, bubble chart, in percentage.

Stock Chart Ppt PowerPoint Presentation Slides Guidelines
This is a stock chart ppt powerpoint presentation slides guidelines. This is a five stage process. The stages in this process are stock chart, volume, low, close, open.

Bubble Chart Ppt PowerPoint Presentation Slide
This is a bubble chart ppt powerpoint presentation slide. This is a eight stage process. The stages in this process are business, marketing, finance, chart, management.
Financial Graph Economic Growth Vector Icon Ppt PowerPoint Presentation Infographics Graphic Images Cpb
This is a financial graph economic growth vector icon ppt powerpoint presentation infographics graphic images cpb. This is a three stage process. The stages in this process are bar chart icon, bar graph icon, data chart icon.
Three Bars For Financial Analysis Vector Icon Ppt PowerPoint Presentation Pictures Background Cpb
This is a three bars for financial analysis vector icon ppt powerpoint presentation pictures background cpb. This is a three stage process. The stages in this process are bar chart icon, bar graph icon, data chart icon.
 Home
Home