Financial Chart
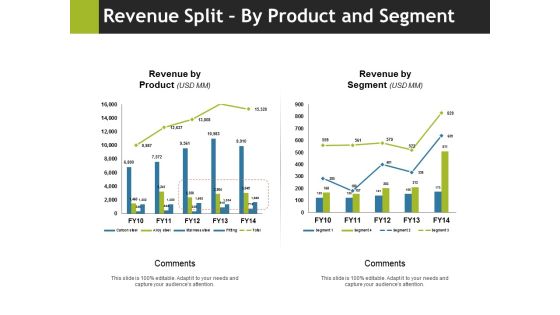
Revenue Split By Product And Segment Ppt PowerPoint Presentation Gallery Example
This is a revenue split by product and segment ppt powerpoint presentation gallery example. This is a two stage process. The stages in this process are comments, revenue by product, revenue by segment, business, marketing.
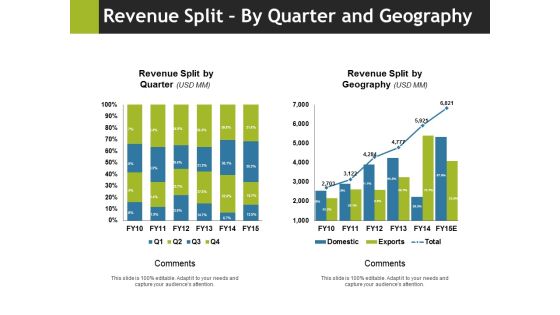
Revenue Split By Quarter And Geography Ppt PowerPoint Presentation Slides Vector
This is a revenue split by quarter and geography ppt powerpoint presentation slides vector. This is a two stage process. The stages in this process are revenue split by quarter, comments, revenue split by geography, business, marketing.

Bar Graph Finance Planning Ppt PowerPoint Presentation Infographic Template Master Slide
This is a bar graph finance planning ppt powerpoint presentation infographic template master slide. This is a two stage process. The stages in this process are finance, analysis, business, investment, marketing.

Current State Analysis Revenue Versus Target Ppt PowerPoint Presentation Background Designs
This is a current state analysis revenue versus target ppt powerpoint presentation background designs. This is a six stage process. The stages in this process are actual, target, actual vs target value.

Competitor Market Share And Sales Revenues Ppt PowerPoint Presentation Professional Design Inspiration
This is a competitor market share and sales revenues ppt powerpoint presentation professional design inspiration. This is a four stage process. The stages in this process are your figures, development, business, marketing, graph.

Competitor Market Share And Sales Revenues Ppt PowerPoint Presentation Portfolio Pictures
This is a competitor market share and sales revenues ppt powerpoint presentation portfolio pictures. This is a four stage process. The stages in this process are business, your figures, development, marketing, graph.

Competitor Market Share And Sales Revenues Ppt PowerPoint Presentation Summary Influencers
This is a competitor market share and sales revenues ppt powerpoint presentation summary influencers. This is a four stage process. The stages in this process are business, marketing, graph, finance, strategy.

Competitor Market Share And Sales Revenues Ppt PowerPoint Presentation File Demonstration
This is a competitor market share and sales revenues ppt powerpoint presentation file demonstration. This is a six stage process. The stages in this process are business, marketing, finance, your figures, development.
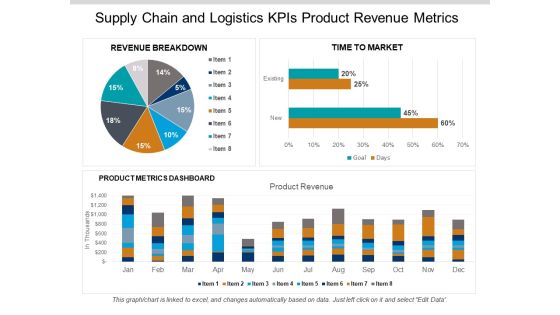
Supply Chain And Logistics Kpis Product Revenue Metrics Ppt PowerPoint Presentation Gallery Aids
This is a supply chain and logistics kpis product revenue metrics ppt powerpoint presentation gallery aids. This is a three stage process. The stages in this process are logistics performance, logistics dashboard, logistics kpis.

Retail KPI Dashboard Showing Revenue Vs Units Sold Ppt PowerPoint Presentation Professional Smartart
This is a retail kpi dashboard showing revenue vs units sold ppt powerpoint presentation professional smartart. This is a four stage process. The stages in this process are finance, analysis, business, investment, marketing.

Retail KPI Dashboard Showing Sales Revenue Customers Ppt PowerPoint Presentation Show Background Designs
This is a retail kpi dashboard showing sales revenue customers ppt powerpoint presentation show background designs. This is a six stage process. The stages in this process are finance, analysis, business, investment, marketing.

Budgeting Planned Actual Comparison Ppt PowerPoint Presentation Icon Shapes
This is a budgeting planned actual comparison ppt powerpoint presentation icon shapes. This is a two stage process. The stages in this process are finance, marketing, management, investment, product, percentage.

Budgeting Template 2 Ppt PowerPoint Presentation File Inspiration
This is a budgeting template 2 ppt powerpoint presentation file inspiration. This is a five stage process. The stages in this process are business, marketing, strategy, planning, finance.
Economic Order Quantity Eoq Model Ppt PowerPoint Presentation Icon Deck
This is a economic order quantity eoq model ppt powerpoint presentation icon deck. This is a two stage process. The stages in this process are order quantity, reorder point.

Bar Graph Ppt PowerPoint Presentation Pictures Picture
This is a bar graph ppt powerpoint presentation pictures picture. This is a three stage process. The stages in this process are business, marketing, strategy, planning, finance.

Bar Graph Ppt PowerPoint Presentation Slides Slideshow
This is a bar graph ppt powerpoint presentation slides slideshow. This is a three stage process. The stages in this process are business, finance, marketing, strategy, planning.

Budgeting Template 2 Ppt PowerPoint Presentation Pictures Model
This is a budgeting template 2 ppt powerpoint presentation pictures model. This is a five stage process. The stages in this process are cost item, year, budgeting template, cost, total.

Budgeting Template 3 Ppt PowerPoint Presentation Ideas Graphics Tutorials
This is a budgeting template 3 ppt powerpoint presentation ideas graphics tutorials. This is a five stage process. The stages in this process are cost item, year, total, type, budgeting template.

Budgeting Template Ppt PowerPoint Presentation Gallery Design Inspiration
This is a budgeting template ppt powerpoint presentation gallery design inspiration. This is a five stage process. The stages in this process are product, percentage, business, management, marketing.

Bar Graph Ppt PowerPoint Presentation Example 2015
This is a bar graph ppt powerpoint presentation example 2015. This is a two stage process. The stages in this process are bar graph, finance, marketing, analysis, business.

Bar Graph Ppt PowerPoint Presentation Designs Download
This is a bar graph ppt powerpoint presentation designs download. This is a eight stage process. The stages in this process are bar graph, business, strategy, management, marketing.

Bar Graph Ppt PowerPoint Presentation Slides Model
This is a bar graph ppt powerpoint presentation slides model. This is a eight stage process. The stages in this process are business, marketing, bar graph, management, timeline.

Bar Graph Ppt PowerPoint Presentation Slides Portfolio
This is a bar graph ppt powerpoint presentation slides portfolio. This is a three stage process. The stages in this process are business, marketing, management, bar graph, product.

Bar Graph Ppt PowerPoint Presentation Show Inspiration
This is a bar graph ppt powerpoint presentation show inspiration. This is a six stage process. The stages in this process are business, marketing, bar, graph, success.

Bar Graph Ppt PowerPoint Presentation Show Guidelines
This is a bar graph ppt powerpoint presentation show guidelines. This is a four stage process. The stages in this process are product, growth, business, finance, bar graph.

Bar Graph Ppt PowerPoint Presentation Styles Show
This is a bar graph ppt powerpoint presentation styles show. This is a one stage process. The stages in this process are bar graph, finance, marketing, investment, business.

Bar Graph Ppt PowerPoint Presentation Layouts Portrait
This is a bar graph ppt powerpoint presentation layouts portrait. This is a three stage process. The stages in this process are bar graph, finance, marketing, strategy, business.

Bar Graph Ppt PowerPoint Presentation File Display
This is a bar graph ppt powerpoint presentation file display. This is a four stage process. The stages in this process are bar graph, marketing, strategy, finance, analysis.

Bar Graph Ppt PowerPoint Presentation Professional Background
This is a bar graph ppt powerpoint presentation professional background. This is a two stage process. The stages in this process are bar graph, finance, marketing, strategy, business.

Bar Graph Ppt PowerPoint Presentation Layouts Backgrounds
This is a bar graph ppt powerpoint presentation layouts backgrounds. This is a one stage process. The stages in this process are business, marketing, finance, bar graph, strategy.

Bar Graphs Ppt PowerPoint Presentation Gallery Elements
This is a bar graphs ppt powerpoint presentation gallery elements. This is a two stage process. The stages in this process are Bar Graphs, Business, Strategy, Marketing, Analysis.

Bar Graph Ppt PowerPoint Presentation File Slides
This is a bar graph ppt powerpoint presentation file slides. This is a three stage process. The stages in this process are product, sales in percentage, bar graph, growth, success.

Bar Graph Ppt PowerPoint Presentation Summary Format
This is a bar graph ppt powerpoint presentation summary format. This is a three stage process. The stages in this process are bar graph, business, marketing, years, percentage, finance.

Bar Graph Ppt PowerPoint Presentation Layouts Influencers
This is a bar graph ppt powerpoint presentation layouts influencers. This is a two stage process. The stages in this process are business, marketing, in bar graph, sales in percentage, finance.

Bar Graph Ppt PowerPoint Presentation Styles Skills
This is a bar graph ppt powerpoint presentation styles skills. This is a two stage process. The stages in this process are bar graph, product, in year, in percentage, business.

Bar Graph Ppt Powerpoint Presentation Show Backgrounds
This is a bar graph ppt powerpoint presentation show backgrounds. This is a four stage process. The stages in this process are graph, finance, marketing, management, business.

Bar Graph Ppt PowerPoint Presentation File Show
This is a bar graph ppt powerpoint presentation file show. This is a four stage process. The stages in this process are business, marketing, graph, growth, finance.

Bar Graph Ppt Powerpoint Presentation File Graphics
This is a bar graph ppt powerpoint presentation file graphics. This is a three stage process. The stages in this process are product, graph, management, business, marketing.

Bar Graph Ppt Powerpoint Presentation Outline Shapes
This is a bar graph ppt powerpoint presentation outline shapes. This is a four stage process. The stages in this process are product, graph, finance, marketing, business.

Bar Graph Ppt PowerPoint Presentation Layouts Professional
This is a bar graph ppt powerpoint presentation layouts professional. This is a five stage process. The stages in this process are product, business, marketing, finance, graph.

Bar Graph Ppt PowerPoint Presentation File Tips
This is a bar graph ppt powerpoint presentation file tips. This is a twelve stage process. The stages in this process are business, marketing, finance, graph, strategy.

Bar Graph Ppt PowerPoint Presentation Portfolio Example
This is a bar graph ppt powerpoint presentation portfolio example. This is a three stage process. The stages in this process are sales in percentage, year, business, product, business, graph.
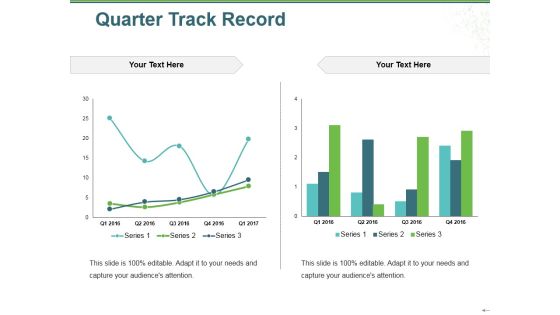
Quarter Track Record Ppt PowerPoint Presentation Gallery Images
This is a quarter track record ppt powerpoint presentation gallery images. This is a two stage process. The stages in this process are series, bar graph, growth, success, business.

Clustered Bar Ppt PowerPoint Presentation Diagram Templates
This is a clustered bar ppt powerpoint presentation diagram templates. This is a three stage process. The stages in this process are business, marketing, unit count, finance, strategy.

Budgeting Planned Actual Comparison Ppt PowerPoint Presentation Infographics Samples
This is a budgeting planned actual comparison ppt powerpoint presentation infographics samples. This is a two stage process. The stages in this process are deviation, planned cost, actual cost, value difference, planning.

Budgeting Planned Actual Comparison Ppt PowerPoint Presentation Portfolio Information
This is a budgeting planned actual comparison ppt powerpoint presentation portfolio information. This is a three stage process. The stages in this process are planned cost, actual cost, deviation.

Budgeting Planned Actual Comparison Ppt PowerPoint Presentation Portfolio Display
This is a budgeting planned actual comparison ppt powerpoint presentation portfolio display. This is a three stage process. The stages in this process are type of cost, planned cost, actual cost, deviation, value difference.

Budgeting Planned Actual Comparison Ppt PowerPoint Presentation Show Background Image
This is a budgeting planned actual comparison ppt powerpoint presentation show background image. This is a three stage process. The stages in this process are planned cost, actual cost, value difference, deviation.

Budgeting Planned Actual Comparison Ppt PowerPoint Presentation Visual Aids Gallery
This is a budgeting planned actual comparison ppt powerpoint presentation visual aids gallery. This is a three stage process. The stages in this process are business, management, marketing, percentage, product.

Budgeting Planned Actual Comparison Ppt PowerPoint Presentation Portfolio Ideas
This is a budgeting planned actual comparison ppt powerpoint presentation portfolio ideas. This is a two stage process. The stages in this process are finance, analysis, business, investment, marketing.

Budgeting Planned Actual Comparison Ppt PowerPoint Presentation Styles File Formats
This is a budgeting planned actual comparison ppt powerpoint presentation styles file formats. This is a three stage process. The stages in this process are product, percentage, business, management, marketing.

Product Launch Budget Plan Ppt PowerPoint Presentation Outline Samples
This is a product launch budget plan ppt powerpoint presentation outline samples. This is a seven stage process. The stages in this process are business, management, marketing, percentage, product.

Budgeting Planned Actual Comparison Ppt PowerPoint Presentation Inspiration Gallery
This is a budgeting planned actual comparison ppt powerpoint presentation inspiration gallery. This is a two stage process. The stages in this process are finance, analysis, business, investment, marketing.

Budgeting Planned Actual Comparison Ppt PowerPoint Presentation Inspiration Outline
This is a budgeting planned actual comparison ppt powerpoint presentation inspiration outline. This is a two stage process. The stages in this process are finance, analysis, business, investment, marketing.
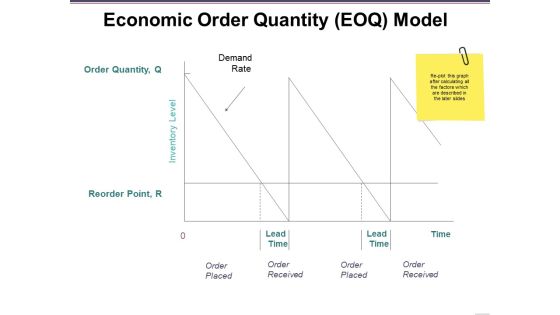
Economic Order Quantity Eoq Model Ppt PowerPoint Presentation Ideas Deck
This is a economic order quantity eoq model ppt powerpoint presentation ideas deck. This is a three stage process. The stages in this process are demand rate, order placed, order received, lead time, time, inventory level.
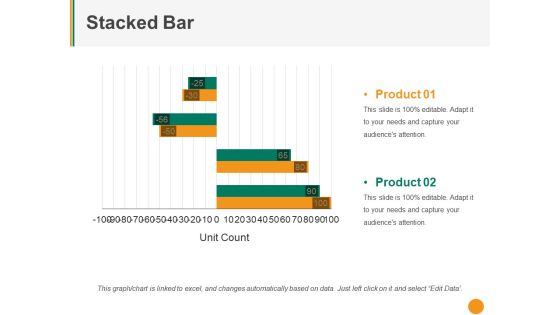
Stacked Bar Ppt PowerPoint Presentation Templates
This is a stacked bar ppt powerpoint presentation templates. This is a two stage process. The stages in this process are product, unit count, graph, business, marketing.
Sales KPI Tracker Ppt PowerPoint Presentation Icon Themes
This is a sales kpi tracker ppt powerpoint presentation icon themes. This is a six stage process. The stages in this process are business, marketing, opportunities won, top products in revenue, leads created.
Pandl Kpis Template Ppt PowerPoint Presentation Model Icon
This is a pandl kpis template ppt powerpoint presentation model icon. This is a four stage process. The stages in this process are revenue, cogs, operating profit, net profit.

Bar Graph Ppt PowerPoint Presentation Styles Visual Aids
This is a bar graph ppt powerpoint presentation styles visual aids. This is a three stage process. The stages in this process are bar, marketing, strategy, finance, planning.

Bar Graph Ppt PowerPoint Presentation Ideas Design Inspiration
This is a bar graph ppt powerpoint presentation ideas design inspiration. This is a five stage process. The stages in this process are bar, marketing, strategy, planning, finance.
Stacked Bar Template 1 Ppt PowerPoint Presentation Icon Portfolio
This is a stacked bar template 1 ppt powerpoint presentation icon portfolio. This is a two stage process. The stages in this process are business, marketing, finance, graph, strategy.
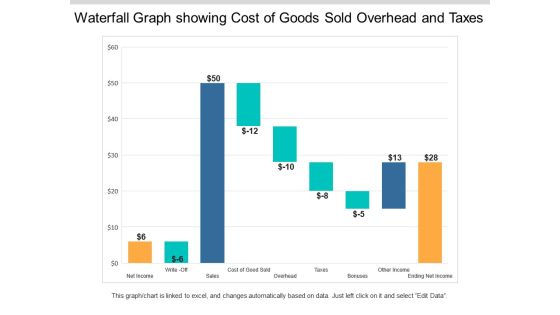
Waterfall Graph Showing Cost Of Goods Sold Overhead And Taxes Ppt PowerPoint Presentation Styles Example Topics
This is a waterfall graph showing cost of goods sold overhead and taxes ppt powerpoint presentation styles example topics. This is a three stage process. The stages in this process are profit and loss, balance sheet, income statement, benefit and loss.

Bar Diagram Ppt PowerPoint Presentation Show Maker
This is a bar diagram ppt powerpoint presentation show maker. This is a seven stage process. The stages in this process are bar graph, finance, marketing, strategy, business.
P And L Kpis Template 2 Ppt PowerPoint Presentation Summary Icon
This is a p and l kpis template 2 ppt powerpoint presentation summary icon. This is a four stage process. The stages in this process are revenue, cogs, operating profit, net profit.

Business Graph Money PowerPoint Themes And PowerPoint Slides 0511
Microsoft PowerPoint Slide and Theme with business graph with profits rising off the chart graph

Raising Arrow Money Success PowerPoint Themes And PowerPoint Slides 0711
Microsoft PowerPoint Theme and Slide with businessteam standing on coins in front of successful chart
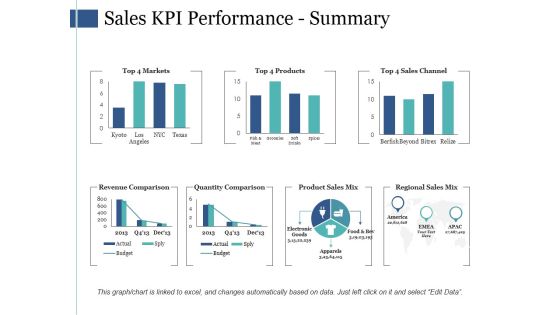
Sales Kpi Performance Summary Ppt PowerPoint Presentation Infographic Template Infographics
This is a sales kpi performance summary ppt powerpoint presentation infographic template infographics. This is a seven stage process. The stages in this process are revenue comparison, quantity comparison, product sales mix, regional sales mix.
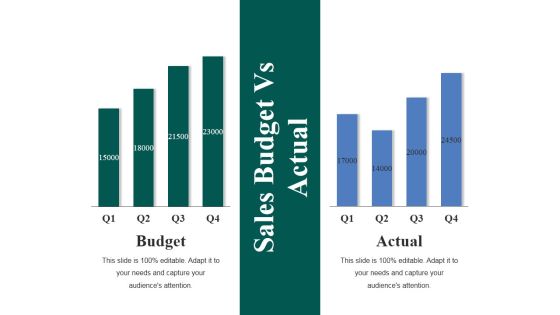
Sales Budget Vs Actual Ppt PowerPoint Presentation Show Master Slide
This is a sales budget vs actual ppt powerpoint presentation show master slide. This is a two stage process. The stages in this process are business, finance, management, analysis, budget, actual.

Competitor Analysis Ppt PowerPoint Presentation Infographic Template Elements
This is a competitor analysis ppt powerpoint presentation infographic template elements. This is a four stage process. The stages in this process are revenue, sales, business, marketing, finance.

Bar Graph Ppt PowerPoint Presentation Slides Graphic Images
This is a bar graph ppt powerpoint presentation slides graphic images. This is a six stage process. The stages in this process are bar, finance, business, marketing, growth.

Clustered Bar Graph Ppt PowerPoint Presentation Gallery Graphics Example
This is a clustered bar graph ppt powerpoint presentation gallery graphics example. This is a three stage process. The stages in this process are clustered bar graph, finance, marketing, strategy, business.

Bar Graph Ppt PowerPoint Presentation Infographics Graphics Design
This is a bar graph ppt powerpoint presentation infographics graphics design. This is a five stage process. The stages in this process are bar graph, business, years, marketing, management.

Bar Graph 7 QC Tools Ppt PowerPoint Presentation Styles Structure
This is a bar graph 7 qc tools ppt powerpoint presentation styles structure. This is a three stage process. The stages in this process are bar graph, finance, marketing, analysis, investment.

Bar Graph Ppt PowerPoint Presentation Layouts Graphic Images
This is a bar graph ppt powerpoint presentation layouts graphic images. This is a four stage process. The stages in this process are product, business, marketing, growth.

Bar Graph Finance Ppt PowerPoint Presentation Summary Ideas
This is a bar graph finance ppt powerpoint presentation summary ideas. This is a three stage process. The stages in this process are finance, analysis, business, investment, marketing.

Bar Graph Product Ppt PowerPoint Presentation Layouts Ideas
This is a bar graph product ppt powerpoint presentation layouts ideas. This is a three stage process. The stages in this process are business, management, marketing, product, percentage.

Stacked Bar Ppt PowerPoint Presentation Summary Diagrams
This is a stacked bar ppt powerpoint presentation summary diagrams. This is a four stage process. The stages in this process are business, marketing, strategy, planning, finance.
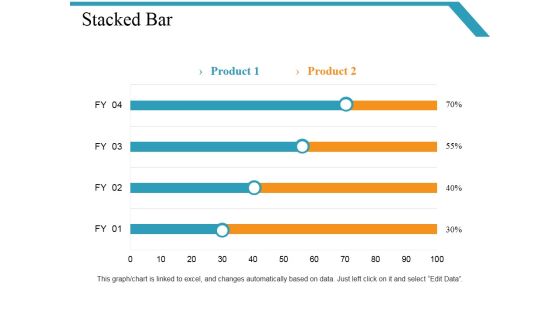
Stacked Bar Template Ppt PowerPoint Presentation Styles Show
This is a stacked bar template ppt powerpoint presentation styles show. This is a four stage process. The stages in this process are business, marketing, finance, bar, graph.

Bar Graph Finance Ppt PowerPoint Presentation Infographics Background Designs
This is a bar graph finance ppt powerpoint presentation infographics background designs. This is a two stage process. The stages in this process are finance, analysis, business, investment, marketing.

Bar Graph Percentage Product Ppt PowerPoint Presentation Layouts Microsoft
This is a bar graph percentage product ppt powerpoint presentation layouts microsoft. This is a three stage process. The stages in this process are business, management, marketing, percentage, product.
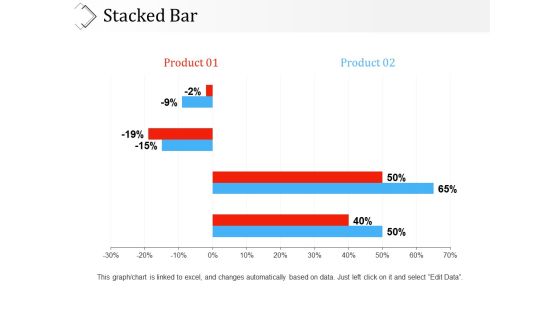
Stacked Bar Ppt PowerPoint Presentation Infographic Template Clipart
This is a stacked bar ppt powerpoint presentation infographic template clipart. This is a two stage process. The stages in this process are product, percentage, business, marketing, graph.

Competitor Analysis Template 1 Ppt PowerPoint Presentation File Grid
This is a competitor analysis template 1 ppt powerpoint presentation file grid. This is a four stage process. The stages in this process are finance, marketing, business, graph, analysis, revenue.

Clustered Bar Ppt PowerPoint Presentation Icon Images
This is a clustered bar ppt powerpoint presentation icon images. This is a three stage process. The stages in this process are unit count, finance, marketing, graph, business.

Clustered Bar Ppt PowerPoint Presentation Icon Background
This is a clustered bar ppt powerpoint presentation icon background. This is a three stage process. The stages in this process are business, unit count, marketing, graph, finance.
Stacked Bar Ppt PowerPoint Presentation Icon Deck
This is a stacked bar ppt powerpoint presentation icon deck. This is a three stage process. The stages in this process are business, unit count, marketing, strategy, graph.

Clustered Bar Investment Planning Ppt PowerPoint Presentation Infographic Template Deck
This is a clustered bar investment planning ppt powerpoint presentation infographic template deck. This is a three stage process. The stages in this process are finance, analysis, business, investment, marketing.

Stacked Bar Ppt PowerPoint Presentation Infographic Template Infographic Template
This is a stacked bar ppt powerpoint presentation infographic template infographic template. This is a four stage process. The stages in this process are business, marketing, finance, slide bar, graph.
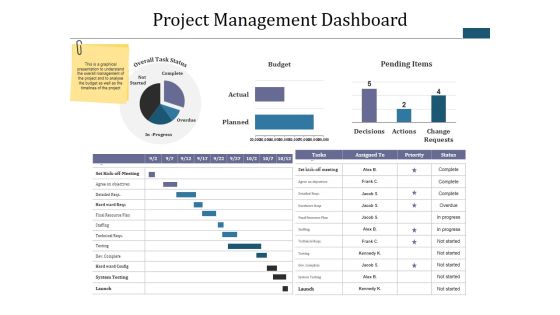
Project Management Dashboard Ppt PowerPoint Presentation Infographic Template Diagrams
This is a project management dashboard ppt powerpoint presentation infographic template diagrams. This is a three stage process. The stages in this process are budget, pending items, complete, overdue, not started.

Clustered Bar Finance Ppt PowerPoint Presentation Icon Infographic Template
This is a clustered bar finance ppt powerpoint presentation icon infographic template. This is a three stage process. The stages in this process are finance, analysis, business, investment, marketing.

Bar Diagram Ppt PowerPoint Presentation File Graphics
This is a bar diagram ppt powerpoint presentation file graphics. This is a five stage process. The stages in this process are bar diagram, business, years, marketing, management.
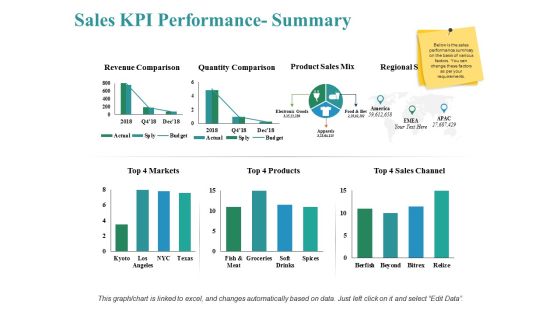
Sales Kpi Performance Summary Ppt PowerPoint Presentation Show Themes
This is a sales kpi performance summary ppt powerpoint presentation show themes. This is a three stage process. The stages in this process are revenue comparison, quantity comparison, product sales mix, markets, sales channel.

Clustered Bar Ppt PowerPoint Presentation Icon Elements
This is a clustered bar ppt powerpoint presentation icon elements. This is a three stage process. The stages in this process are business, marketing, strategy, planning, finance.

Clustered Bar Ppt PowerPoint Presentation Outline Templates
This is a clustered bar ppt powerpoint presentation outline templates. This is a three stage process. The stages in this process are business, finance, analysis, management, marketing.

Bar Diagram Ppt Powerpoint Presentation Styles Outline
This is a bar diagram ppt powerpoint presentation styles outline. This is a three stage process. The stages in this process are business, management, finance, analysis, marketing.

Sales Kpi Performance Summary Ppt PowerPoint Presentation Ideas Graphics Template
This is a sales kpi performance summary ppt powerpoint presentation ideas graphics template. This is a seven stage process. The stages in this process are revenue comparison, quantity comparison, product sales mix, regional sales mix.
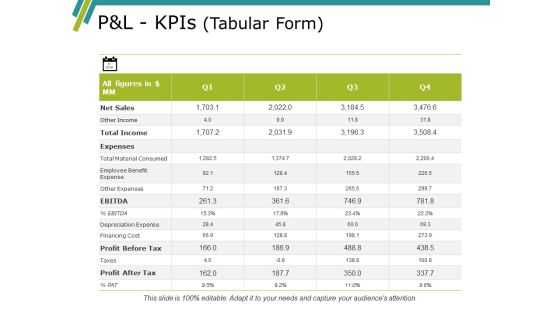
Pandl Kpis Template Ppt PowerPoint Presentation Gallery Summary
This is a pandl kpis template ppt powerpoint presentation gallery summary. This is a four stage process. The stages in this process are revenue, cogs, operating profit, net profit.

Income Statement Graphical Representation Ppt PowerPoint Presentation Pictures Design Templates
This is a income statement graphical representation ppt powerpoint presentation pictures design templates. This is a four stage process. The stages in this process are revenue, operating profit, net profit, cogs, business.

Sales Performance Dashboard Template Ppt PowerPoint Presentation Professional Elements
This is a sales performance dashboard template ppt powerpoint presentation professional elements. This is a eight stage process. The stages in this process are sales comparison, sales by product category, sales by month, brand profitability, revenue.
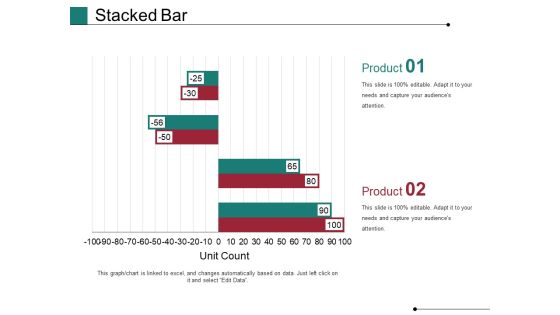
Stacked Bar Template 1 Ppt PowerPoint Presentation Show Slides
This is a stacked bar template 1 ppt powerpoint presentation show slides. This is a two stage process. The stages in this process are Unit Count, Business, Marketing, Graph, Finance.
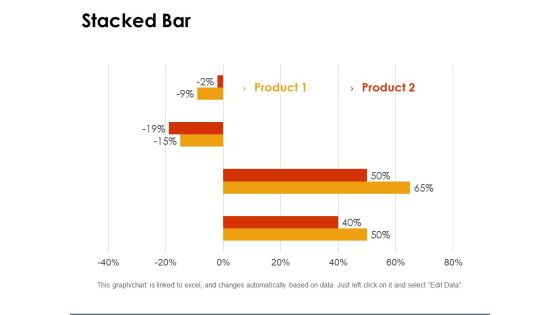
Stacked Bar Template 1 Ppt PowerPoint Presentation Gallery Clipart
This is a stacked bar template 1 ppt powerpoint presentation gallery clipart. This is a two stage process. The stages in this process are percentage, graph, business, marketing, finance.

Stacked Bar Template Ppt PowerPoint Presentation Summary Visual Aids
This is a stacked bar template ppt powerpoint presentation summary visual aids. This is a three stage process. The stages in this process are unit count, business, marketing, finance, graph.
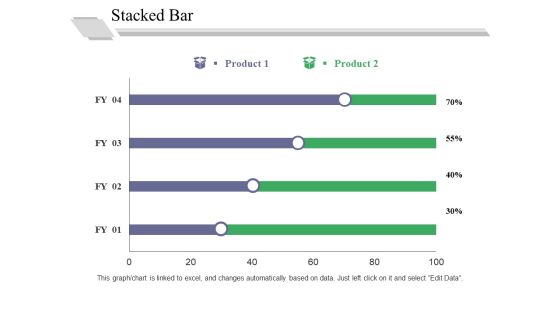
Stacked Bar Template 1 Ppt PowerPoint Presentation Outline Good
This is a stacked bar template 1 ppt powerpoint presentation outline good. This is a two stage process. The stages in this process are in percentage, business, marketing, graph, strategy.
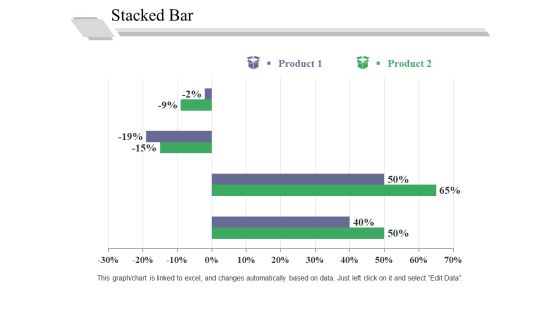
Stacked Bar Template 2 Ppt PowerPoint Presentation Professional Graphics Pictures
This is a stacked bar template 2 ppt powerpoint presentation professional graphics pictures. This is a two stage process. The stages in this process are in percentage, business, marketing, graph, strategy.
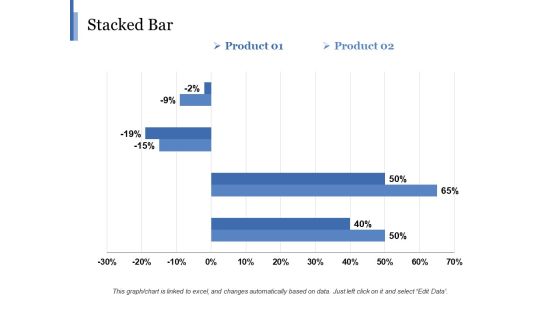
Stacked Bar Template 2 Ppt PowerPoint Presentation Gallery Background
This is a stacked bar template 2 ppt powerpoint presentation gallery background. This is a two stage process. The stages in this process are business, marketing, finance, graph, strategy, percentage.
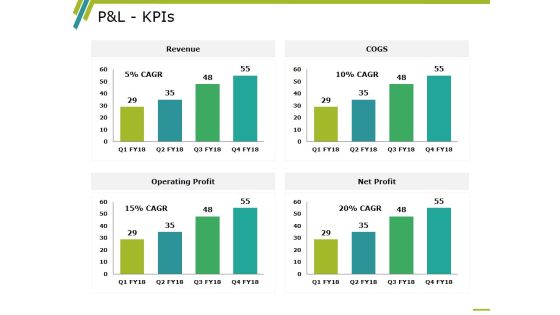
P And L Kpis Template 2 Ppt PowerPoint Presentation Professional Information
This is a p and l kpis template 2 ppt powerpoint presentation professional information. This is a four stage process. The stages in this process are revenue, operating profit, cogs, net profit, business.
Stacked Bar Ppt PowerPoint Presentation Icon Objects
This is a stacked bar ppt powerpoint presentation icon objects. This is a two stage process. The stages in this process are stacked bar, finance, analysis, marketing, strategy.

Clustered Bar Ppt PowerPoint Presentation Icon Professional
This is a clustered bar ppt powerpoint presentation icon professional. This is a two stage process. The stages in this process are business, marketing, profit, clustered bar, finance, strategy.

Clustered Bar Ppt PowerPoint Presentation Icon Example
This is a clustered bar ppt powerpoint presentation icon example. This is a two stage process. The stages in this process are finance, investment, analysis, business, marketing.

Clustered Bar Ppt PowerPoint Presentation Infographic Template Mockup
This is a clustered bar ppt powerpoint presentation infographic template mockup. This is a four stage process. The stages in this process are clustered bar, finance, marketing, planning, business.

Clustered Bar Ppt PowerPoint Presentation Infographic Template Infographics
This is a clustered bar ppt powerpoint presentation infographic template infographics. This is a three stage process. The stages in this process are clustered bar, finance, planning, management, marketing.
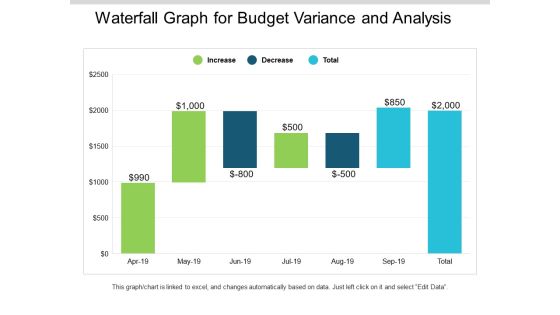
Waterfall Graph For Budget Variance And Analysis Ppt PowerPoint Presentation Slides Mockup
This is a waterfall graph for budget variance and analysis ppt powerpoint presentation slides mockup. This is a three stage process. The stages in this process are profit and loss, balance sheet, income statement, benefit and loss.

Waterfall Graph Summarize Budget 2018 To 2019 Ppt PowerPoint Presentation Summary Slides
This is a waterfall graph summarize budget 2018 to 2019 ppt powerpoint presentation summary slides. This is a three stage process. The stages in this process are profit and loss, balance sheet, income statement, benefit and loss.

Cost And Benefits Of New Product Ppt PowerPoint Presentation Inspiration Diagrams
This is a cost and benefits of new product ppt powerpoint presentation inspiration diagrams. This is a three stage process. The stages in this process are recurrent costs, cost decreasing, revenue increasing, benefits, costs.
Pandl Kpis Tabular Form Ppt PowerPoint Presentation Gallery Icon
This is a pandl kpis tabular form ppt powerpoint presentation gallery icon. This is a four stage process. The stages in this process are revenue, cogs, operating profit, net profit.
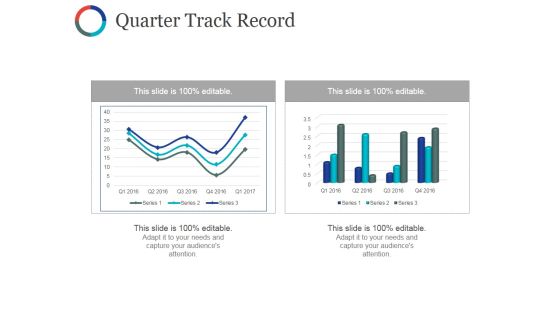
Quarter Track Record Ppt PowerPoint Presentation Professional Layout Ideas
This is a quarter track record ppt powerpoint presentation professional layout ideas. This is a two stage process. The stages in this process are business, marketing, finance, graph, plan.

Quarter Track Record Ppt PowerPoint Presentation Styles Master Slide
This is a quarter track record ppt powerpoint presentation styles master slide. This is a two stage process. The stages in this process are business, graph, marketing, finance, planning.

Staked Bar Planning Business Ppt PowerPoint Presentation Infographic Template Infographic Template
This is a staked bar planning business ppt powerpoint presentation infographic template infographic template. This is a three stage process. The stages in this process are finance, marketing, analysis, business, investment.

Clustered Bar Finance Ppt Powerpoint Presentation Ideas Themes
This is a clustered bar finance ppt powerpoint presentation ideas themes. This is a three stage process. The stages in this process are clustered bar, product, in percentage, years, profit.
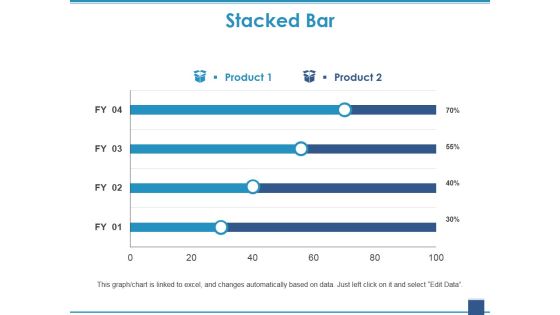
Stacked Bar Template 1 Ppt PowerPoint Presentation Gallery Deck
This is a stacked bar template 1 ppt powerpoint presentation gallery deck. This is a two stage process. The stages in this process are stacked bar, growth, finance, marketing, business.

Stacked Bar Template 2 Ppt PowerPoint Presentation Show Clipart
This is a stacked bar template 2 ppt powerpoint presentation show clipart. This is a two stage process. The stages in this process are stacked bar, growth, finance, marketing, business, investment.

Clustered Bar Finance Ppt PowerPoint Presentation Infographics Graphics Template
This is a clustered bar finance ppt powerpoint presentation infographics graphics template. This is a three stage process. The stages in this process are clustered bar, finance, business, investment, marketing.

Stacked Bar Template 2 Ppt PowerPoint Presentation Deck
This is a stacked bar template 2 ppt powerpoint presentation deck. This is a two stage process. The stages in this process are business, strategy, analysis, marketing, finance.

Clustered Bar Ppt PowerPoint Presentation Infographic Template Grid
This is a clustered bar ppt powerpoint presentation infographic template grid. This is a two stage process. The stages in this process are finance, analysis, marketing, business, strategy.

Clustered Bar Ppt PowerPoint Presentation Summary Infographic Template
This is a clustered bar ppt powerpoint presentation summary infographic template. This is a three stage process. The stages in this process are finance, marketing, management, investment, analysis.

Clustered Bar Investment Ppt PowerPoint Presentation File Templates
This is a clustered bar investment ppt powerpoint presentation file templates. This is a three stage process. The stages in this process are finance, analysis, business, investment, marketing.
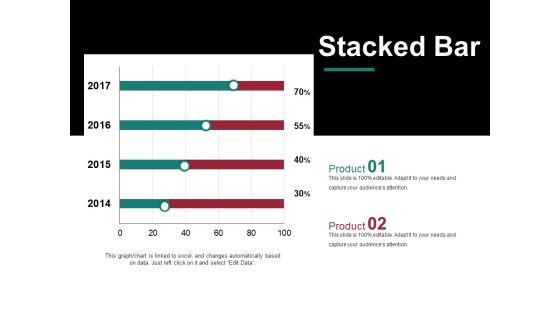
Stacked Bar Template 2 Ppt PowerPoint Presentation Model Graphic Images
This is a stacked bar template 2 ppt powerpoint presentation model graphic images. This is a two stage process. The stages in this process are business, years, marketing, percentage, finance.

100 Percent Stacked Bar Ppt PowerPoint Presentation Layouts Graphics Template
This is a 100 percent stacked bar ppt powerpoint presentation layouts graphics template. This is a three stage process. The stages in this process are finance, marketing, management, investment, analysis.

100 Percent Stacked Bar Finance Ppt PowerPoint Presentation Model Templates
This is a 100 percent stacked bar finance ppt powerpoint presentation model templates. This is a three stage process. The stages in this process are finance, analysis, business, investment, marketing.
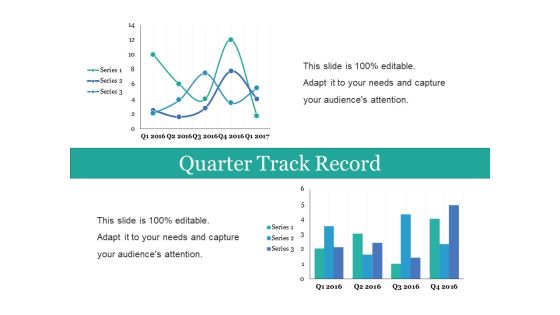
Quarter Track Record Ppt PowerPoint Presentation Slides Smartart
This is a quarter track record ppt powerpoint presentation slides smartart. This is a two stage process. The stages in this process are business, marketing, strategy, finance, graph.
Sales Kpi Tracker Ppt PowerPoint Presentation Visual Aids Files
This is a sales kpi tracker ppt powerpoint presentation visual aids files. This is a six stage process. The stages in this process are leads created, sales ratio, opportunities won, top products in revenue, open deals vs last yr.

Bar Graph Companys Business Model Canvas Ppt PowerPoint Presentation Visual Aids Model
This is a bar graph companys business model canvas ppt powerpoint presentation visual aids model. This is a three stage process. The stages in this process are bar graph, finance, marketing, strategy, analysis, business.

Clustered Bar Ppt PowerPoint Presentation Inspiration
This is a clustered bar ppt powerpoint presentation inspiration. This is a five stage process. The stages in this process are bar graph, business, marketing, finance, percentage.

Clustered Bar Ppt PowerPoint Presentation Slide Download
This is a clustered bar ppt powerpoint presentation slide download. This is a four stage process. The stages in this process are bar, graph, business, marketing, strategy.

Clustered Bar Ppt PowerPoint Presentation Slides Deck
This is a clustered bar ppt powerpoint presentation slides deck. This is a two stage process. The stages in this process are product, profit, bar graph.

Crm Dashboard Kpis Ppt PowerPoint Presentation Layouts
This is a crm dashboard kpis ppt powerpoint presentation layouts. This is a three stage process. The stages in this process are revenue, active subscribers, acquisition.
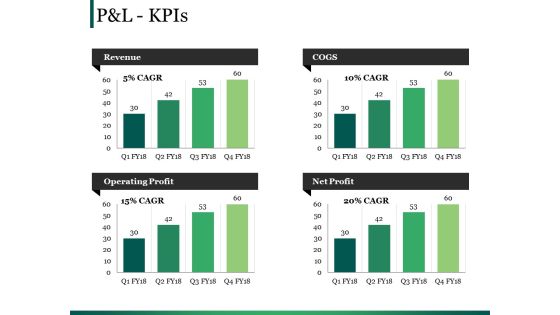
Pandl Kpis Ppt PowerPoint Presentation Outline Gallery
This is a pandl kpis ppt powerpoint presentation outline gallery. This is a four stage process. The stages in this process are revenue, cogs, operating profit, net profit.
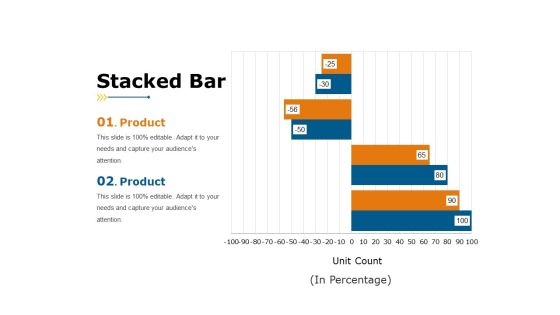
Stacked Bar Ppt PowerPoint Presentation File Sample
This is a stacked bar ppt powerpoint presentation file sample. This is a two stage process. The stages in this process are in percentage, finance, business, marketing, graph.

Clustered Bar Ppt PowerPoint Presentation Styles Elements
This is a clustered bar ppt powerpoint presentation styles elements. This is a three stage process. The stages in this process are product, business, marketing finance, graph.

Clustered Bar Ppt PowerPoint Presentation Outline Model
This is a clustered bar ppt powerpoint presentation outline model. This is a five stage process. The stages in this process are years, business, marketing, graph, finance.

Stacked Bar Ppt PowerPoint Presentation Summary Infographics
This is a stacked bar ppt powerpoint presentation summary infographics. This is a four stage process. The stages in this process are product, unit count, business, marketing, graph.

Clustered Bar Ppt PowerPoint Presentation File Maker
This is a clustered bar ppt powerpoint presentation file maker. This is a five stage process. The stages in this process are product, business, marketing, graph, finance.

Clustered Bar Ppt PowerPoint Presentation Background Designs
This is a clustered bar ppt powerpoint presentation background designs. This is a four stage process. The stages in this process are unit count, business, marketing, graph, finance.

Stacked Bar Ppt PowerPoint Presentation Layouts Inspiration
This is a stacked bar ppt powerpoint presentation layouts inspiration. This is a four stage process. The stages in this process are finance, business, marketing, percentage, graph.

Clustered Bar Ppt PowerPoint Presentation Outline Demonstration
This is a clustered bar ppt powerpoint presentation outline demonstration. This is a three stage process. The stages in this process are unit count, graph, business, marketing, finance.
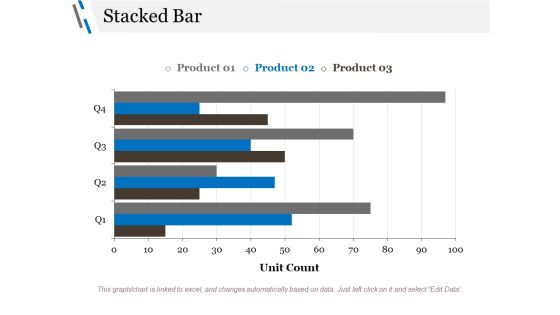
Stacked Bar Ppt PowerPoint Presentation File Backgrounds
This is a stacked bar ppt powerpoint presentation file backgrounds. This is a three stage process. The stages in this process are unit count, finance, business, marketing, graph.

Clustered Bar Ppt PowerPoint Presentation Professional Grid
This is a clustered bar ppt powerpoint presentation professional grid. This is a two stage process. The stages in this process are profit, business, marketing, graph, strategy.

Clustered Bar Ppt PowerPoint Presentation Layouts Layout
This is a clustered bar ppt powerpoint presentation layouts layout. This is a two stage process. The stages in this process are profit, graph, business, marketing, finance.
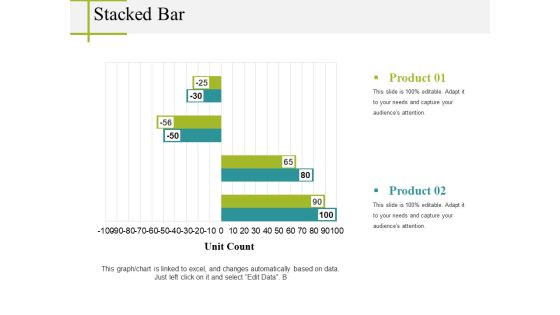
Stacked Bar Ppt PowerPoint Presentation Infographics Portrait
This is a stacked bar ppt powerpoint presentation infographics portrait. This is a two stage process. The stages in this process are unit count, business, marketing, graph, strategy.

Stacked Bar Ppt PowerPoint Presentation Infographics Clipart
This is a stacked bar ppt powerpoint presentation infographics clipart. This is a two stage process. The stages in this process are finance, marketing, business, unit count, graph.

Stacked Bar Ppt PowerPoint Presentation Pictures Slides
This is a stacked bar ppt powerpoint presentation pictures slides. This is a two stage process. The stages in this process are business, marketing, graph, finance, strategy.

Stacked Bar Ppt PowerPoint Presentation Gallery Summary
This is a stacked bar ppt powerpoint presentation gallery summary. This is a two stage process. The stages in this process are business, marketing, graph, unit count, finance.
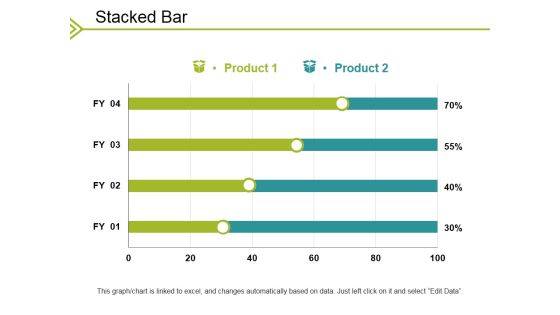
Stacked Bar Ppt PowerPoint Presentation File Outfit
This is a stacked bar ppt powerpoint presentation file outfit. This is a two stage process. The stages in this process are business, in percentage, marketing, strategy, graph.

Bar Diagram Percentage Product Ppt PowerPoint Presentation Show Topics
This is a bar diagram percentage product ppt powerpoint presentation show topics. This is a two stage process. The stages in this process are percentage, product, business, management, marketing.

Clustered Bar Ppt PowerPoint Presentation Layouts Gridlines
This is a clustered bar ppt powerpoint presentation layouts gridlines. This is a four stage process. The stages in this process are business, marketing, finance, bar, planning.

Clustered Bar Ppt PowerPoint Presentation Professional Styles
This is a clustered bar ppt powerpoint presentation professional styles. This is a two stage process. The stages in this process are business, marketing, strategy, planning, bar.
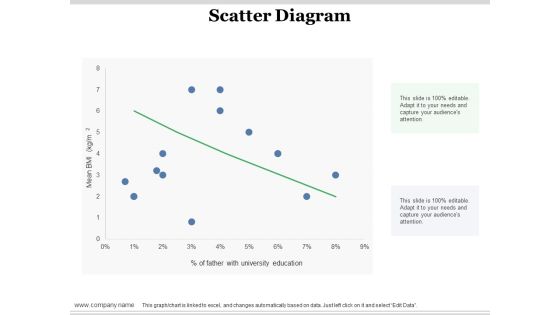
Scatter Diagram Ppt PowerPoint Presentation Infographic Template Design Ideas
This is a scatter diagram ppt powerpoint presentation infographic template design ideas. This is a one stage process. The stages in this process are scatter diagram, finance, in percentage, business, bar graph.

Clustered Bar Ppt PowerPoint Presentation File Styles
This is a clustered bar ppt powerpoint presentation file styles. This is a four stage process. The stages in this process are business, marketing, strategy, planning, finance.

Clustered Bar Ppt PowerPoint Presentation Model Gridlines
This is a clustered bar ppt powerpoint presentation model gridlines. This is a four stage process. The stages in this process are finance, marketing, analysis, management, planning.

Stacked Bar Ppt PowerPoint Presentation Layouts Brochure
This is a stacked bar ppt powerpoint presentation layouts brochure. This is a four stage process. The stages in this process are business, marketing, strategy, planning, finance.

Project Task List Template 2 Ppt PowerPoint Presentation Inspiration Designs
This is a project task list template 2 ppt powerpoint presentation inspiration designs. This is a three stage process. The stages in this process are complete, incomplete, slippage.

Stacked Bar Ppt PowerPoint Presentation Infographics Elements
This is a stacked bar ppt powerpoint presentation infographics elements. This is a four stages process. The stages in this process are stacked bar, finance, planning, management, strategy, business.
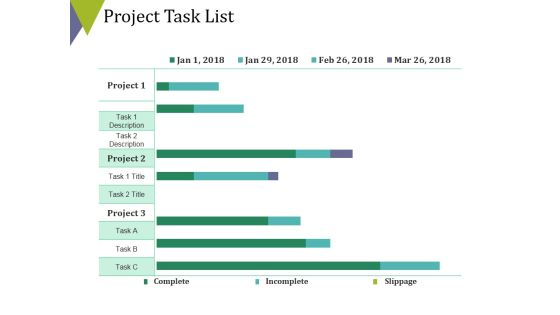
Project Task List Template 2 Ppt PowerPoint Presentation Infographics Brochure
This is a project task list template 2 ppt powerpoint presentation infographics brochure. This is a three stage process. The stages in this process are finance, business, marketing, analysis, strategy.
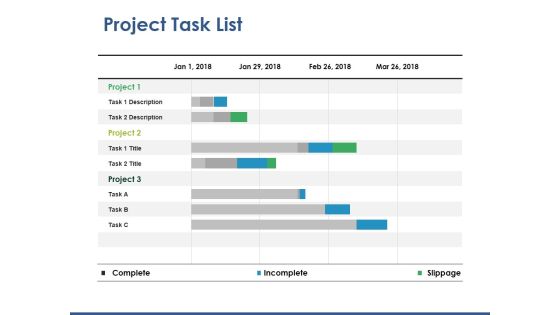
Project Task List Template 2 Ppt PowerPoint Presentation Slides Tips
This is a project task list template 2 ppt powerpoint presentation slides tips. This is a three stage process. The stages in this process are business, finance, marketing, analysis, strategy.

Clustered Bar Planning Ppt PowerPoint Presentation Layouts Demonstration
This is a clustered bar planning ppt powerpoint presentation layouts demonstration. This is a three stage process. The stages in this process are finance, analysis, business, investment, marketing.

Clustered Bar Process Analysis Ppt PowerPoint Presentation Icon Influencers
This is a clustered bar process analysis ppt powerpoint presentation icon influencers. This is a two stage process. The stages in this process are clustered bar, profit, product, finance, business.

Clustered Bar Ppt PowerPoint Presentation Styles Graphics
This is a clustered bar ppt powerpoint presentation styles graphics. This is a three stage process. The stages in this process are business, marketing, finance, graph, strategy, unit count.
Stacked Bar Ppt PowerPoint Presentation Icon Background Image
This is a stacked bar ppt powerpoint presentation icon background image. This is a four stage process. The stages in this process are product, percentage, finance, business, marketing.

Capital Expenditure Details Fy 18 Ppt PowerPoint Presentation Diagram Images
This is a capital expenditure details fy 18 ppt powerpoint presentation diagram images. This is a six stage process. The stages in this process are business, finance, analysis, strategy, marketing.

Customer Satisfaction Template 1 Ppt PowerPoint Presentation Portfolio Graphics Example
This is a customer satisfaction template 1 ppt powerpoint presentation portfolio graphics example. This is a three stage process. The stages in this process are overall satisfaction with service, satisfaction with value for money, overall satisfaction with relationship, key performance indicators, business, percentage.

Clustered Bar Marketing Planning Ppt PowerPoint Presentation Layouts Example
This is a clustered bar marketing planning ppt powerpoint presentation layouts example. This is a three stage process. The stages in this process are finance, analysis, business, investment, marketing.

Clustered Bar Ppt PowerPoint Presentation Pictures Display
This is a clustered bar ppt powerpoint presentation pictures display. This is a two stage process. The stages in this process are clustered bar, finance, marketing, strategy, business.
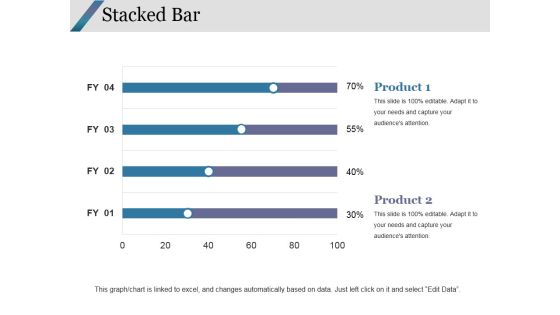
Stacked Bar Ppt PowerPoint Presentation Summary
This is a stacked bar ppt powerpoint presentation summary. This is a four stage process. The stages in this process are stacked bar, finance, analysis, business, marketing.

Stacked Bar Ppt PowerPoint Presentation Professional Designs
This is a stacked bar ppt powerpoint presentation professional designs. This is a four stage process. The stages in this process are stacked bar, finance, marketing, strategy, business.

Stacked Bar Ppt PowerPoint Presentation Professional Guidelines
This is a stacked bar ppt powerpoint presentation professional guidelines. This is a two stage process. The stages in this process are stacked bar, finance, analysis, business, marketing.

Stacked Bar Ppt PowerPoint Presentation Layouts Model
This is a stacked bar ppt powerpoint presentation layouts model. This is a two stage process. The stages in this process are stacked bar, finance, marketing, strategy, business.

Stacked Bar Ppt PowerPoint Presentation Ideas Inspiration
This is a stacked bar ppt powerpoint presentation ideas inspiration. This is a two stage process. The stages in this process are stacked bar, finance, marketing, analysis, business.

Clustered Bar Ppt PowerPoint Presentation Ideas Information
This is a clustered bar ppt powerpoint presentation ideas information. This is a three stage process. The stages in this process are clustered bar, finance, marketing, strategy, analysis.

Clustered Bar Ppt PowerPoint Presentation Slides Gallery
This is a clustered bar ppt powerpoint presentation slides gallery. This is a two stage process. The stages in this process are clustered bar, business, finance, marketing, strategy.

Clustered Bar Ppt PowerPoint Presentation Pictures Guidelines
This is a clustered bar ppt powerpoint presentation pictures guidelines. This is a three stage process. The stages in this process are clustered bar, finance, marketing, strategy, business.

Clustered Bar Ppt PowerPoint Presentation Professional Guidelines
This is a clustered bar ppt powerpoint presentation professional guidelines. This is a three stage process. The stages in this process are clustered bar, finance, marketing, strategy, analysis.
 Home
Home