AI PPT Maker
Templates
PPT Bundles
Design Services
Business PPTs
Business Plan
Management
Strategy
Introduction PPT
Roadmap
Self Introduction
Timelines
Process
Marketing
Agenda
Technology
Medical
Startup Business Plan
Cyber Security
Dashboards
SWOT
Proposals
Education
Pitch Deck
Digital Marketing
KPIs
Project Management
Product Management
Artificial Intelligence
Target Market
Communication
Supply Chain
Google Slides
Research Services
 One Pagers
All Categories
-
Home
- Customer Favorites
- Financial Chart
Financial Chart
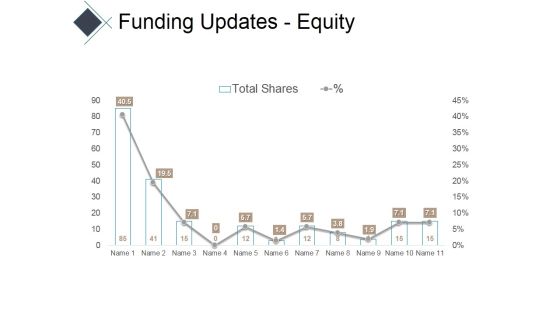
Funding Updates Equity Ppt PowerPoint Presentation Infographic Template Portfolio
This is a funding updates equity ppt powerpoint presentation infographic template portfolio. This is a eleven stage process. The stages in this process are charts, area, marketing, business, success.

The Strategy Of Innovation Template 2 Ppt PowerPoint Presentation Professional Graphic Images
This is a the strategy of innovation template 2 ppt powerpoint presentation professional graphic images. This is a three stage process. The stages in this process are business, area chart, finance, marketing, strategy.
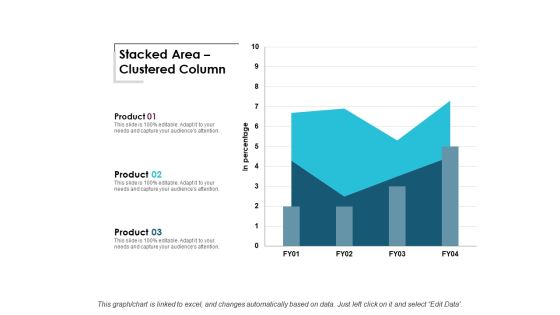
Stacked Area Clustered Column Ppt Powerpoint Presentation Infographic Template Background Images
This is a stacked area clustered column ppt powerpoint presentation infographic template background images. This is a three stage process. The stages in this process are area chart, finance, marketing, management, investment.

Stacked Line With Markers Ppt PowerPoint Presentation Pictures Background Designs
This is a stacked line with markers ppt powerpoint presentation pictures background designs. This is a two stage process. The stages in this process are line chart, marketing, strategy, planning, finance.
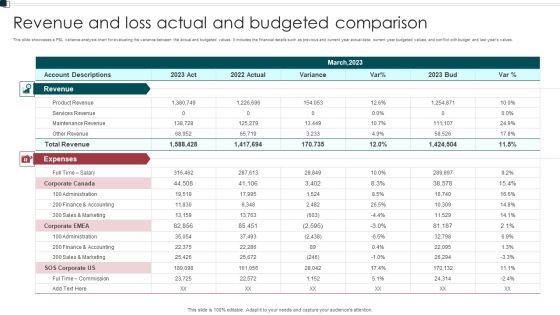
Revenue And Loss Actual And Budgeted Comparison Elements PDF
This slide showcases a P and L variance analysis chart for evaluating the variance between the actual and budgeted values. It includes the financial details such as previous and current year actual data current year budgeted values, and conflict with budget and last years values. Showcasing this set of slides titled Revenue And Loss Actual And Budgeted Comparison Elements PDF. The topics addressed in these templates are Expenses, Administration, Commission. All the content presented in this PPT design is completely editable. Download it and make adjustments in color, background, font etc. as per your unique business setting.
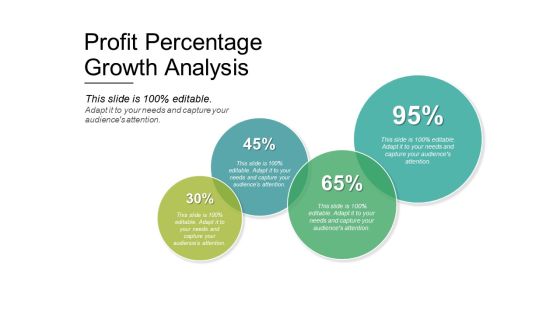
Profit Percentage Growth Analysis Ppt PowerPoint Presentation Layouts Graphics Tutorials
This is a profit percentage growth analysis ppt powerpoint presentation layouts graphics tutorials. This is a four stage process. The stages in this process are comparison chart, comparison table, comparison matrix.

Area Stacked Analysis Ppt PowerPoint Presentation Inspiration Slideshow
This is a area stacked analysis ppt powerpoint presentation inspiration slideshow. This is a two stage process. The stages in this process are area chart, finance, marketing, strategy, business.
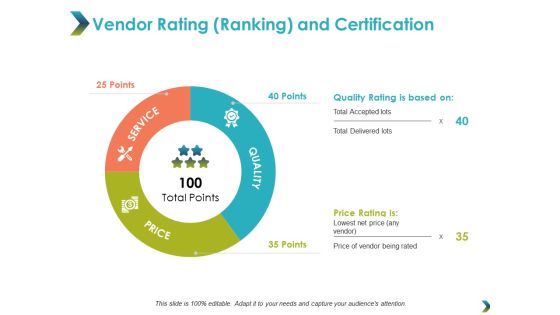
Vendor Rating Ranking And Certification Ppt Powerpoint Presentation Model Background Designs
This is a vendor rating ranking and certification ppt powerpoint presentation model background designs. This is a three stage process. The stages in this process are donut chart, finance, marketing, business, analysis.
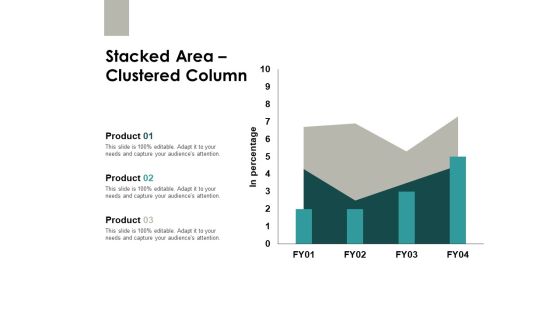
Stacked Area Clustered Column Finance Ppt PowerPoint Presentation Slides Images
This is a stacked area clustered column finance ppt powerpoint presentation slides images. This is a three stage process. The stages in this process are area chart, finance, marketing, analysis, investment.

Area Stacked Finance Ppt PowerPoint Presentation Inspiration Graphics Download
This is a area stacked finance ppt powerpoint presentation inspiration graphics download. This is a three stage process. The stages in this process are area chart, finance, marketing, analysis, investment.
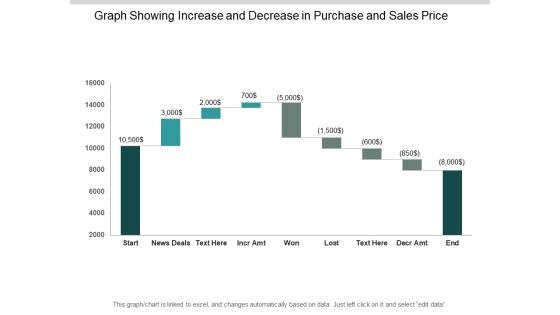
Graph Showing Increase And Decrease In Purchase And Sales Price Ppt PowerPoint Presentation Outline Gallery
This is a graph showing increase and decrease in purchase and sales price ppt powerpoint presentation outline gallery. This is a nine stage process. The stages in this process are sales waterfall, waterfall chart, business.

Sales Graph Showing Payouts Losses And Wins Ppt PowerPoint Presentation Pictures Designs Download
This is a sales graph showing payouts losses and wins ppt powerpoint presentation pictures designs download. This is a eight stage process. The stages in this process are sales waterfall, waterfall chart, business.

Waterfall Graph For Income And Expense Analysis Ppt PowerPoint Presentation File Deck
This is a waterfall graph for income and expense analysis ppt powerpoint presentation file deck. This is a eight stage process. The stages in this process are sales waterfall, waterfall chart, business.
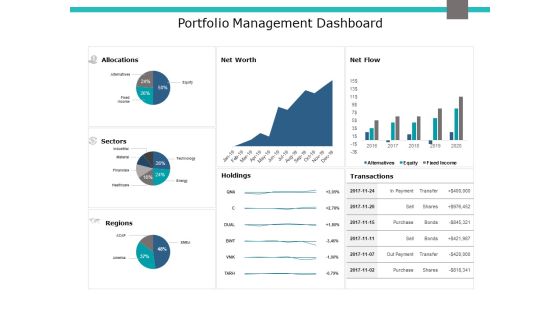
Portfolio Management Dashboard Ppt PowerPoint Presentation Gallery Example Introduction
This is a portfolio management dashboard ppt powerpoint presentation gallery example introduction. This is a three stage process. The stages in this process are area chart, finance, marketing, management, investment.
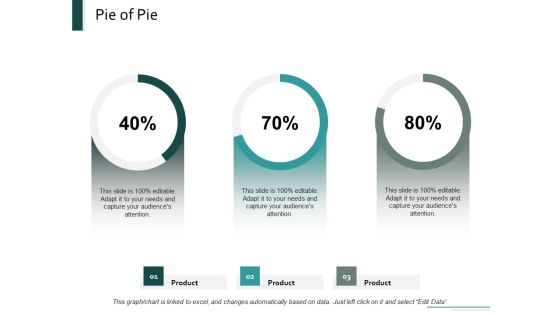
Pie Of Pie Marketing Ppt Powerpoint Presentation Inspiration Designs
This is a pie of pie marketing ppt powerpoint presentation inspiration designs. This is a three stage process. The stages in this process are finance, pie chart, product, marketing, percentage.

3d Man Global Business PowerPoint Templates And PowerPoint Themes 1012
3d Man Global Business PowerPoint Templates And PowerPoint Themes 1012-This template with an image of 3d man drawing a down bar graph helps you chart the course of your presentation. This image represents the downfall of the business or financial crisis. Our stunning and unique image makes your presentations simpler and professional showing that you care about even the smallest details. This template signifies global business, finance, marketing, statistics, strategy and success.-3d Man Global Business PowerPoint Templates And PowerPoint Themes 1012-This PowerPoint template can be used for presentations relating to-Global business man, earth, business, glabe, technology, success

Guide To Business Customer Acquisition Acquisition Channel Budget Allocation Plan Download PDF
This slide covers the client acquisition budget chart for allocating the required resources to a specific channel. It includes marketing channels such as SEO, PPC, social media marketing, event sponsorships, offline marketing, display, and remarketing ads. Explore a selection of the finest Guide To Business Customer Acquisition Acquisition Channel Budget Allocation Plan Download PDF here. With a plethora of professionally designed and pre made slide templates, you can quickly and easily find the right one for your upcoming presentation. You can use our Guide To Business Customer Acquisition Acquisition Channel Budget Allocation Plan Download PDF to effectively convey your message to a wider audience. Slidegeeks has done a lot of research before preparing these presentation templates. The content can be personalized and the slides are highly editable. Grab templates today from Slidegeeks.
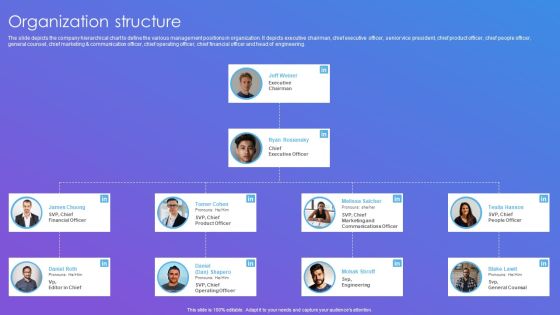
Linkedin Company Outline Organization Structure Guidelines PDF
The slide depicts the company hierarchical chart to define the various management positions in organization. It depicts executive chairman, chief executive officer, senior vice president, chief product officer, chief people officer, general counsel, chief marketing communication officer, chief operating officer, chief financial officer and head of engineering.Deliver an awe inspiring pitch with this creative Linkedin Company Outline Organization Structure Guidelines PDF bundle. Topics like Executive Chairman, Product Officer, Communications Officer can be discussed with this completely editable template. It is available for immediate download depending on the needs and requirements of the user.
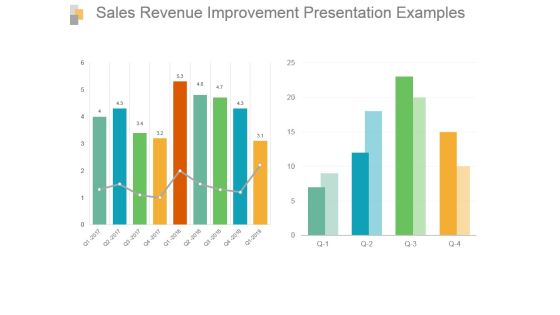
Sales Revenue Improvement Presentation Examples
This is a sales revenue improvement presentation examples. This is a two stage process. The stages in this process are bar graph, growth, sales, data, analysis.
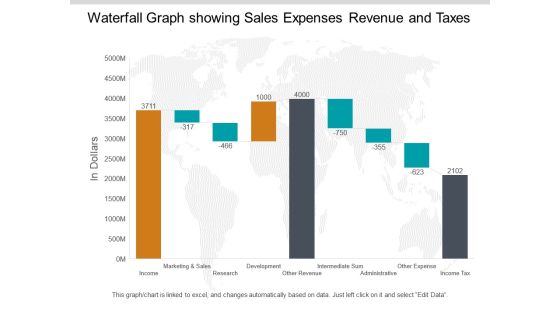
Waterfall Graph Showing Sales Expenses Revenue And Taxes Ppt PowerPoint Presentation Pictures Summary
This is a waterfall graph showing sales expenses revenue and taxes ppt powerpoint presentation pictures summary. This is a three stage process. The stages in this process are profit and loss, balance sheet, income statement, benefit and loss.

Community Engagement Platform Fundraising Pitch Deck Org Structure Brochure PDF
Mentioned slide provides information about organization chart of connecting platform providing company. It includes key departments such as legal, marketing , technical, and human resource. Formulating a presentation can take up a lot of effort and time, so the content and message should always be the primary focus. The visuals of the PowerPoint can enhance the presenters message, so our Community Engagement Platform Fundraising Pitch Deck Org Structure Brochure PDF was created to help save time. Instead of worrying about the design, the presenter can concentrate on the message while our designers work on creating the ideal templates for whatever situation is needed. Slidegeeks has experts for everything from amazing designs to valuable content, we have put everything into Community Engagement Platform Fundraising Pitch Deck Org Structure Brochure PDF

Population Census Male Female Ratio Powerpoint Template
This business slide contains graphics of pie charts with male female icons. This template helps to display male female population census. Present your views using this innovative slide and be assured of leaving a lasting impression.

Competitor Revenue And Profit Ppt PowerPoint Presentation Outline Elements
This is a competitor revenue and profit ppt powerpoint presentation outline elements. This is a five stage process. The stages in this process are bar graph, marketing, strategy, finance, planning.

Revenue Split By Product Segment Ppt PowerPoint Presentation Ideas Graphics
This is a revenue split by product segment ppt powerpoint presentation ideas graphics. This is a four stage process. The stages in this process are business, marketing, bar graph, success.

Competitor Revenue And Profit Template 1 Ppt PowerPoint Presentation Layouts Display
This is a competitor revenue and profit template 1 ppt powerpoint presentation layouts display. This is a five stage process. The stages in this process are business, bar graph, finance, marketing, analysis.

Sales Revenue Product Ppt PowerPoint Presentation Infographic Template Backgrounds
This is a sales revenue product ppt powerpoint presentation infographic template backgrounds. This is a three stage process. The stages in this process are product wise revenue, profit percent of total revenue, total income product.

Budgeting Planned Actual Comparison Ppt PowerPoint Presentation Gallery Graphic Tips
This is a budgeting planned actual comparison ppt powerpoint presentation gallery graphic tips. This is a three stage process. The stages in this process are planned cost, actual cost, value difference.

Competitor Revenue And Profit Ppt PowerPoint Presentation Icon Slide Download
This is a competitor revenue and profit ppt powerpoint presentation icon slide download. This is a five stage process. The stages in this process are revenue, profit, finance, marketing, strategy, analysis, business.

Bar Graph Template 1 Ppt PowerPoint Presentation Icon Layouts
This is a bar graph template 1 ppt powerpoint presentation icon layouts. This is a three stage process. The stages in this process are bar graph, finance, analysis, marketing, strategy.
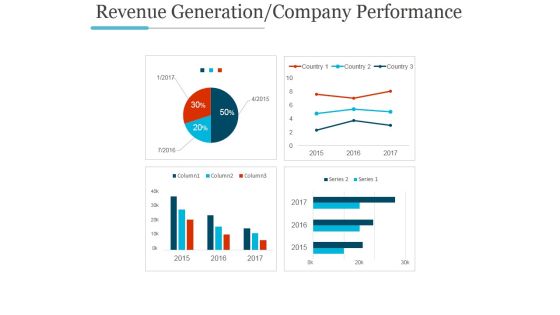
Revenue Generation Company Performance Ppt PowerPoint Presentation Inspiration
This is a revenue generation company performance ppt powerpoint presentation inspiration. This is a four stage process. The stages in this process are graph, growth, success, business, marketing.

Budgeting Template 3 Ppt PowerPoint Presentation Visual Aids Model
This is a budgeting template 3 ppt powerpoint presentation visual aids model. This is a five stage process. The stages in this process are bar graph, business, marketing, finance, planning.

Revenue Split By Product Segment Ppt PowerPoint Presentation Styles Elements
This is a revenue split by product segment ppt powerpoint presentation styles elements. This is a four stage process. The stages in this process are business, marketing, planning, finance, strategy.
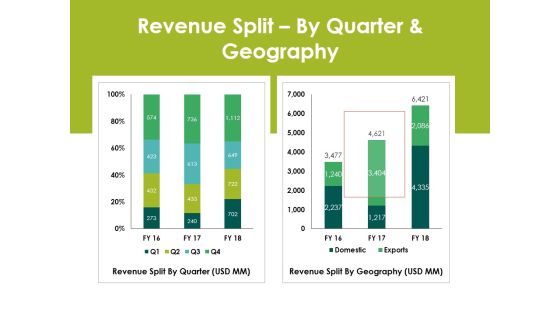
Revenue Splitby Quarter And Geography Ppt PowerPoint Presentation Layout
This is a revenue splitby quarter and geography ppt powerpoint presentation layout. This is a two stage process. The stages in this process are revenue split by quarter, revenue split by geography.

Sales Revenue Product Ppt PowerPoint Presentation Outline Portfolio
This is a sales revenue product ppt powerpoint presentation outline portfolio. This is a three stage process. The stages in this process are total income product, total revenue, product wise revenue, sales, business.

Competitor Revenue And Profit Ppt PowerPoint Presentation Slides Objects
This is a competitor revenue and profit ppt powerpoint presentation slides objects. This is a five stage process. The stages in this process are business, marketing, graph, finance, revenue.

Revenue Split By Product Segment Template 2 Ppt PowerPoint Presentation Gallery Example File
This is a revenue split by product segment template 2 ppt powerpoint presentation gallery example file. This is a four stage process. The stages in this process are business, marketing, graph, finance, revenue split.

Competitor Revenue And Profit Ppt PowerPoint Presentation Inspiration Slide Portrait
This is a competitor revenue and profit ppt powerpoint presentation inspiration slide portrait. This is a five stage process. The stages in this process are business, finance, analysis, growth, investment.

Competitor Revenue And Profit Ppt PowerPoint Presentation Professional Graphics Pictures
This is a competitor revenue and profit ppt powerpoint presentation professional graphics pictures. This is a five stage process. The stages in this process are business, marketing, strategy, graph, finance.

Competitor Revenue And Profit Template Ppt PowerPoint Presentation Model Design Inspiration
This is a competitor revenue and profit template ppt powerpoint presentation model design inspiration. This is a five stage process. The stages in this process are business, marketing, graph, success, growth.
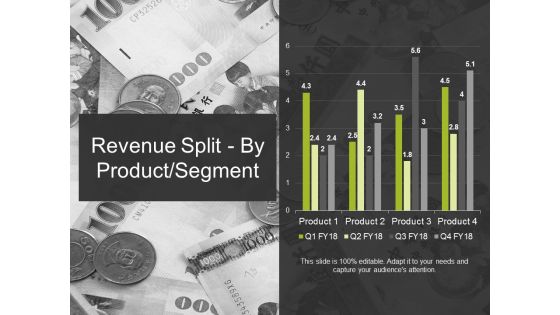
Revenue Split By Product Segment Template 2 Ppt PowerPoint Presentation Ideas Graphic Images
This is a revenue split by product segment template 2 ppt powerpoint presentation ideas graphic images. This is a four stage process. The stages in this process are business, marketing, finance, graph, strategy.

Revenue Split By Product Segment Template 2 Ppt PowerPoint Presentation Summary Good
This is a revenue split by product segment template 2 ppt powerpoint presentation summary good. This is a four stage process. The stages in this process are business, marketing, finance, strategy, graph.

Bar Graph Ppt PowerPoint Presentation Portfolio Design Templates
This is a bar graph ppt powerpoint presentation portfolio design templates. This is a four stage process. The stages in this process are business, marketing, bar, graph, finance.
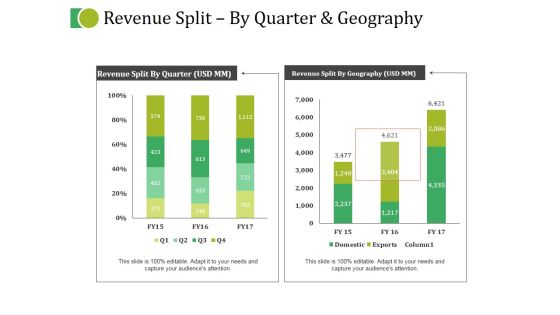
Revenue Split By Quarter And Geography Ppt PowerPoint Presentation Layouts Templates
This is a revenue split by quarter and geography ppt powerpoint presentation layouts templates. This is a two stage process. The stages in this process are business, marketing, strategy, planning, finance.

Bar Graph Template 2 Ppt PowerPoint Presentation Inspiration Backgrounds
This is a bar graph template 2 ppt powerpoint presentation inspiration backgrounds. This is a four stage process. The stages in this process are bar graph, finance, analysis, marketing, strategy.

Bar Graph Template 2 Ppt PowerPoint Presentation Ideas Files
This is a bar graph template 2 ppt powerpoint presentation ideas files. This is a five stage process. The stages in this process are in percentage, business, marketing, finance, graph.

Competitor Revenue And Profit Template 1 Ppt PowerPoint Presentation Professional Example File
This is a competitor revenue and profit template 1 ppt powerpoint presentation professional example file. This is a five stage process. The stages in this process are business, finance, marketing, strategy, analysis, growth.
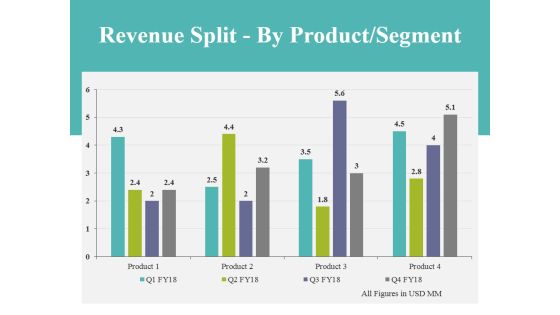
Revenue Split By Product Segment Template 2 Ppt PowerPoint Presentation Styles Guidelines
This is a revenue split by product segment template 2 ppt powerpoint presentation styles guidelines. This is a four stage process. The stages in this process are business, finance, analysis, marketing, strategy.

Budgeting Planned Actual Comparison Ppt PowerPoint Presentation Portfolio Background
This is a budgeting planned actual comparison ppt powerpoint presentation portfolio background. This is a three stage process. The stages in this process are planned cost, actual cost, value difference, deviation, bar graph.

Product Launch Budget Plan Ppt PowerPoint Presentation File Formats
This is a product launch budget plan ppt powerpoint presentation file formats. This is a seven stage process. The stages in this process are business, marketing, strategy, planning, bar graph.
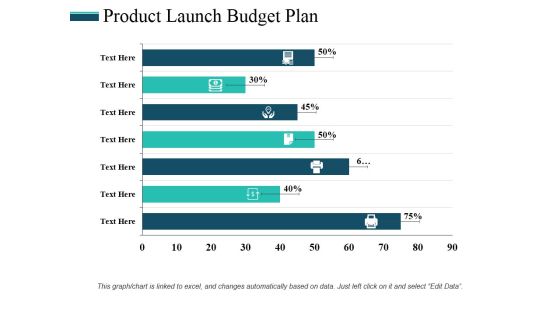
Product Launch Budget Plan Ppt PowerPoint Presentation Professional Rules
This is a product launch budget plan ppt powerpoint presentation professional rules. This is a seven stage process. The stages in this process are bar graph, finance, business, marketing, planning.
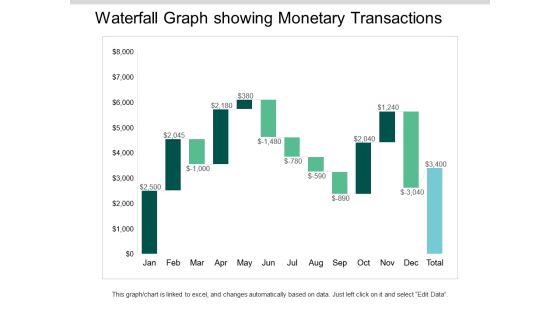
Waterfall Graph Showing Monetary Transactions Ppt PowerPoint Presentation Ideas Visuals
This is a waterfall graph showing monetary transactions ppt powerpoint presentation ideas visuals. This is a three stage process. The stages in this process are profit and loss, balance sheet, income statement, benefit and loss.

Competitor Market Share And Sales Revenues Ppt PowerPoint Presentation Model Graphics Example
This is a competitor market share and sales revenues ppt powerpoint presentation model graphics example. This is a four stage process. The stages in this process are business, marketing, strategy, finance, planning.

Revenue Split By Product And Segment Ppt PowerPoint Presentation Summary Portfolio
This is a revenue split by product and segment ppt powerpoint presentation summary portfolio. This is a two stage process. The stages in this process are business, marketing, strategy, planning, finance.

Competitor Market Share And Sales Revenues Ppt PowerPoint Presentation Gallery Gridlines
This is a competitor market share and sales revenues ppt powerpoint presentation gallery gridlines. This is a three stage process. The stages in this process are line, marketing, strategy, planning, finance.

Competitor Market Share And Sales Revenues Ppt PowerPoint Presentation Portfolio Summary
This is a competitor market share and sales revenues ppt powerpoint presentation portfolio summary. This is a four stage process. The stages in this process are business, marketing, strategy, planning, finance.
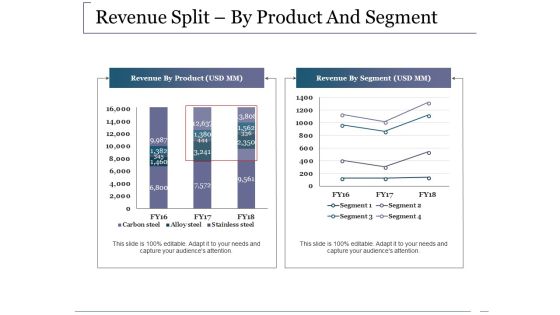
Revenue Split By Product And Segment Ppt PowerPoint Presentation Outline Shapes
This is a revenue split by product and segment ppt powerpoint presentation outline shapes. This is a two stage process. The stages in this process are business, revenue by product, revenue by segment, marketing, graph.

Revenue Split By Quarter And Geography Ppt PowerPoint Presentation Gallery Deck
This is a revenue split by quarter and geography ppt powerpoint presentation gallery deck. This is a two stage process. The stages in this process are business, marketing, graph, revenue split by quarter, revenue split by geography.

Revenue Splitby Product And Segment Ppt PowerPoint Presentation Styles Example File
This is a revenue splitby product and segment ppt powerpoint presentation styles example file. This is a two stage process. The stages in this process are revenue by product, revenue by segment, finance, strategy, business.
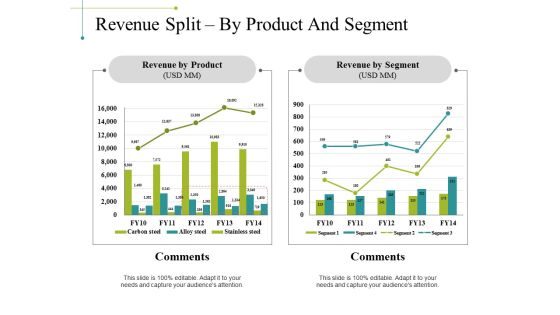
Revenue Split By Product And Segment Ppt PowerPoint Presentation Model Format Ideas
This is a revenue split by product and segment ppt powerpoint presentation model format ideas. This is a two stage process. The stages in this process are business, revenue by product, revenue by segment, comments, marketing.

Revenue Split By Quarter And Geography Ppt PowerPoint Presentation Slides Picture
This is a revenue split by quarter and geography ppt powerpoint presentation slides picture. This is a two stage process. The stages in this process are business, marketing, revenue split by quarter, revenue split by geography, comments.
