AI PPT Maker
Templates
PPT Bundles
Design Services
Business PPTs
Business Plan
Management
Strategy
Introduction PPT
Roadmap
Self Introduction
Timelines
Process
Marketing
Agenda
Technology
Medical
Startup Business Plan
Cyber Security
Dashboards
SWOT
Proposals
Education
Pitch Deck
Digital Marketing
KPIs
Project Management
Product Management
Artificial Intelligence
Target Market
Communication
Supply Chain
Google Slides
Research Services
 One Pagers
All Categories
-
Home
- Customer Favorites
- Financial Chart
Financial Chart
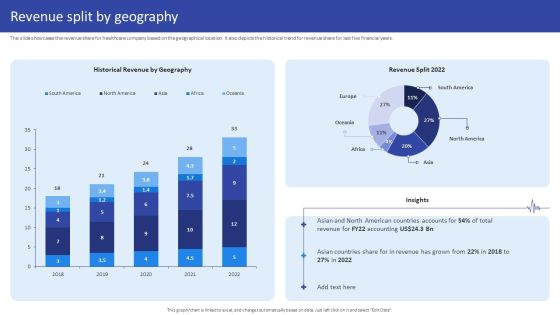
Hospital Medical Research Company Profile Revenue Split By Geography Portrait PDF
The slide showcases the revenue share for healthcare company based on the geographical location. It also depicts the historical trend for revenue share for last five financial years. Deliver and pitch your topic in the best possible manner with this Hospital Medical Research Company Profile Revenue Split By Geography Portrait PDF. Use them to share invaluable insights on Historical Revenue Geography, Revenue Split 2022, 2018 To 2022 and impress your audience. This template can be altered and modified as per your expectations. So, grab it now.

KPI Metrics Dashboard Highlighting Organization Revenue Profitability And Liquidity Formats PDF
The following slide outlines key performance indicator KPI dashboard showcasing various financial metrics of the organization. The key metrics are gross revenue, product revenue, service revenue, gross profit, net profit etc. From laying roadmaps to briefing everything in detail, our templates are perfect for you. You can set the stage with your presentation slides. All you have to do is download these easy to edit and customizable templates. KPI Metrics Dashboard Highlighting Organization Revenue Profitability And Liquidity Formats PDF will help you deliver an outstanding performance that everyone would remember and praise you for. Do download this presentation today.
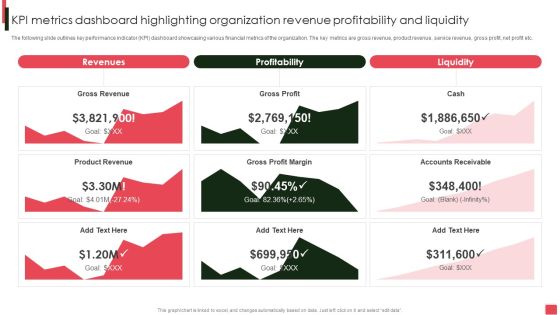
Overview Of Organizational Kpi Metrics Dashboard Highlighting Organization Revenue Brochure PDF
The following slide outlines key performance indicator KPI dashboard showcasing various financial metrics of the organization. The key metrics are gross revenue, product revenue, service revenue, gross profit, net profit etc. If your project calls for a presentation, then Slidegeeks is your go-to partner because we have professionally designed, easy-to-edit templates that are perfect for any presentation. After downloading, you can easily edit Overview Of Organizational Kpi Metrics Dashboard Highlighting Organization Revenue Brochure PDF and make the changes accordingly. You can rearrange slides or fill them with different images. Check out all the handy templates.

Russia Ukraine War Influence On Airline Sector Revenue Generated By Airline Companies Guidelines PDF
This slide showcases graph which illustrates revenue generated by full service and low cost airline companies before Russian Ukraine conflict escalation. It showcases data for a period of last 5 financial years Deliver an awe inspiring pitch with this creative russia ukraine war influence on airline sector revenue generated by airline companies guidelines pdf bundle. Topics like revenue generated by airline companies can be discussed with this completely editable template. It is available for immediate download depending on the needs and requirements of the user.

Film Making Company Outline Revenue And Net Profits Ppt PowerPoint Presentation Ideas Slide Portrait PDF
This slide represents the financial highlights of our film production house which includes revenue and net profits for last five years from 2018 to 2022 that shows highest revenue in 2022.Deliver an awe inspiring pitch with this creative Film Making Company Outline Revenue And Net Profits Ppt PowerPoint Presentation Ideas Slide Portrait PDF bundle. Topics like Revenue Increased, Five Years, Profit Increased can be discussed with this completely editable template. It is available for immediate download depending on the needs and requirements of the user.

Revenue Split By Geography Film Media Company Profile Ppt PowerPoint Presentation Infographics Infographics PDF
This slide represents the financial highlights of our film production house which includes revenue and net profits for last five years from 2018 to 2022 that shows highest revenue in 2022.Deliver and pitch your topic in the best possible manner with this Revenue Split By Geography Film Media Company Profile Ppt PowerPoint Presentation Infographics Infographics PDF. Use them to share invaluable insights on United States, Revenue Distribution, Key Insights and impress your audience. This template can be altered and modified as per your expectations. So, grab it now.

Term Life And General Insurance Company Profile Revenue Split By Activities Introduction PDF
The slide showcases the revenue share from different income sources for insurance company in last five financial years. It depicts revenue share from net earned premium, investment, commission and other income sources. Deliver and pitch your topic in the best possible manner with this Term Life And General Insurance Company Profile Revenue Split By Activities Introduction PDF. Use them to share invaluable insights on Revenue, Investment Services, Insurance and impress your audience. This template can be altered and modified as per your expectations. So, grab it now.
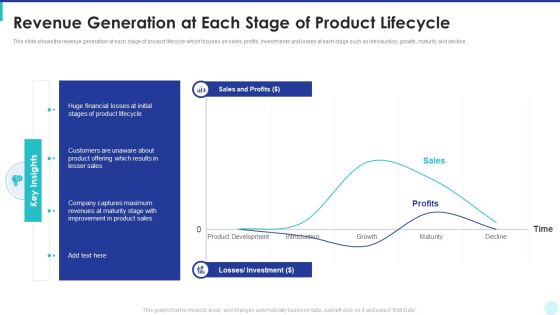
Optimization Of Product Development Life Cycle Revenue Generation At Each Stage Of Product Lifecycle Slides PDF
This slide shows the revenue generation at each stage of product lifecycle which focuses on sales, profits, investments and losses at each stage such as introduction, growth, maturity and decline. Deliver and pitch your topic in the best possible manner with this optimization of product development life cycle revenue generation at each stage of product lifecycle slides pdf. Use them to share invaluable insights on improvement, sales, revenues, financial and impress your audience. This template can be altered and modified as per your expectations. So, grab it now.
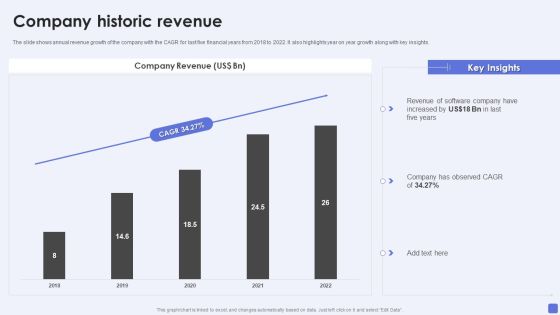
Software Services Business Profile Company Historic Revenue Ppt PowerPoint Presentation Gallery Graphics Download PDF
The slide shows annual revenue growth of the company with the CAGR for last five financial years from 2018 to 2022. It also highlights year on year growth along with key insights. Deliver and pitch your topic in the best possible manner with this Software Services Business Profile Company Historic Revenue Ppt PowerPoint Presentation Gallery Graphics Download PDF. Use them to share invaluable insights on Company Revenue, Observed CAGR, 2018 To 2022 and impress your audience. This template can be altered and modified as per your expectations. So, grab it now.
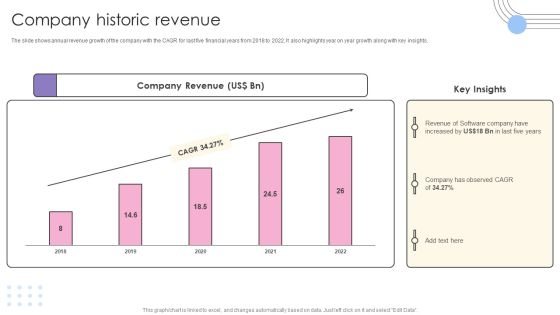
Software Products And Solutions Firm Details Company Historic Revenue Portrait PDF
The slide shows annual revenue growth of the company with the CAGR for last five financial years from 2018 to 2022. It also highlights year on year growth along with key insights. Deliver and pitch your topic in the best possible manner with this Software Products And Solutions Firm Details Company Historic Revenue Portrait PDF. Use them to share invaluable insights on Company Revenue, Observed CAGR, 2018 To 2022 and impress your audience. This template can be altered and modified as per your expectations. So, grab it now.

Property And Casualties Insurance Business Profile Sources Of Revenue Mockup PDF
The slide showcases the revenue earned by the insurance company from different income sources. It depicts revenue earned from net earned premium, investment, commission and other income sources for last five financial years. Deliver and pitch your topic in the best possible manner with this Property And Casualties Insurance Business Profile Sources Of Revenue Mockup PDF. Use them to share invaluable insights on Commission, Income, Investment, Net Earned Premium and impress your audience. This template can be altered and modified as per your expectations. So, grab it now.

KPI Dashboard To Monitor E Commerce Revenue Analysis Performance Mockup PDF
This slide shows the key performance indicators dashboard which can be used to analyze current financial position of e-commerce business. It includes metrics such as revenue, expenses, profit, cash in hand, etc. Showcasing this set of slides titled KPI Dashboard To Monitor E Commerce Revenue Analysis Performance Mockup PDF. The topics addressed in these templates are Accounts Receivable, Accounts Payable, Revenue, Expenses. All the content presented in this PPT design is completely editable. Download it and make adjustments in color, background, font etc. as per your unique business setting.
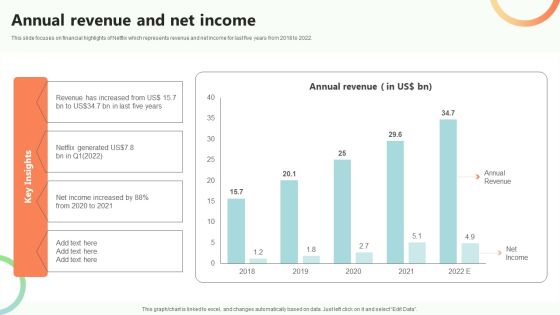
Online Video Content Provider Business Profile Annual Revenue And Net Income Background PDF
This slide focuses on financial highlights of Netflix which represents revenue and net income for last five years from 2018 to 2022. Find a pre designed and impeccable Online Video Content Provider Business Profile Annual Revenue And Net Income Background PDF. The templates can ace your presentation without additional effort. You can download these easy to edit presentation templates to make your presentation stand out from others. So, what are you waiting for Download the template from Slidegeeks today and give a unique touch to your presentation.

AI And ML Driving Monetary Value For Organization Organization Spending Behavior On AI Technologies Sample PDF
Mentioned slide illustrates organization spending behavior on artificial technologies. It covers information about actual investment done in FY20, ROI from AI technologies and forecasted investment change in FY21. Deliver and pitch your topic in the best possible manner with this ai and ml driving monetary value for organization organization spending behavior on ai technologies sample pdf. Use them to share invaluable insights on technologies, investment, financial and impress your audience. This template can be altered and modified as per your expectations. So, grab it now.

Security And Human Resource Services Business Profile Revenue By Customer Type Sample PDF
This slide highlights the security company revenue by customer type which includes government, financial institutions, major corporate and industries, retail, transport, leisure and tourism. The best PPT templates are a great way to save time, energy, and resources. Slidegeeks have 100 percent editable powerpoint slides making them incredibly versatile. With these quality presentation templates, you can create a captivating and memorable presentation by combining visually appealing slides and effectively communicating your message. Download Security And Human Resource Services Business Profile Revenue By Customer Type Sample PDF from Slidegeeks and deliver a wonderful presentation.

Web Interface Development Services Company Summary Revenue And Net Profit Analysis Slides PDF
This slide focuses on financial highlights of Web design company which represents revenue and net profit for last five years from 2019 to 2023. The Web Interface Development Services Company Summary Revenue And Net Profit Analysis Slides PDF is a compilation of the most recent design trends as a series of slides. It is suitable for any subject or industry presentation, containing attractive visuals and photo spots for businesses to clearly express their messages. This template contains a variety of slides for the user to input data, such as structures to contrast two elements, bullet points, and slides for written information. Slidegeeks is prepared to create an impression.
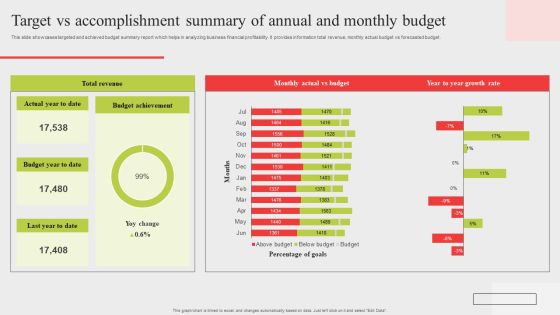
Target Vs Accomplishment Summary Of Annual And Monthly Budget Introduction PDF
This slide showcases targeted and achieved budget summary report which helps in analyzing business financial profitability. It provides information total revenue, monthly actual budget vs forecasted budget . Showcasing this set of slides titled Target Vs Accomplishment Summary Of Annual And Monthly Budget Introduction PDF. The topics addressed in these templates are Total Revenue, Budget Achievement, Monthly Actual Vs Budget. All the content presented in this PPT design is completely editable. Download it and make adjustments in color, background, font etc. as per your unique business setting.

Monthly Domestic Family Budget Plan Analysis Ppt PowerPoint Presentation Portfolio Guide PDF
The slide shows a bar graph analyzing monthly family budget for effective financial planning . It shows projected and actual cash flow, total income and total expenses.Showcasing this set of slides titled Monthly Domestic Family Budget Plan Analysis Ppt PowerPoint Presentation Portfolio Guide PDF. The topics addressed in these templates are Total Income, Total Expenses, Cash Flow. All the content presented in this PPT design is completely editable. Download it and make adjustments in color, background, font etc. as per your unique business setting.

Domestic Budget Plan Expenses Category Analysis Ppt PowerPoint Presentation Layouts Inspiration PDF
The slide shows a bar graph showing minimum and maximum percentage of spending in domestic financial management. It includes categories like food and non alcoholic, clothing and footwear, housing, water, electricity, domestic furnishing, health, transport, education, etc.Showcasing this set of slides titled Domestic Budget Plan Expenses Category Analysis Ppt PowerPoint Presentation Layouts Inspiration PDF. The topics addressed in these templates are Part Earnings, Electricity Consumptions, Least Spending. All the content presented in this PPT design is completely editable. Download it and make adjustments in color, background, font etc. as per your unique business setting.

Bar Graph Depicting Liquidity Ratio Analysis For 5 Years Graphics PDF
This showcases bar graph that can help organization to compare the liquidity ratios and take mitigation actions in case of decline. It showcases comparison of cash, quick and current ratio for a period of 5 financial years. Showcasing this set of slides titled Bar Graph Depicting Liquidity Ratio Analysis For 5 Years Graphics PDF. The topics addressed in these templates are Organization To Compare, The Liquidity Ratios, Mitigation Action Decline. All the content presented in this PPT design is completely editable. Download it and make adjustments in color, background, font etc. as per your unique business setting.
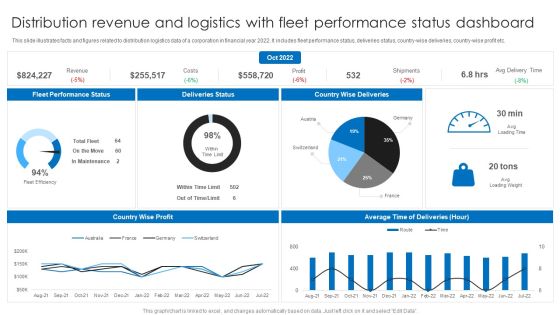
Distribution Revenue And Logistics With Fleet Performance Status Dashboard Ppt Layouts Background PDF
This slide illustrates facts and figures related to distribution logistics data of a corporation in financial year 2022. It includes fleet performance status, deliveries status, country-wise deliveries, country-wise profit etc. Pitch your topic with ease and precision using this Distribution Revenue And Logistics With Fleet Performance Status Dashboard Ppt Layouts Background PDF. This layout presents information on Deliveries Status, Country Wise Deliveries, Fleet Performance Status. It is also available for immediate download and adjustment. So, changes can be made in the color, design, graphics or any other component to create a unique layout.

Allocated Budget Analysis For Influencer Marketing Strategy Plan Infographics PDF
This slide showcases graphs that can help organization to identify the variance in spent vs allocated budget and estimate future financial forecasts. Its can also help to keep track of further expenses for influencer marketing strategy.Showcasing this set of slides titled Allocated Budget Analysis For Influencer Marketing Strategy Plan Infographics PDF. The topics addressed in these templates are Allocated Budget, Date Organization, Performance Media Budget. All the content presented in this PPT design is completely editable. Download it and make adjustments in color, background, font etc. as per your unique business setting.
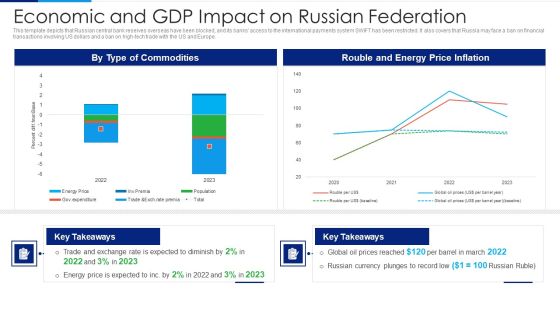
Russia Ukraine Conflict Effect Economic And GDP Impact On Russian Federation Clipart PDF
This template depicts that Russian central bank reserves overseas have been blocked, and its banks access to the international payments system SWIFT has been restricted. It also covers that Russia may face a ban on financial transactions involving US dollars and a ban on high-tech trade with the US and Europe. Deliver an awe inspiring pitch with this creative Russia Ukraine Conflict Effect Economic And GDP Impact On Russian Federation Clipart PDF bundle. Topics like By Type Of Commodities, Rouble And Energy Price Inflation, 2020 To 2023 can be discussed with this completely editable template. It is available for immediate download depending on the needs and requirements of the user.

Quarterly Budget Analysis Of Business Spend Analysis Of Organization Designs PDF
The purpose of the following slide is to highlight and analyze the spending of organizations finance department for any inconsistencies. It also graphically provides information regarding budget allocated and used for multiple expense categories. Deliver and pitch your topic in the best possible manner with this Quarterly Budget Analysis Of Business Spend Analysis Of Organization Designs PDF Use them to share invaluable insights on Financial Institutes, Record Keeping, Software Subscriptions and impress your audience. This template can be altered and modified as per your expectations. So, grab it now.

Budget Vs Actual Dashboard For Finance Department Brochure PDF
The slide illustrates the dashboard showing the income and expenses incurred by the finance department. The purpose of this slide is compare the budgeted figures with the actual cost, enabling effective analysis of financial activities. It include income budget, expense budget, and difference. Showcasing this set of slides titled Budget Vs Actual Dashboard For Finance Department Brochure PDF. The topics addressed in these templates are Income, Expenses, Expense Budget. All the content presented in this PPT design is completely editable. Download it and make adjustments in color, background, font etc. as per your unique business setting.

Budget Benchmark Report For Oncology Clinical Studies At Global Level Icons PDF
The slide showcases budget benchmarking to gauge and improve financial results by selecting few operating ratios by which company wants to measure its results and manage assets. Showcasing this set of slides titled Budget Benchmark Report For Oncology Clinical Studies At Global Level Icons PDF. The topics addressed in these templates are Benchmark Source, Key Insights, Actual Budget. All the content presented in this PPT design is completely editable. Download it and make adjustments in color, background, font etc. as per your unique business setting.
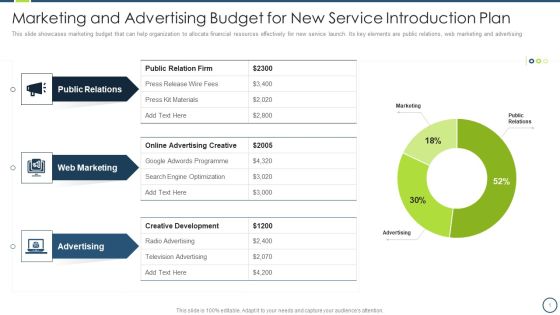
Marketing And Advertising Budget For New Service Introduction Plan Formats PDF
This slide showcases marketing budget that can help organization to allocate financial resources effectively for new service launch. Its key elements are public relations, web marketing and advertising. Showcasing this set of slides titled Marketing And Advertising Budget For New Service Introduction Plan Formats PDF. The topics addressed in these templates are Public Relations, Web Marketing, Advertising. All the content presented in this PPT design is completely editable. Download it and make adjustments in color, background, font etc. as per your unique business setting.

Project Budget Planning Dashboard With Income Statement Breakdown Professional PDF
This slide covers a dashboard which will help project managers for taking financial business decision by examining the income statement, income statement breakdown, cash flow and internal rate of return. Pitch your topic with ease and precision using this project budget planning dashboard with income statement breakdown professional pdf. This layout presents information on income statement, income statement breakdown, cash flow, internal rate of return . It is also available for immediate download and adjustment. So, changes can be made in the color, design, graphics or any other component to create a unique layout.

Strategic Planning Models For Non Profit Organizations Sources Cross Non Profit Organization Themes PDF
The slide shows the sources of financial support to Red Cross non profit organization in terms of operating revenues and gains along with various categories of contributions and operating expenses. Deliver and pitch your topic in the best possible manner with this strategic planning models for non profit organizations sources cross non profit organization themes pdf Use them to share invaluable insights on operating revenue and gains, total contributions, total operating expenses and impress your audience. This template can be altered and modified as per your expectations. So, grab it now.
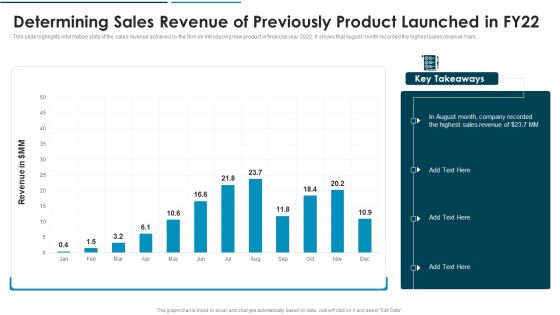
Go To Market Approach For New Product Product Launched In FY22 Inspiration PDF
This slide highlights information stats of the sales revenue achieved by the firm on introducing new product in financial year 2022. It shows that August month recorded the highest sales revenue mark.Deliver and pitch your topic in the best possible manner with this Go To Market Approach For New Product Product Launched In FY22 Inspiration PDF Use them to share invaluable insights on Determining Sales Revenue Of Previously Product Launched In Fy22 and impress your audience. This template can be altered and modified as per your expectations. So, grab it now.

Degree Of Bookkeeping And Finance Activities Automation Graphics PDF
The following slide highlights automation of finance and accounting activities using software. It includes tasks such as external reporting and financial controlling, cash disbursement, revenue management, tax, general accounting and analysis, general accounting operations, treasury, risk management etc. Pitch your topic with ease and precision using this Degree Of Bookkeeping And Finance Activities Automation Graphics PDF. This layout presents information on Tax Automation, Business Intelligence, Revenue Management. It is also available for immediate download and adjustment. So, changes can be made in the color, design, graphics or any other component to create a unique layout.
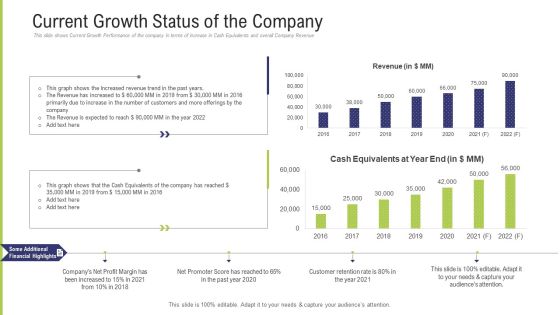
Funding Pitch Deck To Obtain Long Term Debt From Banks Current Growth Status Of The Company Diagrams PDF
This slide shows Current Growth Performance of the company in terms of increase in Cash Equivalents and overall Company Revenue. Deliver and pitch your topic in the best possible manner with this funding pitch deck to obtain long term debt from banks current growth status of the company diagrams pdf. Use them to share invaluable insights on revenue, cash equivalents, financial highlights, profit margin, customer retention rate and impress your audience. This template can be altered and modified as per your expectations. So, grab it now.

Companys Market Position Growth And Profitability Template PDF
This slide provides the financial highlight of the company including market share for the year 2021 Active customers from the year 2017 to 2021 and Annual revenue split by business segments from the year 2017 to 2021 Deliver and pitch your topic in the best possible manner with this companys market position growth and profitability template pdf. Use them to share invaluable insights on market share, active customers, annual revenue split and impress your audience. This template can be altered and modified as per your expectations. So, grab it now.

Commercial Banking Template Collection Companys Market Position Growth And Profitability Inspiration PDF
This slide provides the financial highlight of the company including market share for the year 2020 Active customers from the year 2016 to 2020 and Annual revenue split by business segments from the year 2016 to 2020. Deliver an awe-inspiring pitch with this creative commercial banking template collection companys market position growth and profitability inspiration pdf bundle. Topics like market share, active customers, annual revenue split can be discussed with this completely editable template. It is available for immediate download depending on the needs and requirements of the user.
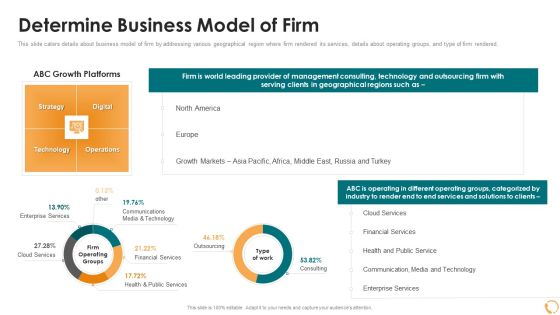
services sales capital investment pitch deck determine business model of firm pictures pdf
This slide caters details about business model of firm by addressing various geographical region where firm rendered its services, details about operating groups, and type of firm rendered. Deliver an awe inspiring pitch with this creative services sales capital investment pitch deck determine business model of firm pictures pdf bundle. Topics like enterprise services, cloud services, financial services, outsourcing, health and public services can be discussed with this completely editable template. It is available for immediate download depending on the needs and requirements of the user.
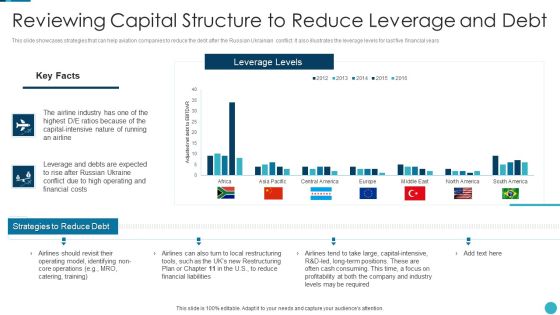
Russia Ukraine War Influence On Airline Sector Reviewing Capital Structure To Reduce Leverage Pictures PDF
This slide showcases strategies that can help aviation companies to reduce the debt after the Russian Ukrainian conflict. It also illustrates the leverage levels for last five financial years Deliver and pitch your topic in the best possible manner with this russia ukraine war influence on airline sector reviewing capital structure to reduce leverage pictures pdf Use them to share invaluable insights on strategies to reduce debt, leverage levels, restructuring tools and impress your audience. This template can be altered and modified as per your expectations. So, grab it now.

Distribution Strategies For Increasing Impact Analysis Of New Distribution Strategies Elements PDF
This slide covers financial impact of new distribution strategies on revenue, gross profit margins, net profit margins and distribution and logistics cost. Company revenues has increased, profit margins have improved and distribution cost has decreased. The best PPT templates are a great way to save time, energy, and resources. Slidegeeks have 100 percent editable powerpoint slides making them incredibly versatile. With these quality presentation templates, you can create a captivating and memorable presentation by combining visually appealing slides and effectively communicating your message. Download Distribution Strategies For Increasing Impact Analysis Of New Distribution Strategies Elements PDF from Slidegeeks and deliver a wonderful presentation.

Cost And Schedule Variance Analysis In Earned Value Management Ppt Pictures Design Ideas PDF
This slide represents cost and schedule variance analysis in earned value management illustrating planned value, earned value, actual cost etc used for indicating cost performance index. Showcasing this set of slides titled Cost And Schedule Variance Analysis In Earned Value Management Ppt Pictures Design Ideas PDF. The topics addressed in these templates are CPI Indicates, Financial Effectiveness, Efficiency Project. All the content presented in this PPT design is completely editable. Download it and make adjustments in color, background, font etc. as per your unique business setting.

Funding Pitch Book Outline Companys Market Position Growth And Profitability Professional PDF
This slide provides the financial highlight of the company including market share for the year 2021 Active customers from the year 2017 to 2021 and Annual revenue split by business segments from the year 2017 to 2021. Deliver an awe inspiring pitch with this creative funding pitch book outline companys market position growth and profitability professional pdf bundle. Topics like annual revenue split, active customers, market share can be discussed with this completely editable template. It is available for immediate download depending on the needs and requirements of the user.

Information Technology Transformation Organization Year Over Year Operations Performance Professional PDF
Following slide compares operations performance of the company in financial years 2020 and 2021. It covers production volume, sales revenues, number of active manufacturing plant status and most common defects. Deliver and pitch your topic in the best possible manner with this information technology transformation organization year over year operations performance professional pdf. Use them to share invaluable insights on sales revenues, manufacturing, production volume and impress your audience. This template can be altered and modified as per your expectations. So, grab it now.
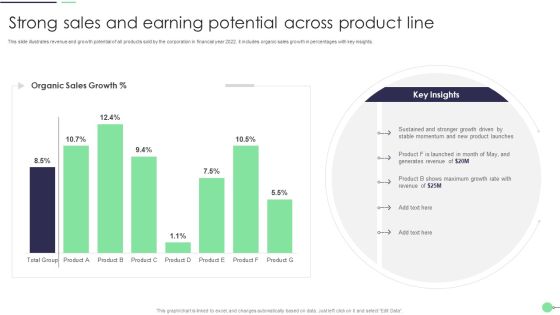
Strong Sales And Earning Potential Across Product Line Professional PDF
This slide illustrates revenue and growth potential of all products sold by the corporation in financial year 2022. it includes organic sales growth in percentages with key insights. Showcasing this set of slides titled Strong Sales And Earning Potential Across Product Line Professional PDF. The topics addressed in these templates are Product Launches, Generates Revenue, Growth Rate. All the content presented in this PPT design is completely editable. Download it and make adjustments in color, background, font etc. as per your unique business setting.

Year Over Year Operations Performance Ppt Infographic Template Shapes PDF
Following slide compares operations performance of the company in financial years 2018 and 2019. It covers production volume, sales revenues, number of active manufacturing plant status and most common defects.Deliver and pitch your topic in the best possible manner with this year over year operations performance ppt infographic template shapes pdf. Use them to share invaluable insights on most common defects, most common defects, active manufacturing plants, production volume and impress your audience. This template can be altered and modified as per your expectations. So, grab it now.
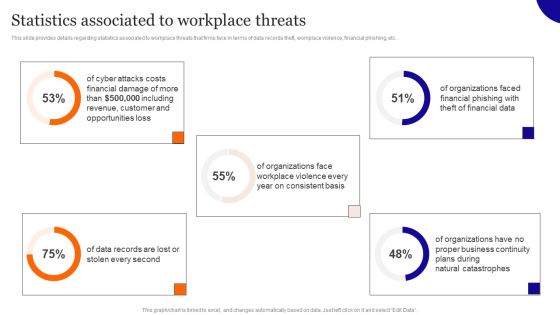
Statistics Associated To Workplace Threats Diagrams PDF
This slide provides details regarding statistics associated to workplace threats that firms face in terms of data records theft, workplace violence, financial phishing, etc. Get a simple yet stunning designed Statistics Associated To Workplace Threats Diagrams PDF. It is the best one to establish the tone in your meetings. It is an excellent way to make your presentations highly effective. So, download this PPT today from Slidegeeks and see the positive impacts. Our easy-to-edit Statistics Associated To Workplace Threats Diagrams PDF can be your go-to option for all upcoming conferences and meetings. So, what are you waiting for Grab this template today.

Data And Customer Analysis Company Outline Earning Per Share Free Cash Flow And EBITDA Structure PDF
This slide highlights the Nielsen Adj EBITDA margin, free cash flow, earnings per share, and organic constant currency revenue growth of the financial year 2021 with margin trend. Boost your pitch with our creative Data And Customer Analysis Company Outline Earning Per Share Free Cash Flow And EBITDA Structure PDF. Deliver an awe-inspiring pitch that will mesmerize everyone. Using these presentation templates you will surely catch everyones attention. You can browse the ppts collection on our website. We have researchers who are experts at creating the right content for the templates. So you do not have to invest time in any additional work. Just grab the template now and use them.

Business Executive Summary KPI Dashboard For Year 2023 Graphics PDF
The following slide highlights the overall business performance for the financial year 2021 to assess variations and trace accuracy. It includes KPIs such as total income, expenditures, revenue and expense breakdown, fund structure etc. Pitch your topic with ease and precision using this Business Executive Summary KPI Dashboard For Year 2023 Graphics PDF. This layout presents information on Revenue Breakdown, Revenue Category, Expense Breakdown. It is also available for immediate download and adjustment. So, changes can be made in the color, design, graphics or any other component to create a unique layout.
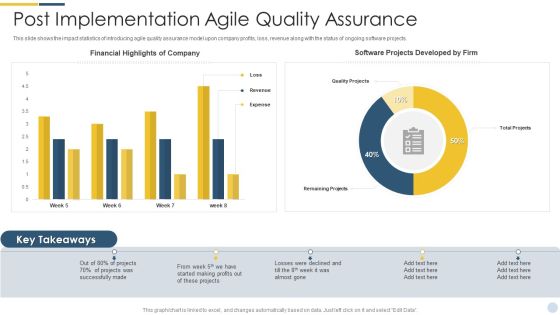
Quality Assurance Procedure In Agile Project Post Implementation Agile Quality Assurance Portrait PDF
This slide shows the impact statistics of introducing agile quality assurance model upon company profits, loss, revenue along with the status of ongoing software projects. Deliver an awe inspiring pitch with this creative quality assurance procedure in agile project post implementation agile quality assurance portrait pdf bundle. Topics like financial highlights of company, software projects developed by firm, projects was successfully made can be discussed with this completely editable template. It is available for immediate download depending on the needs and requirements of the user.

Dashboard Showing Earning Potential From Corporate Trends Demonstration PDF
This slide illustrates facts and figures related to five years of corporate financial figures for evaluation of expected profit. It includes yearly revenue and EBITDA, PAT and PAT margin, net worth and return on net worth etc. Showcasing this set of slides titled Dashboard Showing Earning Potential From Corporate Trends Demonstration PDF. The topics addressed in these templates are Potential From Corporate Trends, Dashboard Showing Earning. All the content presented in this PPT design is completely editable. Download it and make adjustments in color, background, font etc. as per your unique business setting.
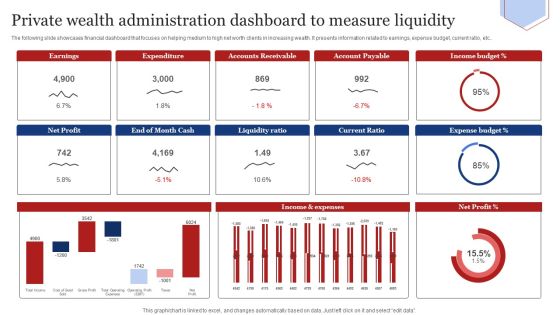
Private Wealth Administration Dashboard To Measure Liquidity Infographics PDF
The following slide showcases financial dashboard that focuses on helping medium to high net worth clients in increasing wealth. It presents information related to earnings, expense budget, current ratio, etc. Showcasing this set of slides titled Private Wealth Administration Dashboard To Measure Liquidity Infographics PDF. The topics addressed in these templates are Liquidity Ratio, Current Ratio, Expense Budget. All the content presented in this PPT design is completely editable. Download it and make adjustments in color, background, font etc. as per your unique business setting.
Soft Drink Company Executive Report Overview Icons PDF
This slide illustrate soft drink manufacturing company overview along with its vision and mission statement. It includes elements such as company background, key facts about company, sales, revenue and cost of goods comparison etc. Pitch your topic with ease and precision using this Soft Drink Company Executive Report Overview Icons PDF. This layout presents information on Vision, Products, Financial Comparison. It is also available for immediate download and adjustment. So, changes can be made in the color, design, graphics or any other component to create a unique layout.
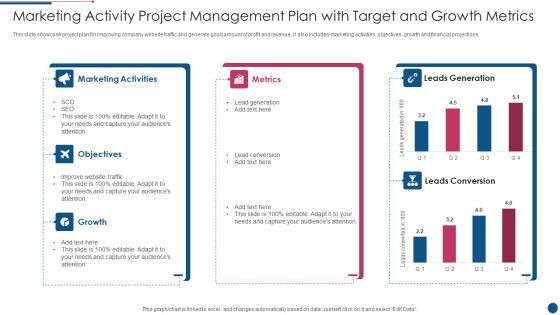
Marketing Activity Project Management Plan With Target And Growth Metrics Introduction PDF
This slide showcase project plan for improving company website traffic and generate good amount of profit and revenue, it also includes marketing activities, objectives, growth and financial projections. Pitch your topic with ease and precision using this Marketing Activity Project Management Plan With Target And Growth Metrics Introduction PDF. This layout presents information on Marketing Activities, Metrics, Growth. It is also available for immediate download and adjustment. So, changes can be made in the color, design, graphics or any other component to create a unique layout.
Professional Scrum Master Training IT Software Development Progress Tracking Dashboard Mockup PDF
This slide portrays software development project management dashboard with KPIs namely status of planning, design, development, testing project launch date, project budget, overdue tasks, workload and upcoming deadlines. Deliver and pitch your topic in the best possible manner with this professional scrum master training it software development progress tracking dashboard mockup pdf. Use them to share invaluable insights on financial risk, people risk, governance risk, competitive risk, system or technology and impress your audience. This template can be altered and modified as per your expectations. So, grab it now.

Action Plan To Implement Exit Strategy For Investors Liquidity Analysis Of Company Portrait PDF
The following slide displays the analysis of the companies liquidity ratio of the financial year 18 and 19 as its analysis the current ratio , quick ratio and the net working capital of the organization. Deliver an awe inspiring pitch with this creative Action Plan To Implement Exit Strategy For Investors Liquidity Analysis Of Company Portrait PDF bundle. Topics like Organization, Growth, Quick Ratios can be discussed with this completely editable template. It is available for immediate download depending on the needs and requirements of the user.

Organizational Tactical Plan Of Action Tools Usage Ppt Show Ideas PDF
This slide exhibit percentage of companies using tactical planning tools and techniques in their daily business decision making process. It includes organizations such as financial sectors, business groups, private companies, joint ventures etc. Showcasing this set of slides titled Organizational Tactical Plan Of Action Tools Usage Ppt Show Ideas PDF. The topics addressed in these templates are Mostly Used, Moderately Used, Rarely Used. All the content presented in this PPT design is completely editable. Download it and make adjustments in color, background, font etc. as per your unique business setting.
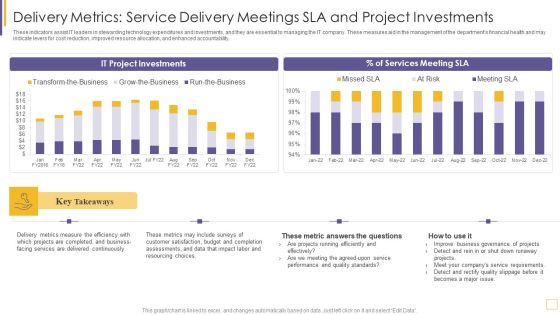
Guidelines For Exhibiting Business Value Of Information And Technology Delivery Metrics Service Portrait PDF
These indicators assist IT leaders in stewarding technology expenditures and investments, and they are essential to managing the IT company. These measures aid in the management of the departments financial health and may indicate levers for cost reduction, improved resource allocation, and enhanced accountability. Deliver and pitch your topic in the best possible manner with this guidelines for exhibiting business value of information and technology delivery metrics service portrait pdf. Use them to share invaluable insights on metrics measure, services, budget, resourcing and impress your audience. This template can be altered and modified as per your expectations. So, grab it now.

Current And Quick Ratio Comparison Graph For Liquidity Assessment Structure PDF
This slide showcases current and quick ratio graph that can help to evaluate companys liquidity and and assess the company abilities to pay off debt. It also showcases comparison of ratio with previous financial year. Showcasing this set of slides titled Current And Quick Ratio Comparison Graph For Liquidity Assessment Structure PDF. The topics addressed in these templates are Short Term Debt, Delayed Payments, Cash Shortage. All the content presented in this PPT design is completely editable. Download it and make adjustments in color, background, font etc. as per your unique business setting.

Line Comparison Graph For Yearly Liquidity Ratio Analysis Comparison Topics PDF
This slide showcases liquidity ratios graph that can help in identifying cash richness and financial position of organization. It showcases comparison for last 6 years and it key components are current ratio, quick ratio and cash ratio. Showcasing this set of slides titled Line Comparison Graph For Yearly Liquidity Ratio Analysis Comparison Topics PDF. The topics addressed in these templates are Term Financing, Cash Shortage, Cash Ratio. All the content presented in this PPT design is completely editable. Download it and make adjustments in color, background, font etc. as per your unique business setting.

Cost Escalation Reasons In Road Construction Project Issues Information PDF
This slide illustrate reason any road construction project get delay or issues get escalated to higher authority. It includes elements such as delay in payment, financial difficulties, modification in contract, economic circumstances, material shortage etc. Showcasing this set of slides titled Cost Escalation Reasons In Road Construction Project Issues Information PDF. The topics addressed in these templates are Lack Of Payment, Delay In Road, Limited Resources. All the content presented in this PPT design is completely editable. Download it and make adjustments in color, background, font etc. as per your unique business setting.

Automated Dashboard To Track Status Of Order Request Themes PDF
The following slide highlights automated dashboard which can be used to track the status of pleased orders, and manage the inventory across various outlets. The key performance indicators are order, summary, inventory, summary, cost of goods sold, financial statement. Showcasing this set of slides titled Automated Dashboard To Track Status Of Order Request Themes PDF. The topics addressed in these templates are Inventory Value, Inventory Summary, Cost. All the content presented in this PPT design is completely editable. Download it and make adjustments in color, background, font etc. as per your unique business setting.

Clinical Services Company Profile Net Profit And Margin Diagrams PDF
The slide showcases the bottom line for healthcare group along with net profit margin for last five financial year. It also depict net profit share for FY22 from pharmacy, hospital and research business verticals. Deliver and pitch your topic in the best possible manner with this Clinical Services Company Profile Net Profit And Margin Diagrams PDF. Use them to share invaluable insights on Net Profit, Business, Margin and impress your audience. This template can be altered and modified as per your expectations. So, grab it now.

Various Reasons For Corporate Cultural Transformation Diagrams PDF
This slide exhibits survey results to understand reasons for changing company culture that helps to sustain dynamic environment. It include reasons such as new technology, management, financial loss, business performance etc. Showcasing this set of slides titled Various Reasons For Corporate Cultural Transformation Diagrams PDF. The topics addressed in these templates are Various Reasons Corporate, Cultural Transformation. All the content presented in this PPT design is completely editable. Download it and make adjustments in color, background, font etc. as per your unique business setting.
