Financial Budget
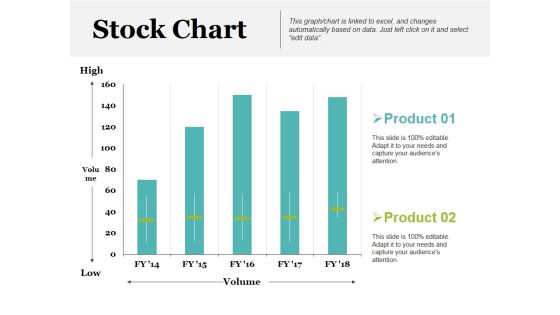
Stock Chart Ppt PowerPoint Presentation Inspiration Example Introduction
This is a stock chart ppt powerpoint presentation inspiration example introduction. This is a two stage process. The stages in this process are product, high, volume, low, stock chart.
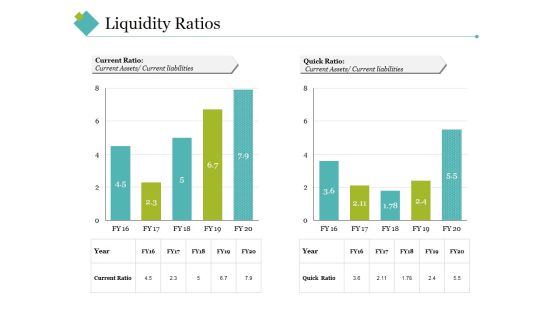
Liquidity Ratios Template 2 Ppt PowerPoint Presentation Gallery Vector
This is a liquidity ratios template 2 ppt powerpoint presentation gallery vector. This is a two stage process. The stages in this process are quick ratio, current ratio, current liabilities, current assets.
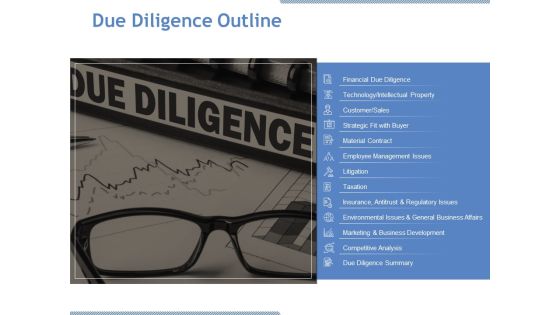
Due Diligence Outline Ppt PowerPoint Presentation Inspiration Gallery
This is a due diligence outline ppt powerpoint presentation inspiration gallery. This is a one stage process. The stages in this process are customer, material contract, litigation, taxation, competitive analysis.

Stacked Line Ppt PowerPoint Presentation Pictures Example Topics
This is a stacked line ppt powerpoint presentation pictures example topics. This is a three stage process. The stages in this process are product, in percentage, stacked line, business, marketing.
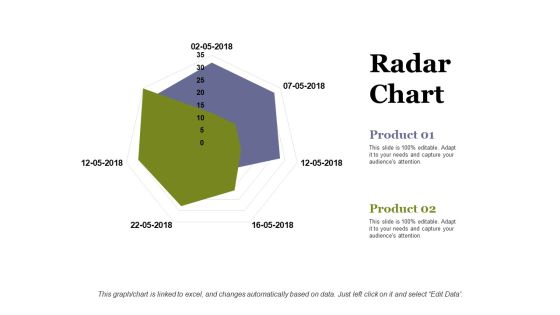
Radar Chart Ppt PowerPoint Presentation Infographic Template Information
This is a radar chart ppt powerpoint presentation infographic template information. This is a two stage process. The stages in this process are radar chart, product, business, marketing, shape.

Stacked Line Ppt PowerPoint Presentation Infographics Vector
This is a stacked line ppt powerpoint presentation infographics vector. This is a three stage process. The stages in this process are product, stacked line, business, marketing, in percentage.

Comparison Ppt PowerPoint Presentation Professional Example File
This is a comparison ppt powerpoint presentation professional example file. This is a two stage process. The stages in this process are male, female, comparison.

Stock Chart Ppt PowerPoint Presentation Ideas Infographics
This is a stock chart ppt powerpoint presentation ideas infographics. This is a two stage process. The stages in this process are high, volume, low, product, stock chart.

Area Chart Ppt PowerPoint Presentation Professional Grid
This is a area chart ppt powerpoint presentation professional grid. This is a two stage process. The stages in this process are product, sales in percentage, business.

Control Chart Template 1 Ppt PowerPoint Presentation Ideas Images
This is a control chart template 1 ppt powerpoint presentation ideas images. This is a two stage process. The stages in this process are average range or quality, upper control limit, lower control limit, time, process average.

Control Chart Template 2 Ppt PowerPoint Presentation Portfolio Summary
This is a control chart template 2 ppt powerpoint presentation portfolio summary. This is a one stage process. The stages in this process are upper control limit, process segment, process change, unstable trend, lower control limit.

Bar Chart Ppt PowerPoint Presentation Portfolio Inspiration
This is a bar chart ppt powerpoint presentation portfolio inspiration. This is a two stage process. The stages in this process are product, in percentage, in years.

Marketing Reach By Channels Ppt PowerPoint Presentation Styles Professional
This is a marketing reach by channels ppt powerpoint presentation styles professional. This is a six stage process. The stages in this process are top performing, non scalable, emails, print ads, inline media.

Stock Chart Ppt PowerPoint Presentation Layouts Outfit
This is a stock chart ppt powerpoint presentation layouts outfit. This is a two stage process. The stages in this process are close, high, volume, low, open.
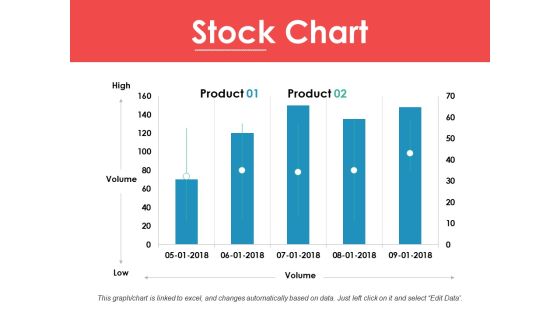
Stock Chart Ppt PowerPoint Presentation Ideas Infographic Template
This is a stock chart ppt powerpoint presentation ideas infographic template. This is a two stage process. The stages in this process are high, volume, low, product, stock chart.

Stock Chart Ppt PowerPoint Presentation Guide
This is a stock chart ppt powerpoint presentation guide. This is a two stage process. The stages in this process are product, close, high, volume, low.
Volume Open High Low Close Chart Ppt PowerPoint Presentation Icon Design Inspiration
This is a volume open high low close chart ppt powerpoint presentation icon design inspiration. This is a three stage process. The stages in this process are close, high, low, volume, open.

Debit Card Payment Processing Steps With Icons Ppt PowerPoint Presentation Portfolio Background
This is a debit card payment processing steps with icons ppt powerpoint presentation portfolio background. This is a six stage process. The stages in this process are payment processing, instalment processing, premium processing.
Human Hand With Percent Sign Ppt PowerPoint Presentation Icon Clipart Images
This is a human hand with percent sign ppt powerpoint presentation icon clipart images. This is a three stage process. The stages in this process are percentage icon, dividend icon, portion icon.
Percentage Icon In Circle With Text Holders Ppt PowerPoint Presentation Layouts Inspiration
This is a percentage icon in circle with text holders ppt powerpoint presentation layouts inspiration. This is a three stage process. The stages in this process are percentage icon, dividend icon, portion icon.

Percentage Symbol With Text Holders Ppt PowerPoint Presentation Example 2015
This is a percentage symbol with text holders ppt powerpoint presentation example 2015. This is a three stage process. The stages in this process are percentage icon, dividend icon, portion icon.
Percentage Value Comparison Pie Chart Icon Ppt PowerPoint Presentation Model Clipart Images
This is a percentage value comparison pie chart icon ppt powerpoint presentation model clipart images. This is a three stage process. The stages in this process are percentage icon, dividend icon, portion icon.
White Percentage Sign In Green Circle Ppt PowerPoint Presentation Outline Templates
This is a white percentage sign in green circle ppt powerpoint presentation outline templates. This is a three stage process. The stages in this process are percentage icon, dividend icon, portion icon.
Dollar Coins Falling On Man Vector Icon Ppt PowerPoint Presentation Files PDF
Presenting this set of slides with name dollar coins falling on man vector icon ppt powerpoint presentation files pdf. This is a three stage process. The stages in this process are dollar coins falling on man vector icon. This is a completely editable PowerPoint presentation and is available for immediate download. Download now and impress your audience.
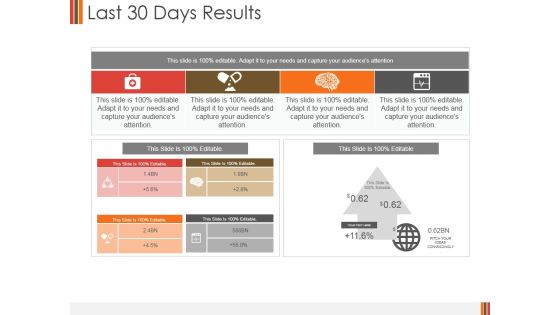
Last 30 Days Results Ppt PowerPoint Presentation Layouts Shapes
This is a last 30 days results ppt powerpoint presentation layouts shapes. This is a four stage process. The stages in this process are business, finance, management, analysis, strategy, success.
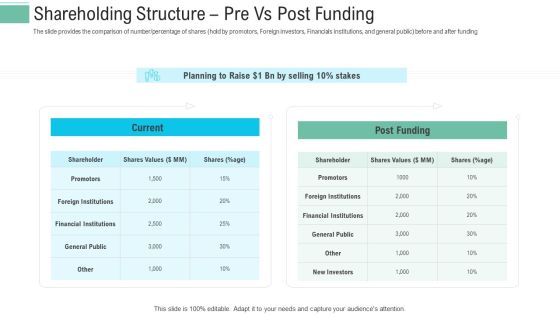
Pitch Presentation Raise Money Spot Market Shareholding Structure Pre Vs Post Funding Slides PDF
The slide provides the comparison of number or percentage of shares hold by promotors, Foreign investors, Financials institutions, and general public before and after funding. Deliver an awe-inspiring pitch with this creative pitch presentation raise money spot market shareholding structure pre vs post funding slides pdf bundle. Topics like shareholder, promotors, financial institutions can be discussed with this completely editable template. It is available for immediate download depending on the needs and requirements of the user.
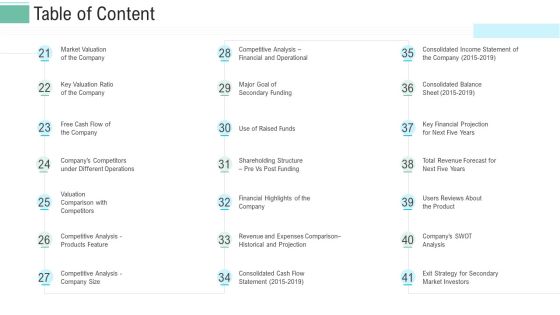
Pitch Presentation Raise Money Spot Market Table Of Content Use Ppt Portfolio Outfit PDF
Deliver an awe-inspiring pitch with this creative pitch presentation raise money spot market table of content use ppt portfolio outfit pdf bundle. Topics like competitive analysis, market valuation, financial and operational can be discussed with this completely editable template. It is available for immediate download depending on the needs and requirements of the user.
Strategy Diagram Profit And Loss Balance And Cash Flow Statements Mba Models And Frameworks
Be The Doer With Our Strategy Diagram Profit And Loss Balance And Cash Flow Statements MBA Models And Frameworks Powerpoint Templates. Put Your Thoughts Into Practice.
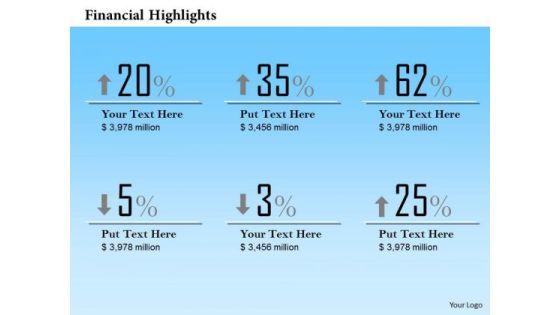
Mba Models And Frameworks Profit Percentage Analysis Diagram Strategic Management
Our MBA Models And Frameworks Profit Percentage Analysis Diagram Strategic Management Powerpoint Templates Abhor Doodling. They Never Let The Interest Flag. Our MBA Models And Frameworks Profit Percentage Analysis Diagram Strategic Management Powerpoint Templates Make Good Beasts Of Burden. Place All Your Demands On Them.
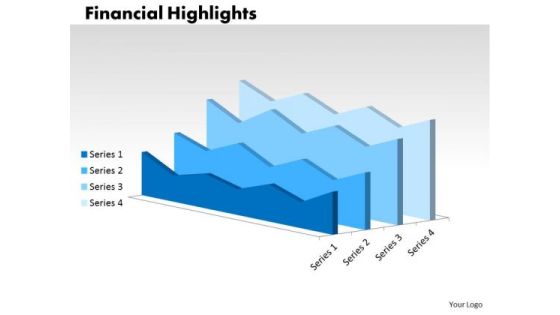
Strategy Diagram Growth Analysis Chart Diagram Consulting Diagram
Double Up Our Strategy Diagram Growth Analysis Chart Diagram Consulting Diagram Powerpoint Templates With Your Thoughts. They Will Make An Awesome Pair. When In Doubt Use Our Strategy Diagram Growth Analysis Chart Diagram Consulting Diagram Powerpoint Templates. The Way Ahead Will Become Crystal Clear.

5S Scoring Result Ppt Slides
This is a 5s scoring result ppt slides. This is a five stage process. The stages in this process are business.
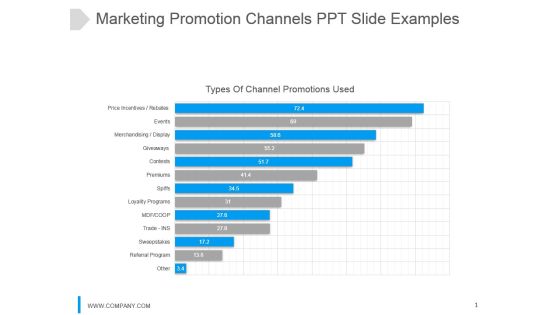
Marketing Promotion Channels Ppt Slide Examples
This is a marketing promotion channels ppt slide examples. This is a thirteen stage process. The stages in this process are types of channel promotions used, price incentives, rebates, events, merchandising, display, giveaways, contests, premiums, spiffs, loyalty programs, mdf, co op, trade ins, sweepstakes, referral, loyality programs, other.

Start Up Expenses Ppt PowerPoint Presentation Model Objects
This is a start up expenses ppt powerpoint presentation model objects. This is a one stage process. The stages in this process are startup expenses, legal.

Key Performance Indicator Analytics Dashboard Ppt PowerPoint Presentation Model Example Topics
This is a key performance indicator analytics dashboard ppt powerpoint presentation model example topics. This is a five stage process. The stages in this process are kpi proposal, kpi plan, kpi scheme.
KPI Metrics Vector Icon Ppt PowerPoint Presentation Layouts Slide
This is a kpi metrics vector icon ppt powerpoint presentation layouts slide. This is a three stage process. The stages in this process are kpi proposal, kpi plan, kpi scheme.

3D Bar Chart For Percentage Values Comparison Ppt PowerPoint Presentation Professional Visual Aids
This is a 3d bar chart for percentage values comparison ppt powerpoint presentation professional visual aids. This is a five stage process. The stages in this process are art, colouring, paint brush.

3D Charts For Comparing Amounts And Volume Ppt PowerPoint Presentation Show Deck
This is a 3d charts for comparing amounts and volume ppt powerpoint presentation show deck. This is a five stage process. The stages in this process are art, colouring, paint brush.

Column Chart Employee Value Proposition Ppt PowerPoint Presentation Slides Graphics Design
This is a column chart employee value proposition ppt powerpoint presentation slides graphics design. This is a two stage process. The stages in this process are business, management, strategy, analysis, marketing.
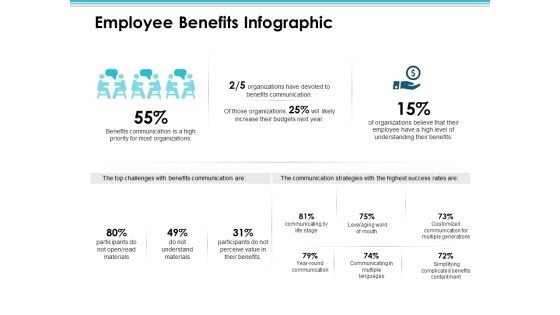
Employee Benefits Infographic Employee Value Proposition Ppt PowerPoint Presentation Styles Diagrams
This is a employee benefits infographic employee value proposition ppt powerpoint presentation styles diagrams. This is a three stage process. The stages in this process are business, management, strategy, analysis, marketing.

Data Analysis Vector Icons Ppt Powerpoint Presentation Layouts Gridlines
This is a data analysis vector icons ppt powerpoint presentation layouts gridlines. This is a two stage process. The stages in this process are data presentation, content presentation, information presentation.

Data Comparison And Analysis Chart Ppt Powerpoint Presentation File Background Images
This is a data comparison and analysis chart ppt powerpoint presentation file background images. This is a four stage process. The stages in this process are data presentation, content presentation, information presentation.

Data Interpretation Percentage Analysis Ppt Powerpoint Presentation Summary Icon
This is a data interpretation percentage analysis ppt powerpoint presentation summary icon. This is a six stage process. The stages in this process are data presentation, content presentation, information presentation.
Five Business Options Representation With Icons Ppt Powerpoint Presentation Portfolio Aids
This is a five business options representation with icons ppt powerpoint presentation portfolio aids. This is a five stage process. The stages in this process are data presentation, content presentation, information presentation.

Product Comparison Data Bar Graph Ppt Powerpoint Presentation Slides Show
This is a product comparison data bar graph ppt powerpoint presentation slides show. This is a four stage process. The stages in this process are data presentation, content presentation, information presentation.

Facility Maintenance Ppt Powerpoint Presentation Infographics Design Inspiration
This is a facility maintenance ppt powerpoint presentation infographics design inspiration. This is a two stage process. The stages in this process are fm, facilities management, support management.
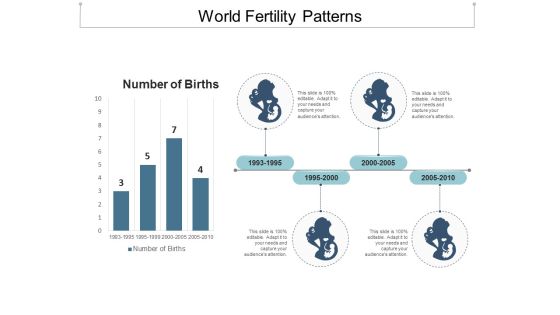
World Fertility Patterns Ppt Powerpoint Presentation Gallery Smartart
This is a world fertility patterns ppt powerpoint presentation gallery smartart. This is a four stage process. The stages in this process are fertility, productiveness, fecundity.

Learning And Experience Graph With Three Milestones Ppt PowerPoint Presentation Model Introduction
This is a learning and experience graph with three milestones ppt powerpoint presentation model introduction. This is a three stage process. The stages in this process are experience curve, learning curve.
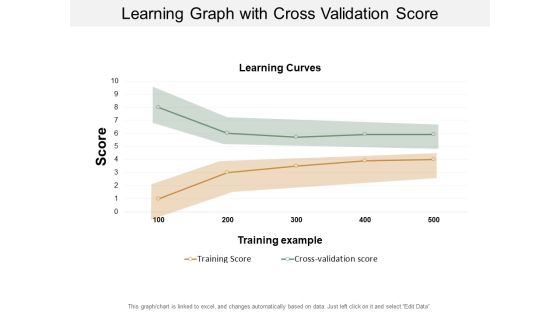
Learning Graph With Cross Validation Score Ppt PowerPoint Presentation Visual Aids Inspiration
This is a learning graph with cross validation score ppt powerpoint presentation visual aids inspiration. This is a two stage process. The stages in this process are experience curve, learning curve.
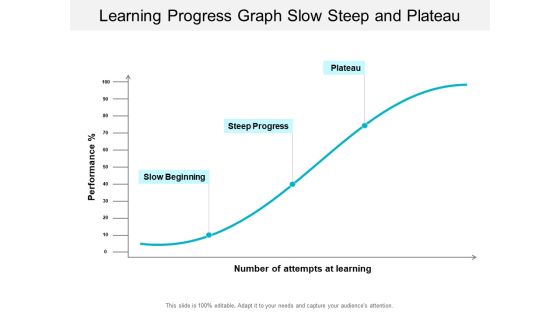
Learning Progress Graph Slow Steep And Plateau Ppt PowerPoint Presentation Professional Gallery
This is a learning progress graph slow steep and plateau ppt powerpoint presentation professional gallery. This is a three stage process. The stages in this process are experience curve, learning curve.
Data Research And Analysis For Mobile Users Ppt PowerPoint Presentation Icon Inspiration
This is a data research and analysis for mobile users ppt powerpoint presentation icon inspiration. This is a four stage process. The stages in this process are mobile analytics, mobile tracking, mobile web analytics.

Business Review And Performance Assessment Dashboards Ppt PowerPoint Presentation Infographics Show
This is a business review and performance assessment dashboards ppt powerpoint presentation infographics show. This is a four stage process. The stages in this process are year in review, yearly highlights, countdowns.

Car Dashboard And Speedometer Graphics Ppt PowerPoint Presentation File Graphics Template
This is a car dashboard and speedometer graphics ppt powerpoint presentation file graphics template. This is a four stage process. The stages in this process are fuel gauge, gas gauge, fuel containers.
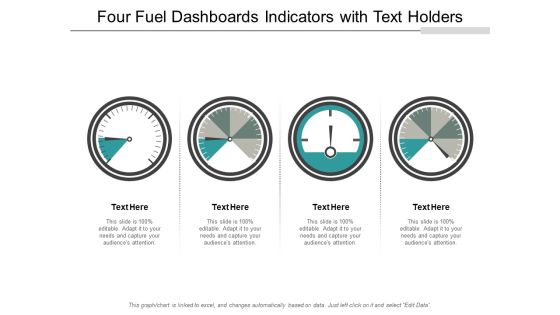
Four Fuel Dashboards Indicators With Text Holders Ppt PowerPoint Presentation File Graphics Design
This is a four fuel dashboards indicators with text holders ppt powerpoint presentation file graphics design. This is a four stage process. The stages in this process are fuel gauge, gas gauge, fuel containers.
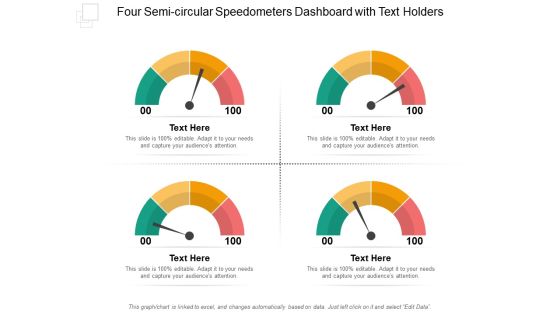
Four Semi Circular Speedometers Dashboard With Text Holders Ppt PowerPoint Presentation File Layouts
This is a four semi circular speedometers dashboard with text holders ppt powerpoint presentation file layouts. This is a four stage process. The stages in this process are fuel gauge, gas gauge, fuel containers.
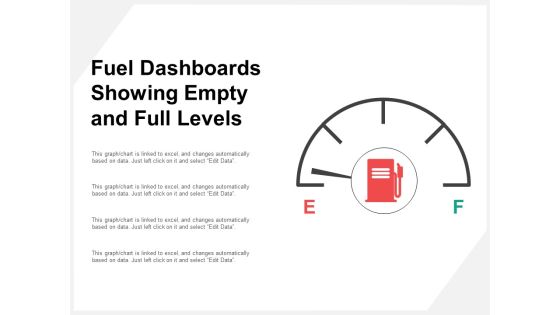
Fuel Dashboards Showing Empty And Full Levels Ppt PowerPoint Presentation Professional Slide Portrait
This is a fuel dashboards showing empty and full levels ppt powerpoint presentation professional slide portrait. This is a four stage process. The stages in this process are fuel gauge, gas gauge, fuel containers.

Fuel Levels Indicators And Dashboards Ppt PowerPoint Presentation Outline Skills
This is a fuel levels indicators and dashboards ppt powerpoint presentation outline skills. This is a three stage process. The stages in this process are fuel gauge, gas gauge, fuel containers.
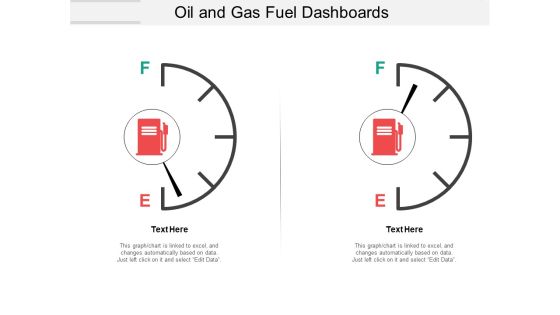
Oil And Gas Fuel Dashboards Ppt PowerPoint Presentation File Introduction
This is a oil and gas fuel dashboards ppt powerpoint presentation file introduction. This is a two stage process. The stages in this process are fuel gauge, gas gauge, fuel containers.
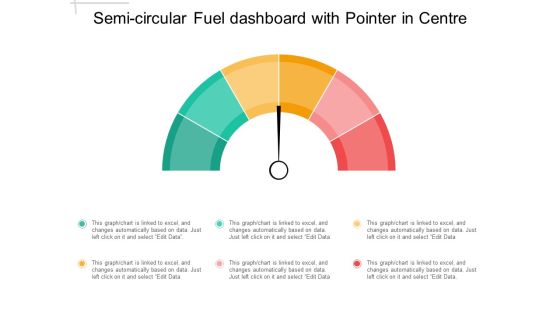
Semi Circular Fuel Dashboard With Pointer In Centre Ppt PowerPoint Presentation Outline Visuals
This is a semi circular fuel dashboard with pointer in centre ppt powerpoint presentation outline visuals. This is a three stage process. The stages in this process are fuel gauge, gas gauge, fuel containers.

Three Dashboard Speed Indicators With Text Holders Ppt PowerPoint Presentation Summary Layout
This is a three dashboard speed indicators with text holders ppt powerpoint presentation summary layout. This is a three stage process. The stages in this process are fuel gauge, gas gauge, fuel containers.
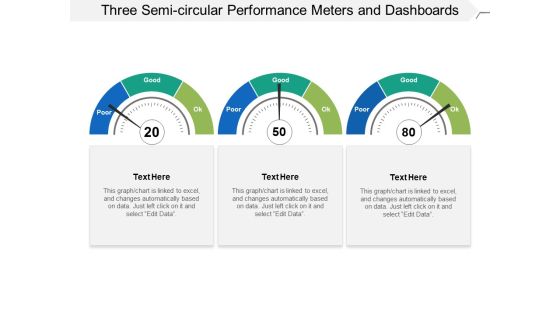
Three Semi Circular Performance Meters And Dashboards Ppt PowerPoint Presentation Slides Influencers
This is a three semi circular performance meters and dashboards ppt powerpoint presentation slides influencers. This is a three stage process. The stages in this process are fuel gauge, gas gauge, fuel containers.


 Continue with Email
 Sign up for an account
 Home
Home


