Financial Budget
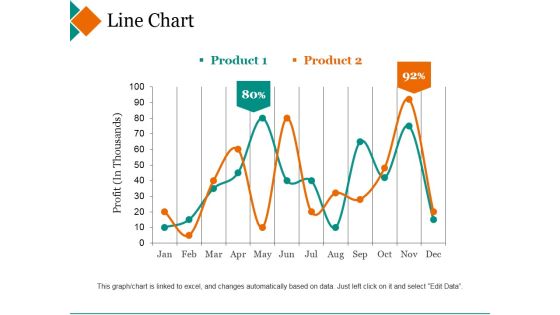
Line Chart Ppt PowerPoint Presentation Inspiration Deck
This is a line chart ppt powerpoint presentation inspiration deck. This is a two stage process. The stages in this process are product, profit, percentage, finance, line graph.

Channel Kpis Ppt PowerPoint Presentation Inspiration Aids
This is a channel kpis ppt powerpoint presentation inspiration aids. This is a four stage process. The stages in this process are business, marketing, graph, percentage, finance.

Channel Kpis Ppt PowerPoint Presentation Model Smartart
This is a channel kpis ppt powerpoint presentation model smartart. This is a four stage process. The stages in this process are business, marketing, finance, years, percentage.

Area Chart Ppt PowerPoint Presentation Gallery Information
This is a area chart ppt powerpoint presentation gallery information. This is a two stage process. The stages in this process are product, area chart, business, finance, marketing.

Radar Chart Ppt PowerPoint Presentation Inspiration Rules
This is a radar chart ppt powerpoint presentation inspiration rules. This is a two stage process. The stages in this process are radar chart, business, marketing, finance, management.

Comparison Ppt PowerPoint Presentation Infographics Rules
This is a comparison ppt powerpoint presentation infographics rules. This is a two stage process. The stages in this process are male, female, comparison, percentage, finance.

Filled Rader Ppt PowerPoint Presentation Pictures Format
This is a filled rader ppt powerpoint presentation pictures format. This is a two stage process. The stages in this process are product, radar, finance, business, management.

Radar Chart Ppt PowerPoint Presentation Background Designs
This is a radar chart ppt powerpoint presentation background designs. This is a two stage process. The stages in this process are radar chart, product, finance, business, shapes.

Radar Chart Ppt PowerPoint Presentation Infographics Portfolio
This is a radar chart ppt powerpoint presentation infographics portfolio. This is a two stage process. The stages in this process are product, finance, shapes, business, marketing.

Radar Chart Ppt PowerPoint Presentation Ideas Portrait
This is a radar chart ppt powerpoint presentation ideas portrait. This is a two stage process. The stages in this process are product, radar chart, finance, business, marketing.

Radar Chart Ppt PowerPoint Presentation Pictures Themes
This is a radar chart ppt powerpoint presentation pictures themes. This is a two stage process. The stages in this process are product, radar chart, finance, business.
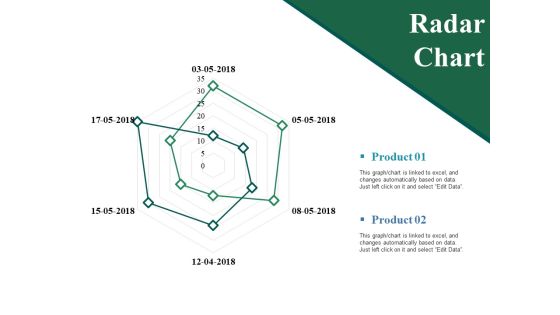
Radar Chart Ppt PowerPoint Presentation Show Guidelines
This is a radar chart ppt powerpoint presentation show guidelines. This is a two stage process. The stages in this process are product, radar chart, business, finance, marketing.
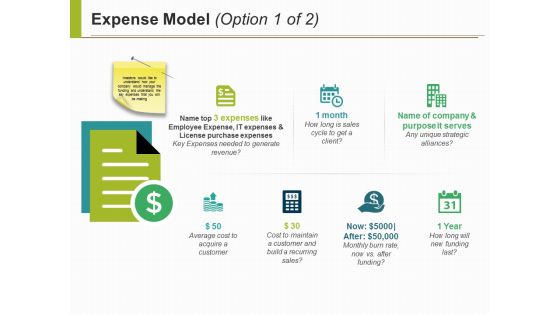
Expense Model Ppt PowerPoint Presentation Slides Ideas
This is a expense model ppt powerpoint presentation slides ideas. This is a seven stage process. The stages in this process are icons, marketing, strategy, finance, planning.

Radar Chart Ppt PowerPoint Presentation Styles Themes
This is a radar chart ppt powerpoint presentation styles themes. This is a two stage process. The stages in this process are product, finance, shape, radar chart, business.
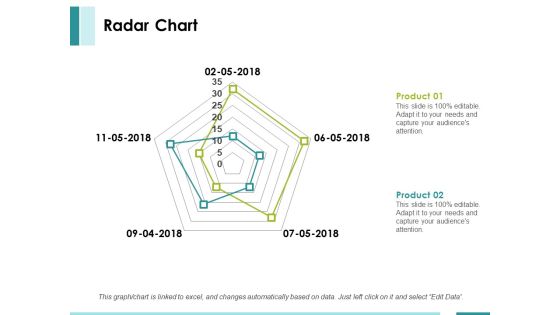
Radar Chart Ppt PowerPoint Presentation Summary Layout
This is a radar chart ppt powerpoint presentation summary layout. This is a two stage process. The stages in this process are product, finance, shape, radar chart, business.

Radar Chart Ppt PowerPoint Presentation File Rules
This is a radar chart ppt powerpoint presentation file rules. This is a two stage process. The stages in this process are product, radar chart, finance.

Template 2 Ppt PowerPoint Presentation Model Themes
This is a template 2 ppt powerpoint presentation model themes. This is a six stage process. The stages in this process are business, finance, marketing, icons, strategy.

Template 4 Ppt PowerPoint Presentation Infographic Template Images
This is a template 4 ppt powerpoint presentation infographic template images. This is a four stage process. The stages in this process are business, finance, marketing, icons, strategy.

Clustered Bar Ppt PowerPoint Presentation Summary Ideas
This is a clustered bar ppt powerpoint presentation summary ideas. This is a eight stage process. The stages in this process are clustered bar, finance, marketing, business, strategy.
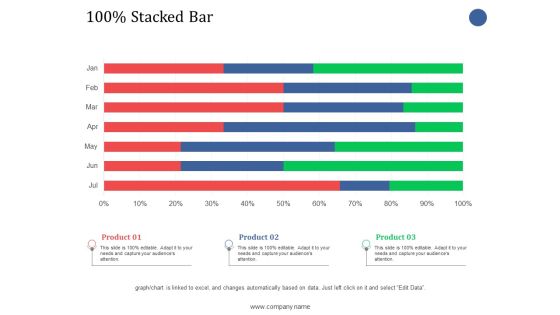
Stacked Bar Ppt PowerPoint Presentation Infographic Template Graphics
This is a stacked bar ppt powerpoint presentation infographic template graphics. This is a three stage process. The stages in this process are stacked bar, finance, product, business.

Stacked Bar Ppt PowerPoint Presentation Visual Aids Pictures
This is a stacked bar ppt powerpoint presentation visual aids pictures. This is a two stage process. The stages in this process are product, percentage, finance, business, marketing.

Break Point Chart For Quality Analysis Powerpoint Slide Show
This is a break point chart for quality analysis powerpoint slide show. This is a one stage process. The stages in this process are total variable costs, fixed costs, quality sold.
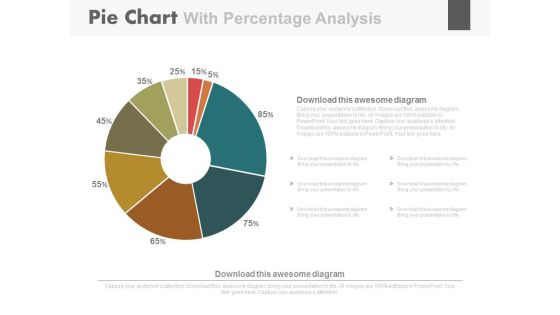
Pie Chart For Strategic Sales Plan Powerpoint Slides
This PowerPoint template has been designed with diagram of pie chart. This PPT slide can be used to prepare presentations on strategic sales plan. You can download finance PowerPoint template to prepare awesome presentations.
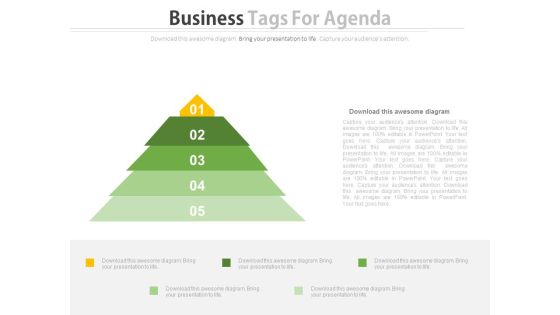
Triangle Of Five Business Steps Powerpoint Slides
This PowerPoint template has been designed with five steps triangle diagram. This PPT slide can be used to display five points of marketing agenda. You can download finance PowerPoint template to prepare awesome presentations.

Adjusted Roce Template 1 Ppt PowerPoint Presentation Styles Background Designs
This is a adjusted roce template 1 ppt powerpoint presentation styles background designs. This is a seven stage process. The stages in this process are bar graph, finance, year, business, marketing.

Volume High Low Close Chart Ppt PowerPoint Presentation Gallery Shapes
This is a volume high low close chart ppt powerpoint presentation gallery shapes. This is a five stage process. The stages in this process are high, volume, low, close, finance.

Clustered Column Line Ppt PowerPoint Presentation Slide
This is a clustered column line ppt powerpoint presentation slide. This is a three stage process. The stages in this process are bar graph, growth, finance, product, sales in percentage.

Clustered Column Line Ppt PowerPoint Presentation Inspiration Guidelines
This is a clustered column line ppt powerpoint presentation inspiration guidelines. This is a three stage process. The stages in this process are product, sales in percentage, graph, line, finance, business.
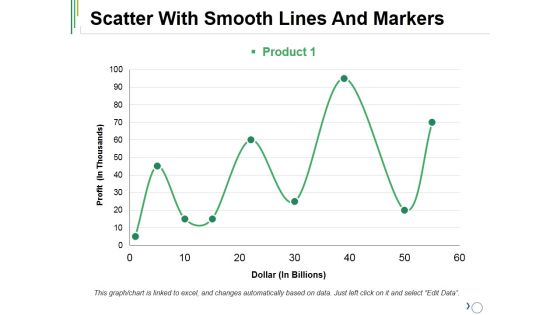
Scatter With Smooth Lines And Markers Ppt PowerPoint Presentation Outline Mockup
This is a scatter with smooth lines and markers ppt powerpoint presentation outline mockup. This is a one stage process. The stages in this process are product, finance, line graph, business, management.
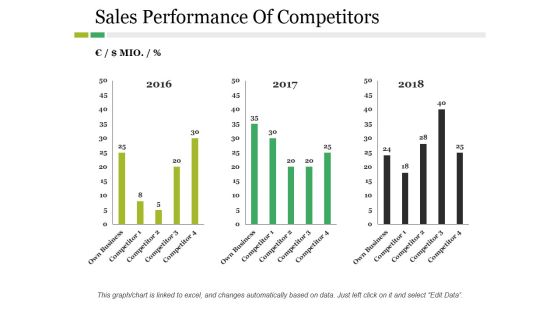
Sales Performance Of Competitors Ppt PowerPoint Presentation Inspiration Example
This is a sales performance of competitors ppt powerpoint presentation inspiration example. This is a three stage process. The stages in this process are business, marketing, year, bar graph, finance.

Competitors Average Price Product Ppt PowerPoint Presentation Icon Layout
This is a competitors average price product ppt powerpoint presentation icon layout. This is a five stage process. The stages in this process are company, bar graph, finance, business, marketing.

Radar Chart Ppt PowerPoint Presentation Inspiration Infographic Template
This is a radar chart ppt powerpoint presentation inspiration infographic template. This is a two stage process. The stages in this process are radar chart, product, business, finance, marketing.
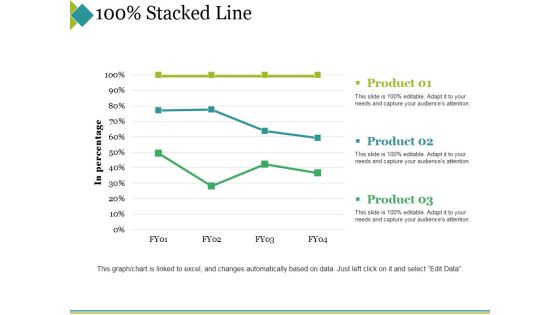
Stacked Line Ppt PowerPoint Presentation Professional Background Designs
This is a stacked line ppt powerpoint presentation professional background designs. This is a three stage process. The stages in this process are product, in percentage, stacked line, finance, business.

Radar Chart Ppt PowerPoint Presentation Infographics Visual Aids
This is a radar chart ppt powerpoint presentation infographics visual aids. This is a two stage process. The stages in this process are radar chart, product, finance, business, marketing.

Radar Chart Ppt PowerPoint Presentation Portfolio Graphics Template
This is a radar chart ppt powerpoint presentation portfolio graphics template. This is a two stage process. The stages in this process are product, finance, shape, radar chart, business.

Radar Chart Ppt PowerPoint Presentation Professional Infographic Template
This is a radar chart ppt powerpoint presentation professional infographic template. This is a two stage process. The stages in this process are product, finance, shape, radar chart, business.

Open High Low Close Chart Ppt PowerPoint Presentation Professional Inspiration
This is a open high low close chart ppt powerpoint presentation professional inspiration. This is a five stage process. The stages in this process are high, low, close, business, finance.

Donut Pie Chart Ppt PowerPoint Presentation Show Graphics Download
This is a donut pie chart ppt powerpoint presentation show graphics download. This is a three stage process. The stages in this process are percentage, finance, donut, business, marketing.

Circular Steps For Market Entry Strategy Powerpoint Slides
This PowerPoint template contains graphics of circular steps. You may download this PPT slide design to display market entry strategy. You can easily customize this template to make it more unique as per your need.

Circle Chart For Value Analysis Powerpoint Slides
This PowerPoint template has been designed for business presentations and corporate slides. The PowerPoint template has a high quality design. You can download this PowerPoint slide for corporate presentations or annual meeting and business plans.

Target Chart For Strategic Management Process Powerpoint Slides
This PowerPoint template has been designed with four steps target chart. The PowerPoint template may be used to display strategic management process. You can download this PowerPoint slide for corporate presentations or annual meeting and business plans.

Bar Graph For Year Based Analysis Powerpoint Slides
This PowerPoint template has been designed with year based bar graph. This diagram may be used to display yearly statistical analysis. Use this PPT slide design to make impressive presentations.

Business Steps Diagram With Icons Powerpoint Slides
Visually support your presentation with our above template containing graphics of stairs diagram. It helps to portray directions of business actions. Etch your views in the brains of your audience with this diagram slide.
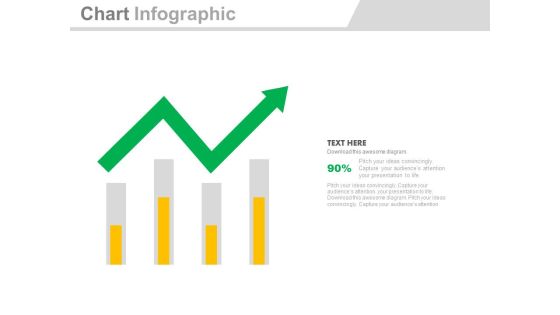
Four Bars With Green Growth Arrow Powerpoint Slides
Four bars with green arrow have been displayed in this business slide. This business diagram helps to exhibit process of business planning. Use this diagram to build an exclusive presentation.

Four Circles With Percentage Data Display Powerpoint Slides
This PowerPoint template has been designed with graphics of four circles. Download this PPT slide to display percentage data display. Use this professional template to build an exclusive presentation.
Four Colored Text Boxes With Icons Powerpoint Slides
This PowerPoint template has been designed with graphics of four text boxes. Download this PPT slide to display percentage data display. Use this professional template to build an exclusive presentation.
Four Linear Steps And Icons Powerpoint Slides
This PPT slide has been designed with four linear text boxes with icons. This PowerPoint template helps to exhibit process of business planning. Use this diagram slide to build an exclusive presentation.

Four Steps For Organizational Learning Methods Powerpoint Slides
Four text boxes have been displayed in this business slide. This PowerPoint template helps to exhibit organizational learning methods. Use this diagram slide to build an exclusive presentation.

Infographic Diagram For Business Process Analysis Powerpoint Slides
This PowerPoint slide contains business infographic diagram. This professional slide may be used to display business process analysis. Use this business template to make impressive presentations.
Mountain Chart With Social Media Icons Powerpoint Slides
The above PPT template displays mountain chart with social media icons. This PowerPoint template has been designed to exhibit users of social media. Download this PPT slide to attract the attention of your audience.
Process Flow Diagram With Business Icons Powerpoint Slides
Emphatically define your message with our above infographic template. This PowerPoint template may be used to display business process flow. Grab the attention of your listeners with this slide.
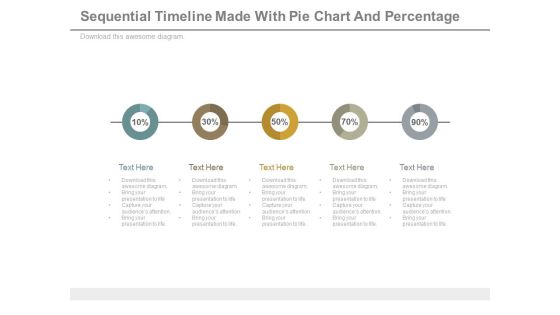
Sequential Timeline Diagram With Percentage Values Powerpoint Slides
This diagram contains graphics of linear circles timeline diagram. Download this diagram slide to display business planning and management. This diagram is editable you can edit text, color, shade and style as per you need.
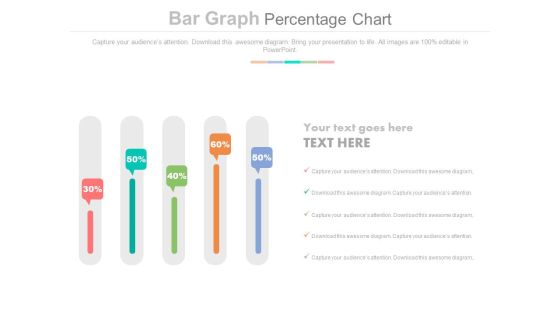
Sliders Percentage Data Chart Powerpoint Slides
This PowerPoint slide has been designed with slider chart and percentage data. This PPT diagram may be used to display business trends. This diagram slide can be used to make impressive presentations.
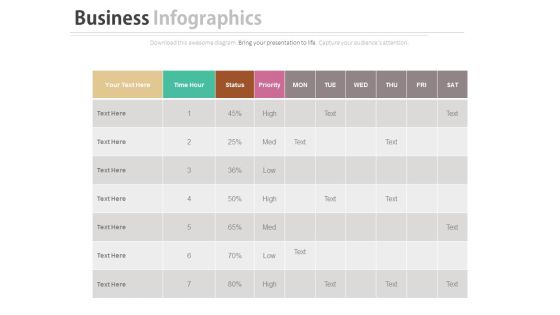
Work Sheet For Daily Activity Plan Schedule Powerpoint Slides
Our above business slide contains graphics of daily worksheet. This PowerPoint slide may be used to exhibit activity plan and schedule. Capture the attention of your audience with this slide.
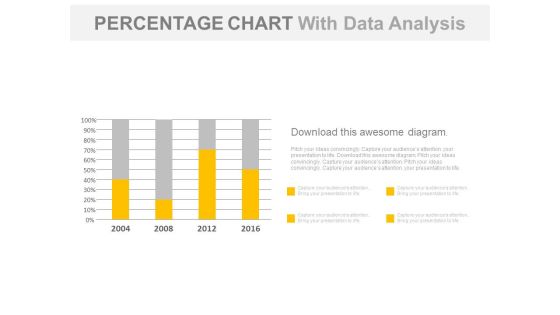
Year Based Chart With Percentage Data Analysis Powerpoint Slides
Our above business slide contains year based statistical chart. This PowerPoint template can be used to display percentage data analysis. Capture the attention of your audience with this slide.

Bar Graph For Profit Growth Analysis Powerpoint Slides
This PowerPoint template has been designed with bar graph with percentage values. This diagram is useful to exhibit profit growth analysis. This diagram slide can be used to make impressive presentations.

Bar Graph For Yearly Statistical Analysis Powerpoint Slides
This PowerPoint template has been designed with bar graph. This PowerPoint diagram is useful to exhibit yearly statistical analysis. This diagram slide can be used to make impressive presentations.

Circular Diagram For Percentage Analysis Powerpoint Slides
This PowerPoint slide has been designed with circular diagram with social media icons. This diagram slide may be used to display users of social media. Prove the viability of your ideas with this professional slide.

Data Driven Comparison Charts For Analysis Powerpoint Slides
You can download this PowerPoint template to display statistical data and analysis. This PPT slide contains data driven comparison charts. Draw an innovative business idea using this professional diagram.
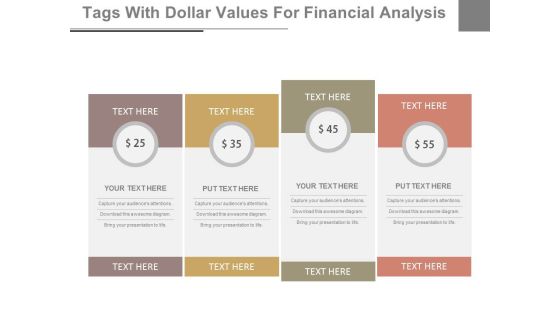
Dollar Value Pricing Table Powerpoint Slides
This PowerPoint template has been designed with dollar value pricing table chart. This PPT slide may be used for sample marketing proposal. Download this slide to build unique presentation.


 Continue with Email
 Sign up for an account
 Home
Home